

EnerG uses two navigation layouts in KODE OS. You work at the portfolio view when you compare sites across your estate. You switch to the building view when you configure or analyze one property.
Select a building from
Home, then click Go to Building to enter the building view. Use the building selector in the top bar to return to the portfolio.
Portfolio view
The portfolio view is your default landing experience. The left sidebar lists portfolio-wide areas only.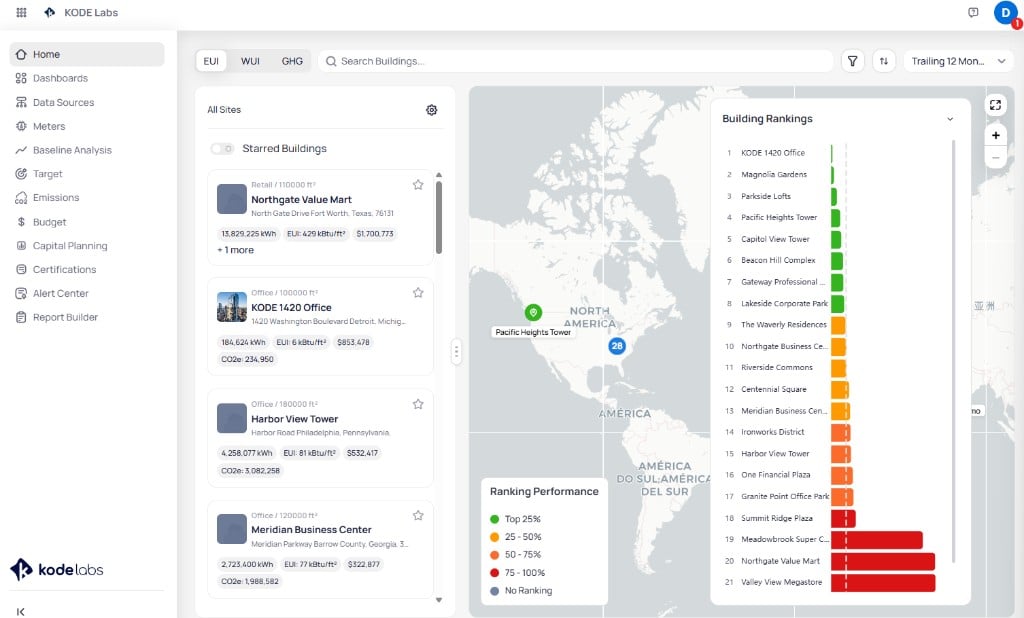
Portfolio Home view with building list, map, rankings, and EUI, WUI, and GHG metric toggles
Some labels vary by deployment. If you do not see an item, confirm your role and EnerG entitlements in KODE OS.
Building view
The building view opens after you select a site. The left sidebar lists building-specific areas only.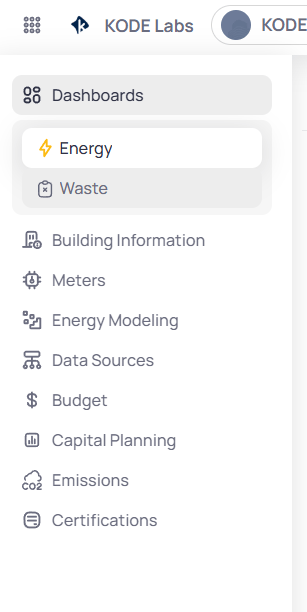
Building sidebar with Dashboards expanded showing Energy and Waste
Primary sidebar
Building baseline windows are configured from Dashboards > Energy > Baseline Analysis. See Configure building baseline windows.
Dashboards submenu
ExpandDashboards to switch between commodity dashboards.
Energy Modeling submenu
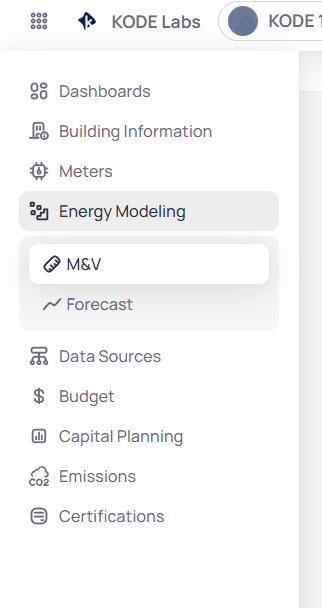
Building sidebar with Energy Modeling expanded showing M&V and Forecast
Budget submenu
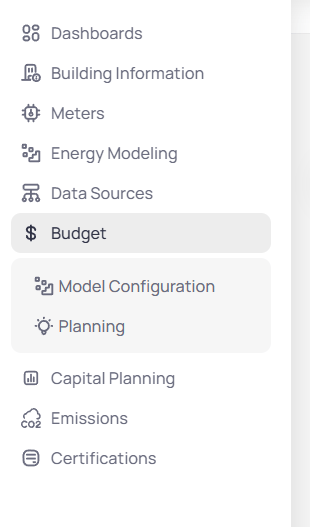
Building sidebar with Budget expanded showing Model Configuration and Planning
Energy dashboard report menu
When you openDashboards > Energy, a secondary menu lists report types.
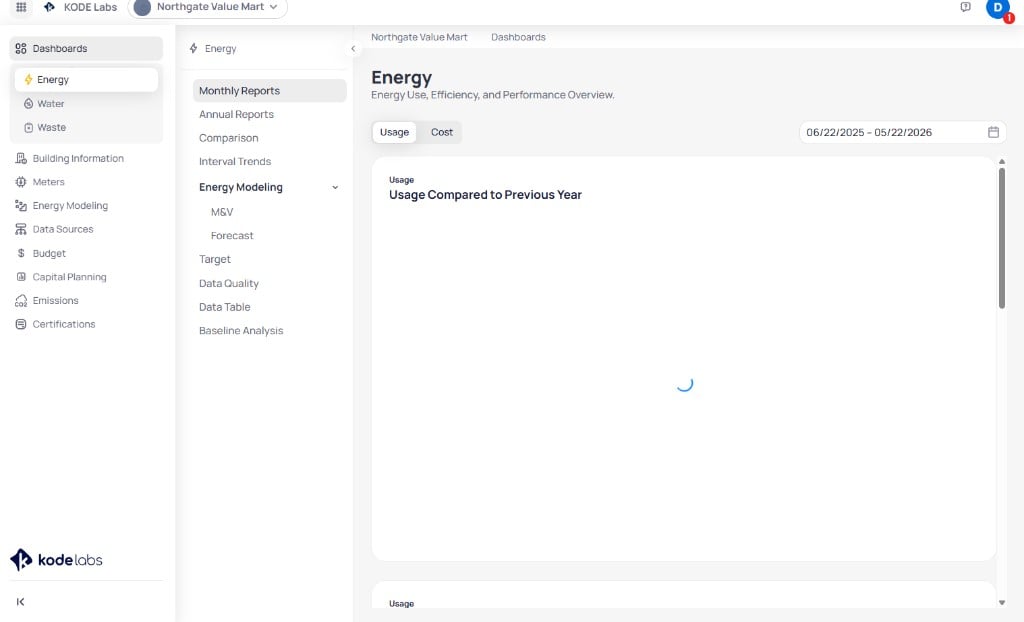
Building Energy dashboard with report menu and Usage and Cost toggles
Deployments with a top-level Data Quality group in the building sidebar also include Data quality overview, Data completeness, and Meter comparisons.
How portfolio and building views relate
Portfolio settings and data sources shape what each building can use. Building-level work rolls up to portfolio dashboards, rankings, and alerts.Next steps
Portfolio Home
Start in the portfolio view and select a building.
Portfolio meters
Manage meters across the portfolio.
Building meters
Review meter detail for one building.
Building Energy dashboard
Analyze energy reports for one building.