

Meters in the building view left sidebar after you select a site. You review meter lists, billing data, and properties for that building only.
To assign meters or manage links across the estate, use Portfolio meters in the portfolio view.
Navigate to building meters
Select a building
Go to Building at the top of the detail panel.Open Meters
Meters in the building left sidebar. The page lists meters grouped by service category.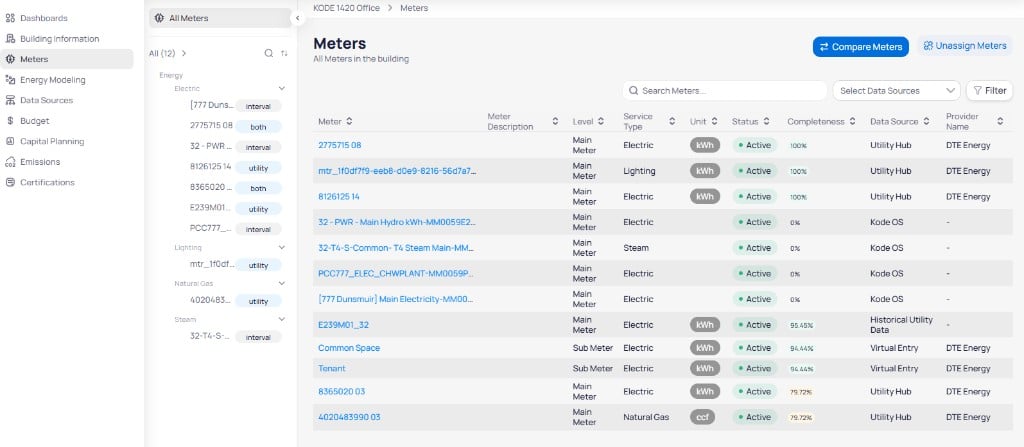
Building Meters page with category tree and meter table
Understand the meter list
The left panel groups meters by service category: Energy (Electric, Lighting, Natural Gas, Steam), Water, and Waste. Each meter displays its number and a badge indicating its type.- utility — the meter receives monthly billing data from a provider
- interval — the meter receives high-frequency (hourly or 15-minute)
- both — the meter has utility billing data and interval data
All at the top of the meter list to see the total count, such as All (12). Select a category to narrow the table. Click a meter row or name to open its detail view.
For how bills and interval reads feed meters, see Data sources and meters.
Meter table columns
The main table lists every meter assigned to the building. For what each column shows, such asLevel, Completeness, and Data Source, see Meter table columns.
Filter and search meters
Use the search bar and filter controls above the table to find meters quickly.
Meter search and filter controls
Compare meters
Click Compare Meters in the top-right corner to open Meter Comparison Sets. Check Completeness in the meters table first. Low scores often mean billing data is missing before a comparison is meaningful. See Meter comparisons for the full workflow, screenshots, and threshold guidance.Unassign meters from the building
ClickUnassign Meters to remove meters from the building record without deleting historical data from the portfolio.
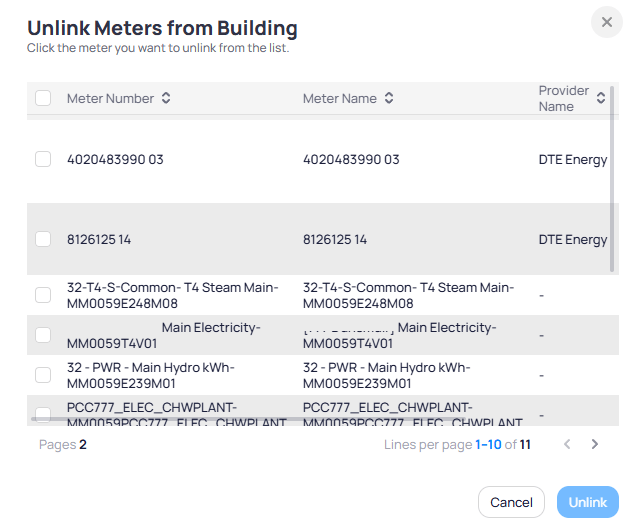
Unlink Meters from Building dialog with meter selection table
Unlink. Use Portfolio meters when you need to assign meters to a different building.
Review meter detail
Select any meter from the list to open its detail view. The header shows the meter number, a date range picker, and action buttons Edit Meter Data, + Add Meter Data, and a three-dot overflow menu for bulk import.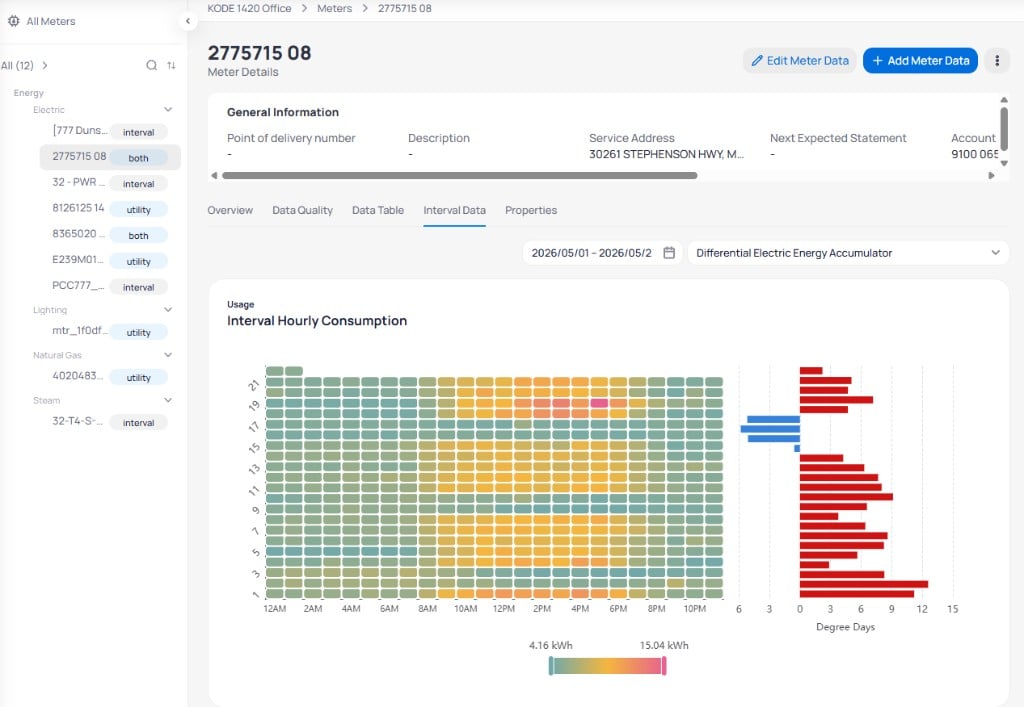
Meter detail header with Edit Meter Data, Add Meter Data, and overflow menu
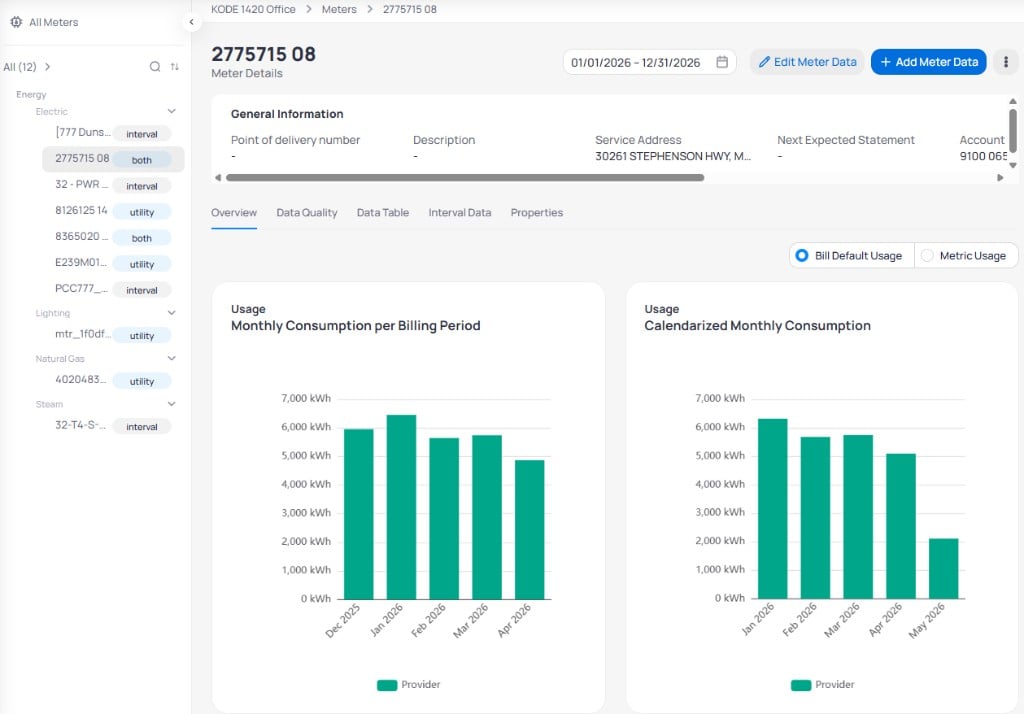
Meter detail with General Information and Overview charts
General information
The General Information card summarizes account metadata from the utility feed, such as service address, account number, and connection status. For each field, see General information fields.Overview tab
TheOverview tab shows two side-by-side charts for the selected year.
- Monthly Consumption per Billing Period — raw usage totals per billing cycle, with Provider data in teal and Accrued data in striped bars
- Calendarized Monthly Consumption — the same data after spreads it across calendar months so January always means January
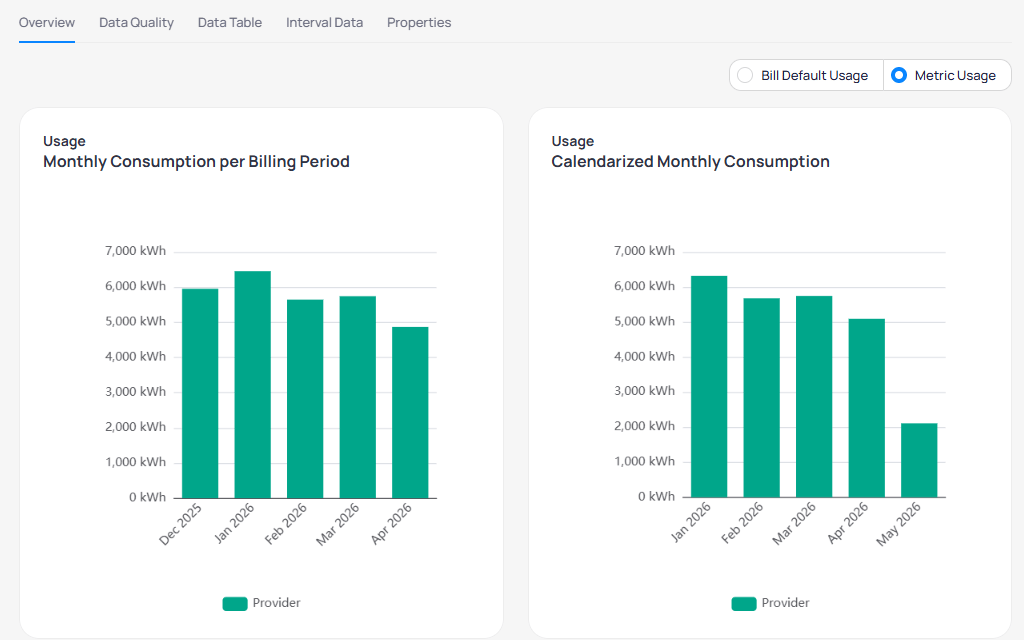
Overview with Metric Usage selected
Data Quality tab
TheData Quality tab shows billing coverage for the selected meter and lists each bill period in a table below the chart. Use it when you investigate completeness gaps. See Data completeness for how scores roll up and how to fix common causes.
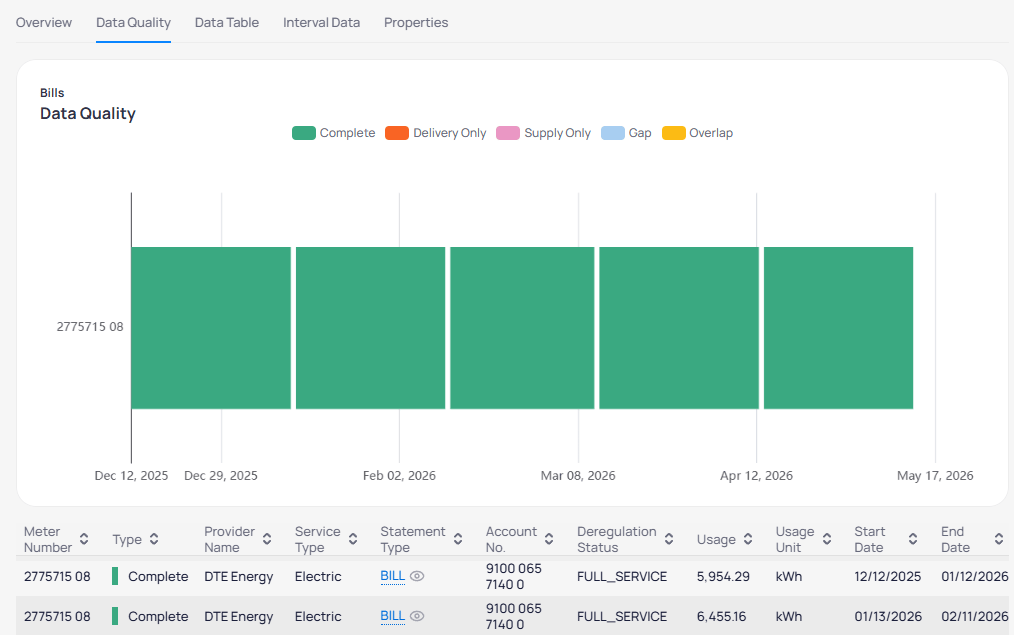
Data Quality tab with Bills Data Quality chart and billing table
Bills Data Quality chart
The Bills Data Quality chart is a horizontal timeline for the open meter. Color segments show how each period is classified, from complete coverage to gaps and overlaps. For the color legend, see Data quality legend.Billing detail table
The table lists individual billing records for the meter, including provider, service type, statement type, usage, and billing dates. For column definitions, see Data table columns. When a bill PDF was uploaded with the record, Statement Type shows a BILL link with a view icon. Click BILL to open the PDF in a new viewer so you can verify usage and charges against the table row.Data Table tab
TheData Table tab lists every billing record for the open meter in a sortable table. Use service tag filters and Export to download rows for offline review.
Billing Period and Calendarized tabs
Switch between two views of the same underlying data.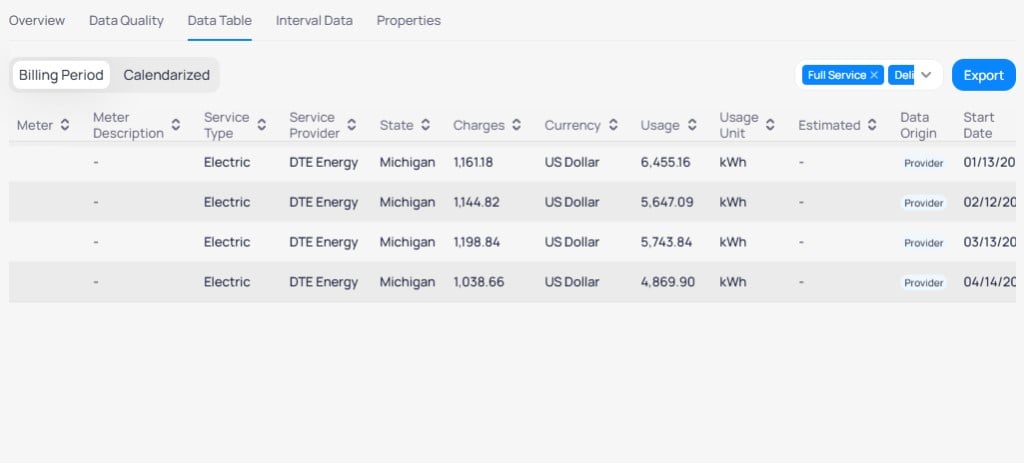
Data Table Billing Period tab for a single meter
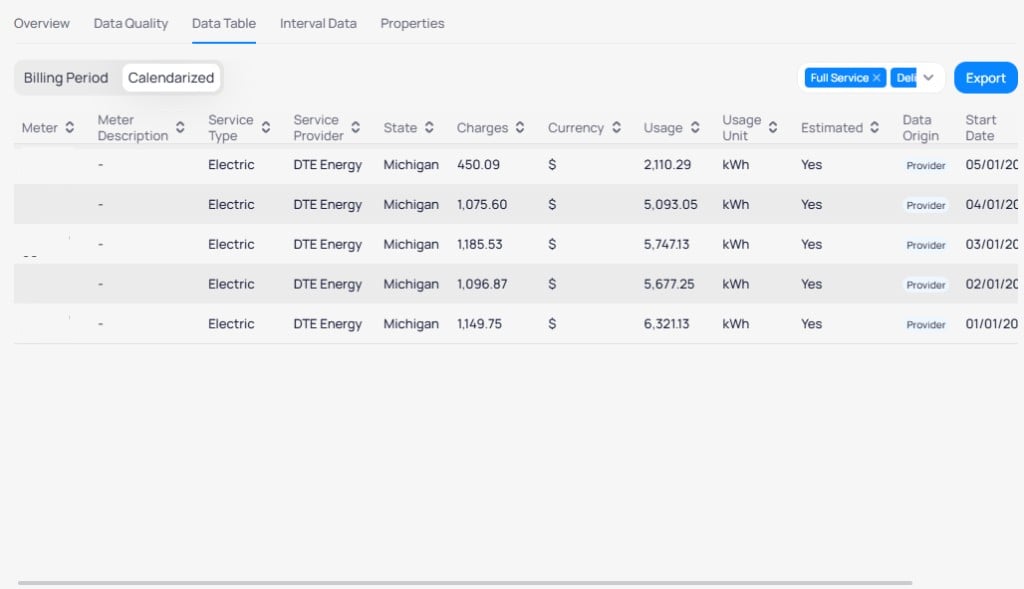
Data Table Calendarized tab for a single meter
Table columns
Sort any column with the header arrows. Scroll horizontally to reach Start Date and End Date. For what each column shows, see Data table columns. A Billing Period row with Data Origin Provider and no Estimated flag reflects a final bill from the utility. Calendarized rows with Estimated Yes may appear before the final bill posts for that month.Export meter data
Click Export on the Data Table tab to download the filtered rows. The Data Export dialog offers three export modes.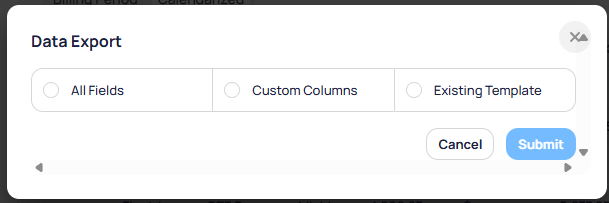
Data Export dialog with export mode options
Choose an export mode
Configure custom columns (optional)
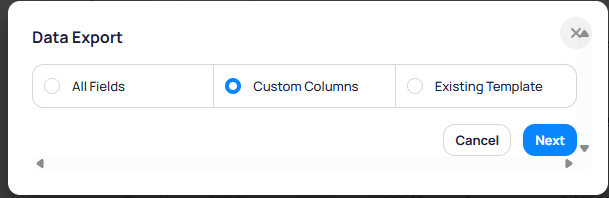
Custom Columns selected in Data Export
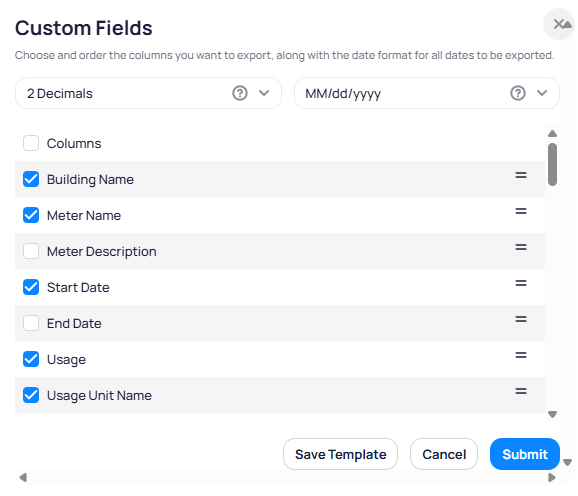
Custom Fields column picker with decimal and date format
Save a template (optional)
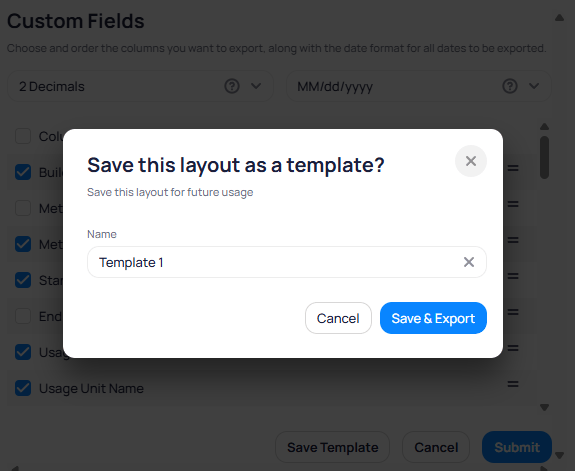
Save layout as template before export
Use an existing template (optional)
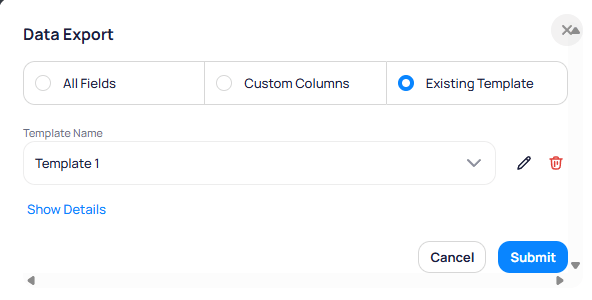
Existing Template selected with template dropdown
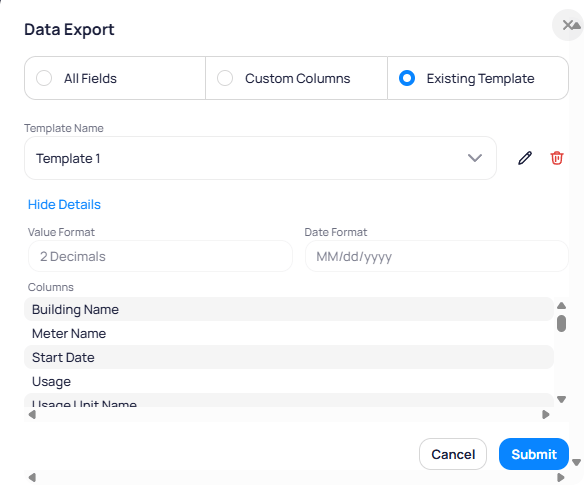
Template details with column list and formats
Submit the export
Interval Data tab
TheInterval Data tab appears when the meter has high-frequency reads. Use it to analyze sub-daily patterns that monthly bills cannot show.
Controls
Interval Hourly Consumption
Interval Hourly Consumption is a heat map with hours of day on the horizontal axis and days on the vertical axis. Color intensity reflects kWh for each hour. A Degree Days chart on the right shares the same day axis. Red bars extend right for heating degree days; blue bars extend left for cooling degree days. Use it to relate load shape to weather.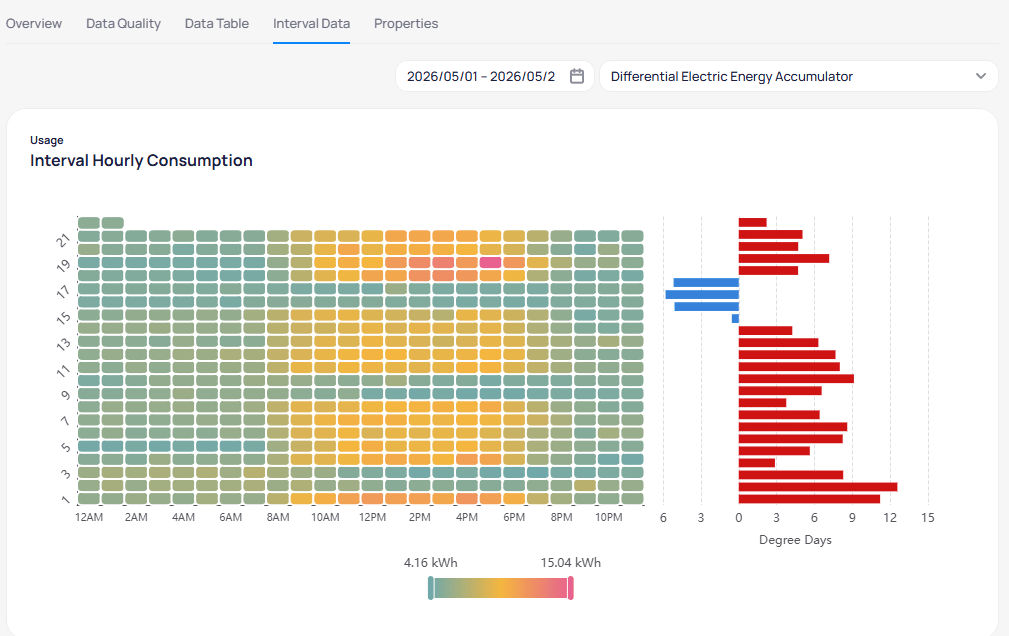
Interval Hourly Consumption heat map with Degree Days
Interval Daily Consumption
Interval Daily Consumption plots total daily usage as teal bars. An orange Temperature line on the secondary axis shows average daily temperature in °F when weather data is available.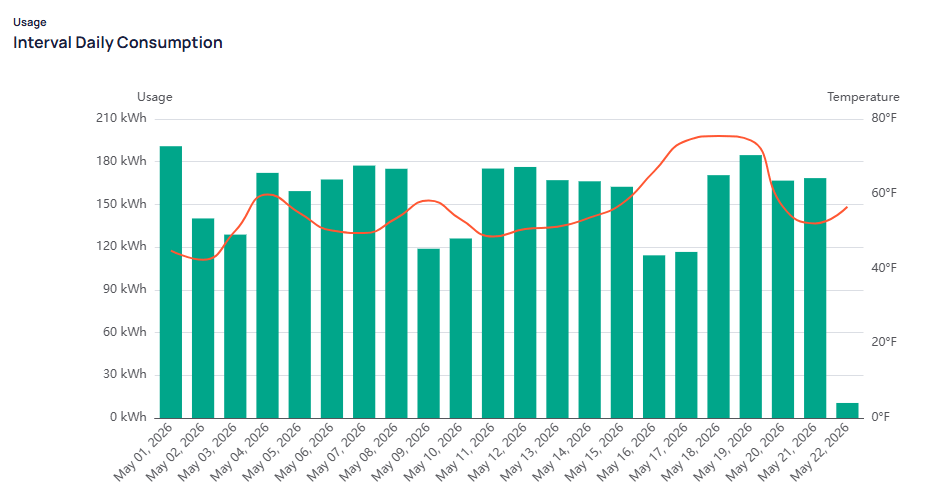
Interval Daily Consumption with temperature overlay
Daily Consumption by calendar month
Daily Consumption (year view) is a heat map with one row per day of month (1–31) and one column per calendar month. Color intensity reflects daily kWh across the selected year.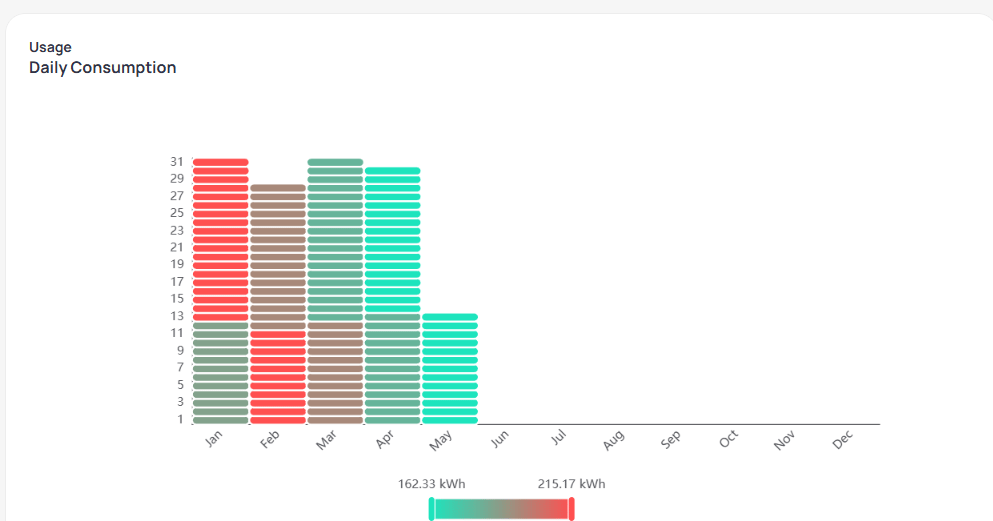
Daily Consumption heat map by day of month and calendar month
Properties tab
TheProperties tab displays configuration for the open meter, such as scope, unit, service type, and Include In Metrics. Click Edit properties to change values, then save. For each field, see Meter properties.
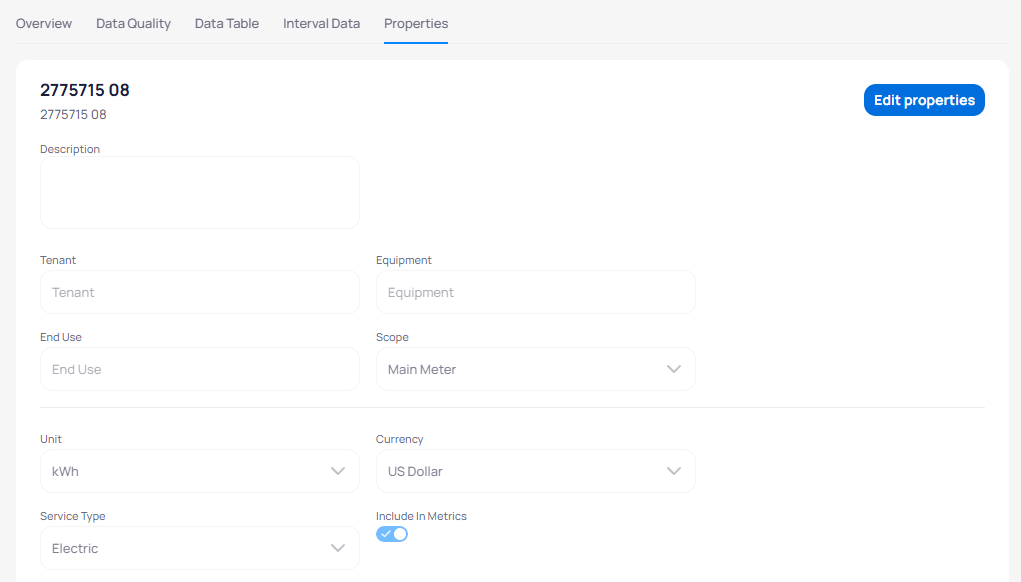
Properties tab read-only view
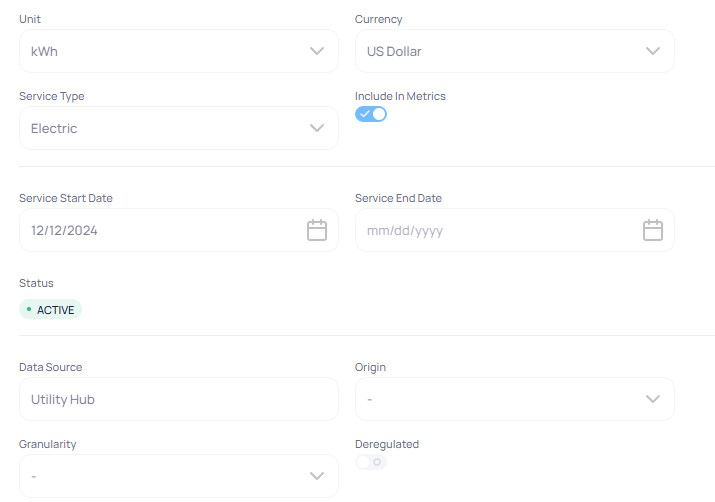
Properties tab in edit mode with service dates and data source
Edit billing records
You modify individual billing records when you find errors or need to correct imported data.Open the meter detail
Click Edit Meter Data
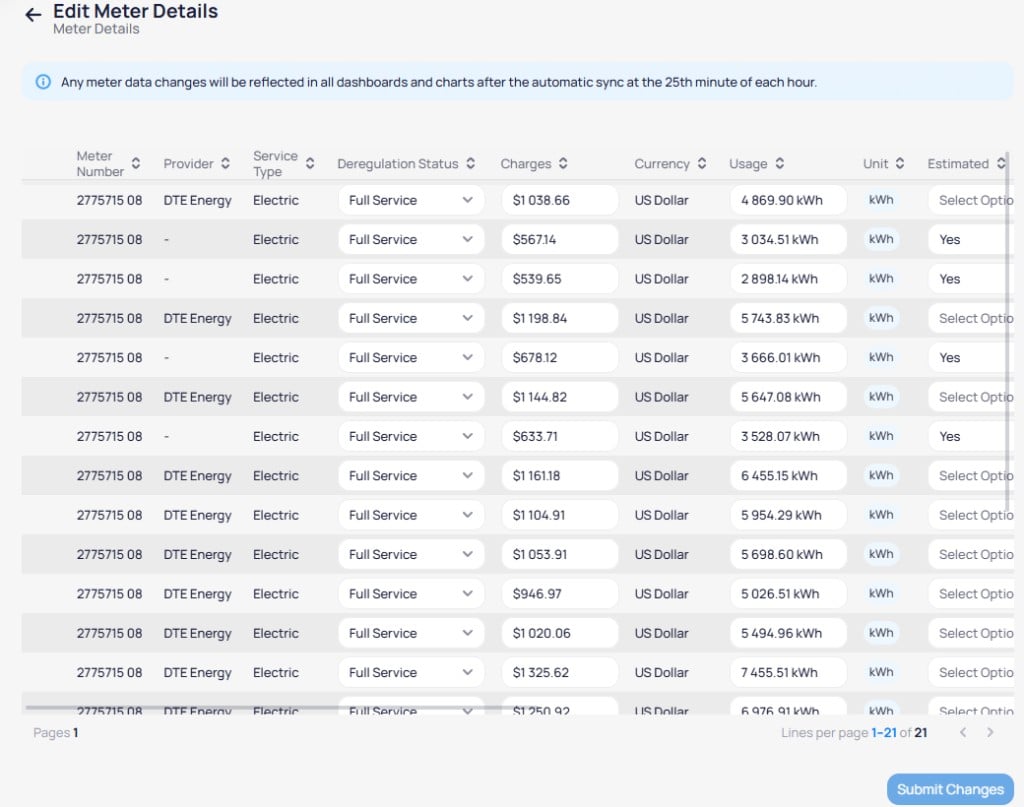
Edit Meter Details table with usage and cost columns

Edit Meter Details table with dates, status, and reference columns
Modify values
Submit changes
Upload a bill reference
In Edit Meter Details, click the upload control in the Reference column for a row. The Upload Files dialog opens for that meter.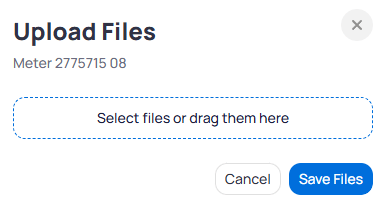
Upload Files dialog for a meter billing row
Review version history
Click the circular arrow icon in Actions to open Activity Logs. Expand a version to see the full snapshot EnerG stored for that row, including building context, charges, usage, and billing period type.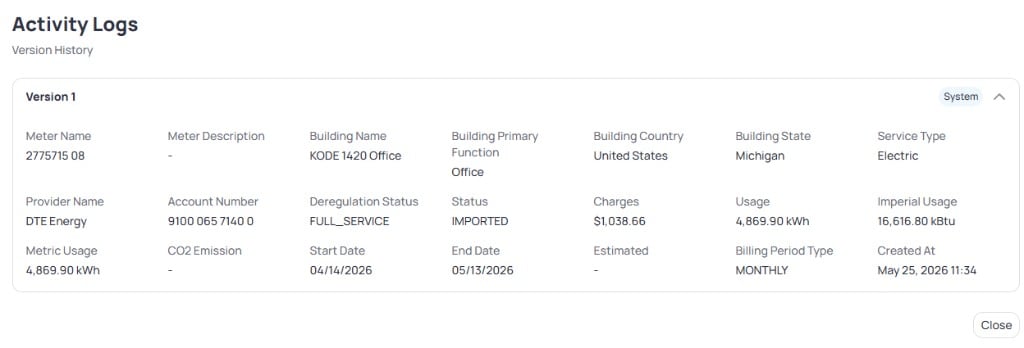
Activity Logs version history for a billing row
Bulk import meter data
Use bulk import when you need to add many billing rows at once from a spreadsheet template.Open the meter detail
Open Bulk Import
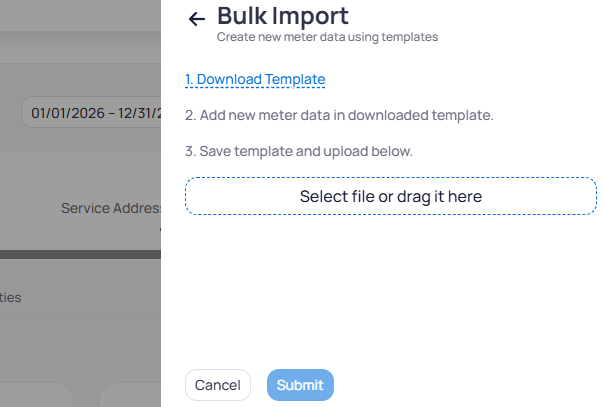
Bulk Import dialog with template download and file upload
Download and complete the template
Upload and submit
Add new billing data
You add billing records when a bill arrives outside the automated feed or when you need to fill a gap.Open the meter detail
Click Add Meter Data
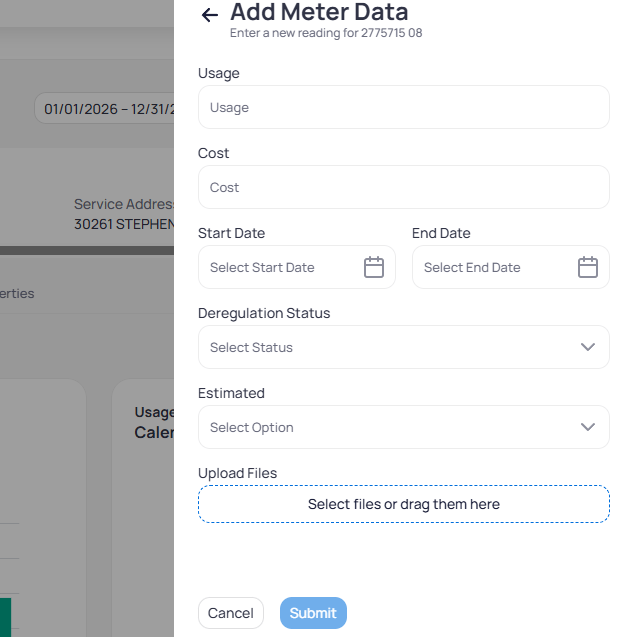
Add Meter Data panel for a single billing period
Enter the reading
Submit the entry
Filter by year
Use theChoose Year dropdown and the calendar icon in the top-right area of the meter detail to filter charts and tables to a specific year. The default view shows the current year.
Include or exclude from metrics
Open meter properties
Edit and toggle inclusion
Save changes
Deactivate a meter
Open meter properties
Edit properties
Set the service end date
Mark inactive
Save and confirm