

Emissions in the left sidebar and select Benchmarking to rank sites by total emissions. For scopes and accounting methods, see Emissions accounting.
Navigate to Benchmarking
ClickEmissions > Benchmarking in the portfolio left sidebar.
Filter the view
Use the filter row to scope the chart and tables.Emissions by Building chart
The Emissions by Building chart ranks sites by total emissions. Stacked bars show and contributions.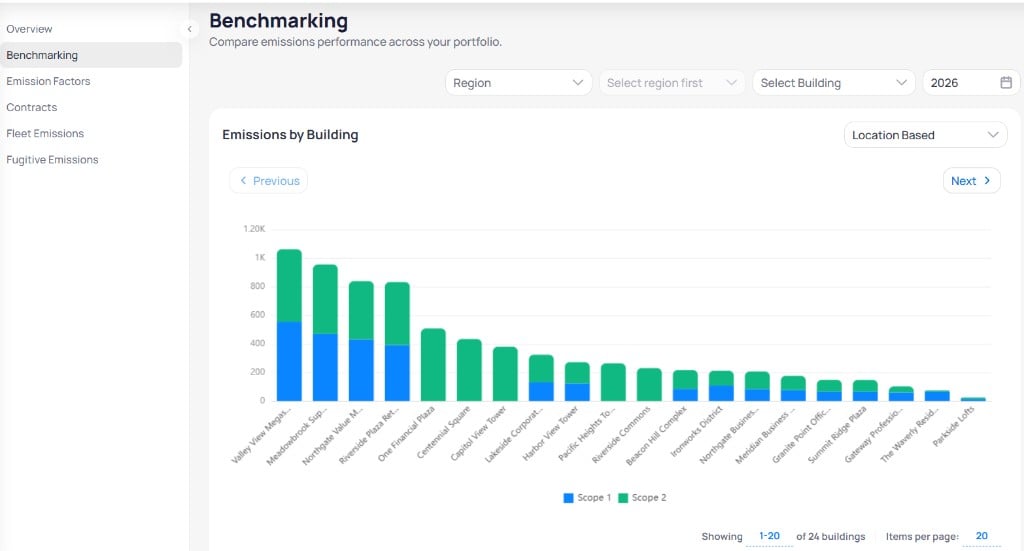
Emissions by Building stacked bar chart with Location Based view
Buildings sort from highest to lowest total emissions on the active page.
Building Emissions table
Below the chart, the Emissions table lists each building with scope and service-type columns. Click a Building name to open that site. Scroll horizontally to view all column groups. Column headers support sorting.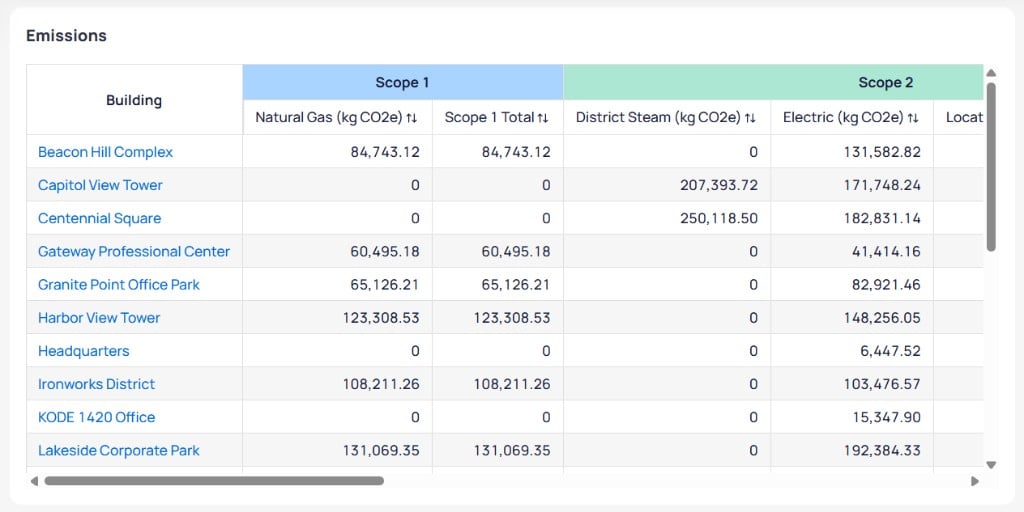
Emissions table with Scope 1 and Scope 2 columns by building
Building Consumptions table
The Consumptions table shows activity data that supports emissions calculations for each building. Its structure matches the emissions table with consumption units (kWh, L) instead of kg CO₂e.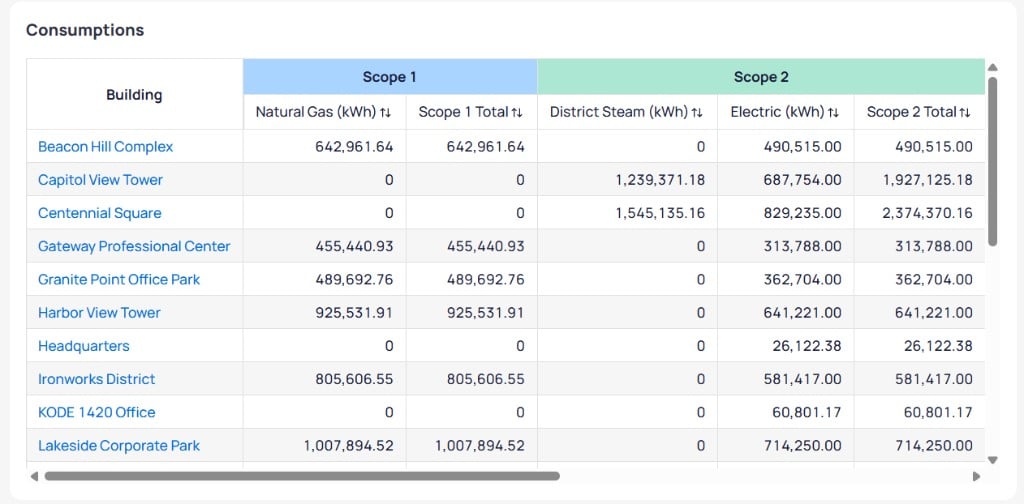
Consumptions table with Scope 1 and Scope 2 totals by building
Next steps
Emissions overview
Review portfolio-wide scope breakdown and offset charts.
Emissions reference
Look up the scope column groups behind these tables.
Volume contracts
Allocate REC and volume-based contract volume to buildings.
Fleet emissions
Manage vehicles and mileage for Scope 1 mobile combustion.
Fugitive emissions
Track refrigerant loss for Scope 1 fugitive reporting.
Report Builder
Export emissions metrics with other portfolio data.