Compare conservation scenarios and review the capital planning roadmap across your portfolio in EnerG
Use Capital Planning in the portfolio view to compare conservation across buildings. The Scenario Comparison page rolls up investment, savings, and long-range projections. You create a comparison by selecting buildings and scenarios, then review the Capital Planning Roadmap chart and detail table.Baseline setup, utility rates, and definitions happen at the building level. After you select a site, open Capital planning in the building view to create measures and scenarios. For the underlying concepts, see Measures, curves, and scenarios.
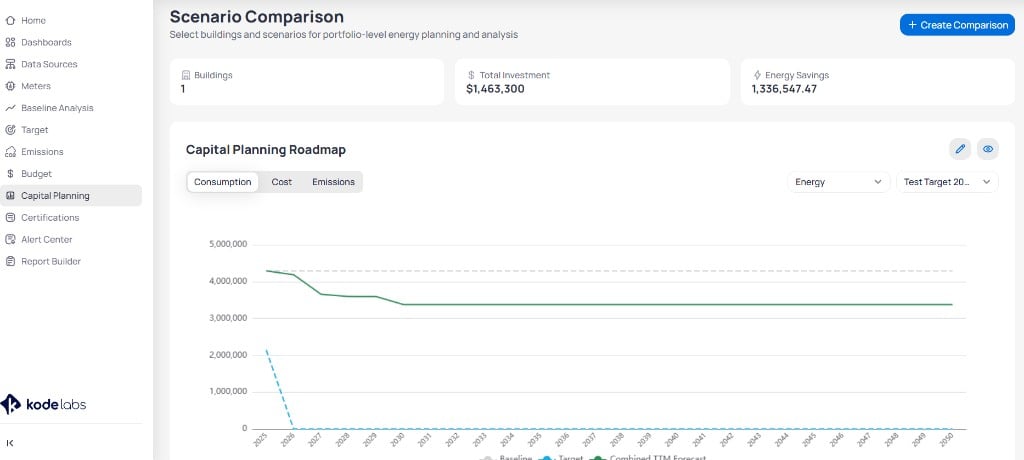
Click Capital Planning in the portfolio left sidebar. The Scenario Comparison page opens with the subtitle Select buildings and scenarios for portfolio-level energy planning and analysis.
Scenario Comparison page with summary cards and the Capital Planning Roadmap chart
Click + Create Comparison in the top-right corner. EnerG walks you through building selection, then scenario selection.
1
Select buildings
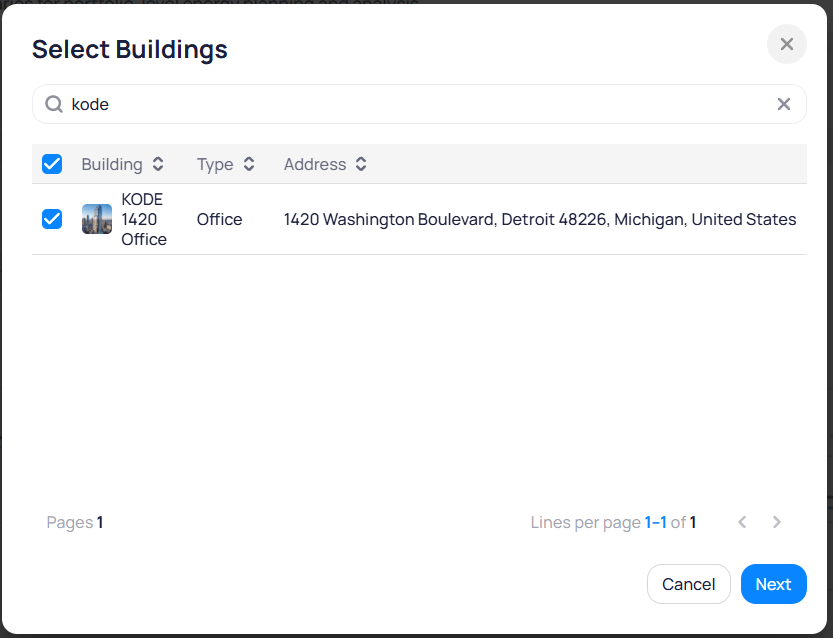
In the Select Buildings dialog, search for sites by name. Check each building you want in the comparison, then click Next.The table lists Building, Type, and Address for each site.
Select Buildings dialog when creating a comparison
2
Choose scenarios
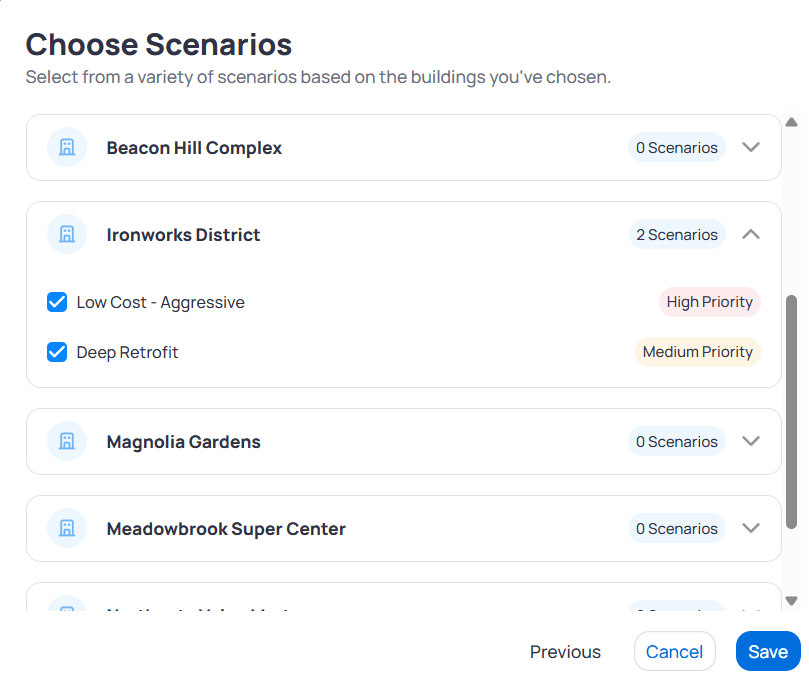
On the Choose Scenarios page, expand each building row and check the scenarios you want to compare. Priority badges such as High Priority or Medium Priority appear next to scenario names when defined. Click Save when your selection is complete.
Choose Scenarios page with building rows and scenario checkboxes
3
Review the comparison
EnerG returns to Scenario Comparison with summary cards, the roadmap chart, and a scenario table for the buildings and scenarios you selected.
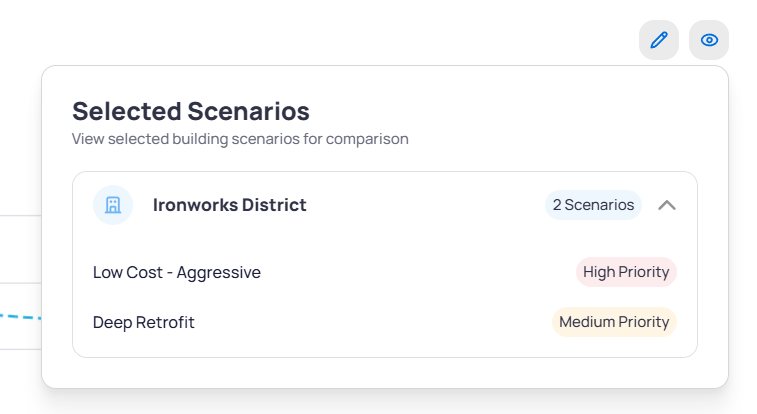
The Selected Scenarios panel lists each building and the scenarios you included. Expand a building row to see scenario names and priority tags. Use the edit and view icons in the panel header to change the selection or adjust visibility.
Selected Scenarios panel showing Ironworks District with two scenarios
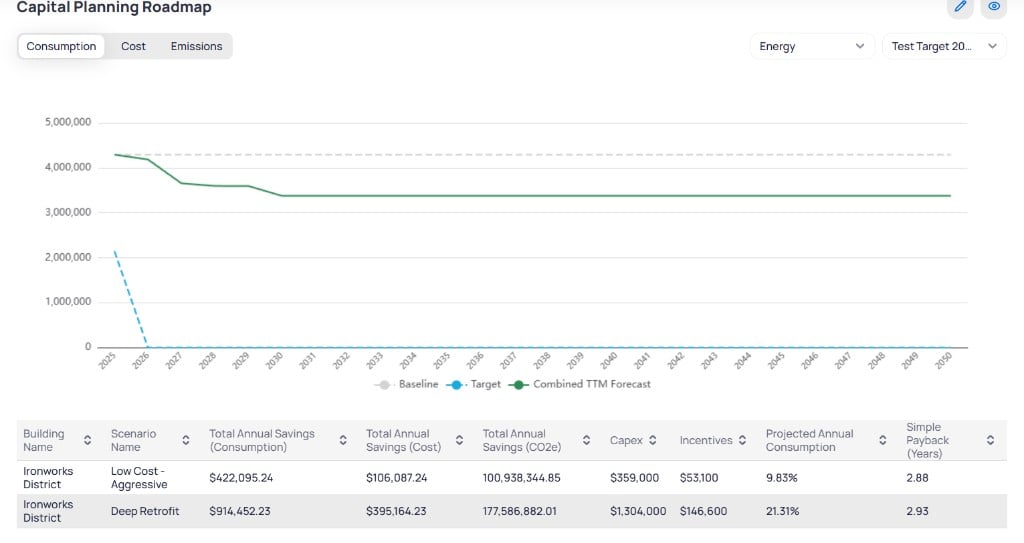
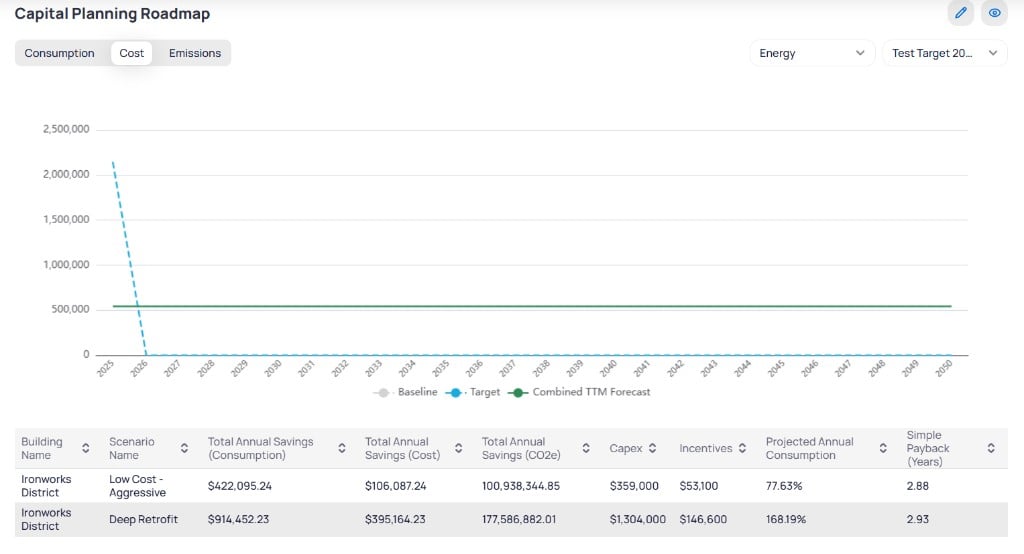
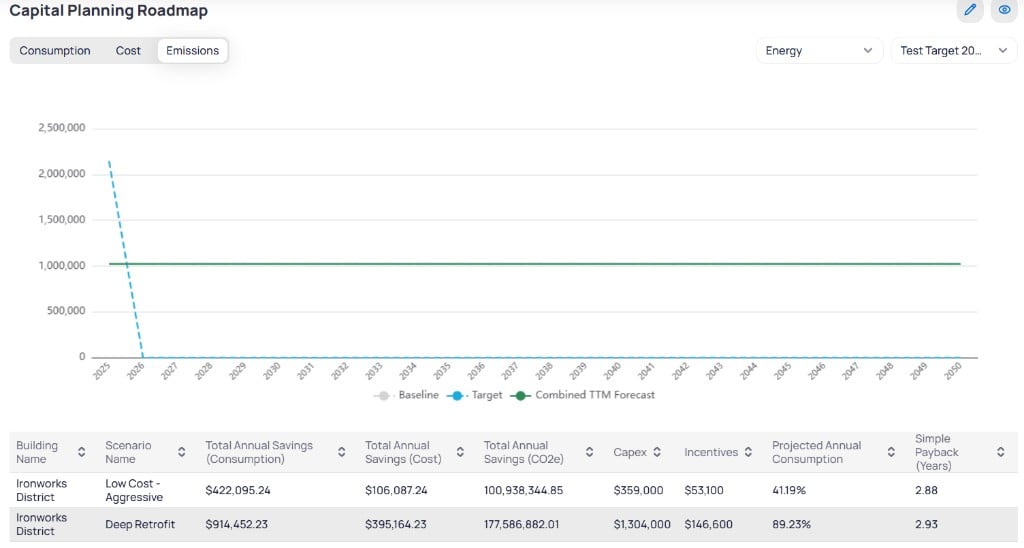
The Capital Planning Roadmap chart projects consumption, cost, or emissions from the current year through 2050. Three series typically appear on the chart.
Series
What it shows
Baseline
Projected values without conservation measures
Target
Portfolio or building reduction target trajectory
Combined TTM Forecast
Combined forecast from selected scenarios and measures
Use the Energy dropdown (and related resource filters when available) to scope the chart. Use the target or scenario selector to pick which comparison or target drives the Target line.
Below the roadmap, a sortable table compares each selected scenario by building. Columns update when you switch Consumption, Cost, or Emissions, but commonly include:
Column
Description
Building Name
Site for the scenario
Scenario Name
Conservation package label (for example, Low Cost - Aggressive or Deep Retrofit)
Total Annual Savings (Consumption)
Projected annual consumption savings
Total Annual Savings (Cost)
Projected annual cost savings
Total Annual Savings (CO2e)
Projected annual emissions savings
Capex
Capital expenditure for the scenario
Incentives
Rebates or incentives applied
Projected Annual Consumption
Share of baseline consumption after measures
Simple Payback (Years)
Years to recover capex from savings
Use the table to rank scenarios by payback, savings, or emissions impact before you present options to stakeholders.