

Emissions in the left sidebar and open Overview to review scope totals, offsets, and renewable contracts. For the accounting model behind these numbers, see Emissions accounting.
At the building level, open Emissions after you select a site. Use the portfolio Emissions group for benchmarking, emission factors, contracts, fleet, and fugitive tools.
Navigate to Emissions Overview
ClickEmissions in the portfolio left sidebar, then select Overview.
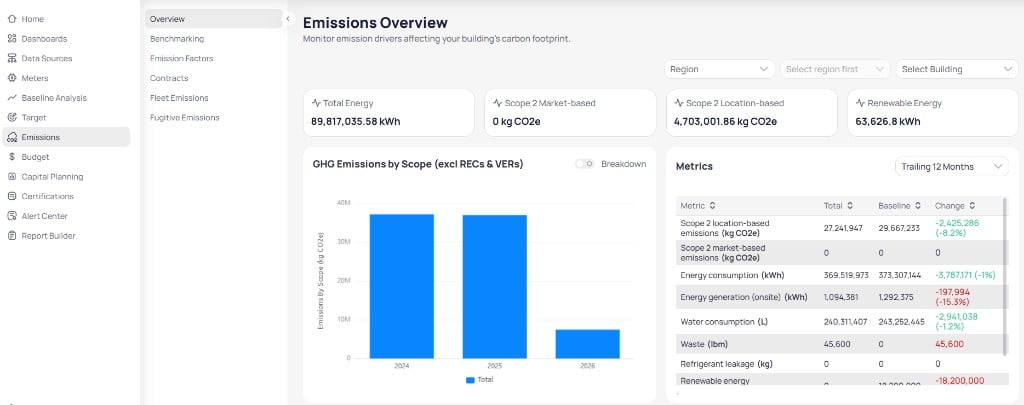
Emissions Overview with summary cards, GHG chart, and metrics table
Filter the portfolio
Use Region and Select Building filters at the top right to narrow charts and tables. Values in summary cards, charts, and scope tables update for the scope you select.Summary cards
Four cards roll up key drivers at the top of the page. The two cards separate the two accounting methods described in location- and market-based Scope 2.GHG emissions by scope
The GHG Emissions by Scope (excl RECs & VERs) chart shows total emissions by year. Turn Breakdown on to split bars by scope when your deployment supports it. The vertical axis measures emissions in kg CO₂e. The horizontal axis lists calendar years in your reporting window.Metrics table
The Metrics table compares totals to a baseline for the period you select in the dropdown (for example, Trailing 12 Months).
Common rows include Scope 2 location-based emissions, Scope 2 market-based emissions, Energy consumption, Energy generation (onsite), Water consumption, Waste, and Renewable energy.
Use the download control to export the full emissions table to an Excel (
.xlsx) file. The export uses the same filters and period active on the page.
Emissions offset and renewable contracts
Below the overview charts, review how offsets and renewable energy contracts affect net emissions.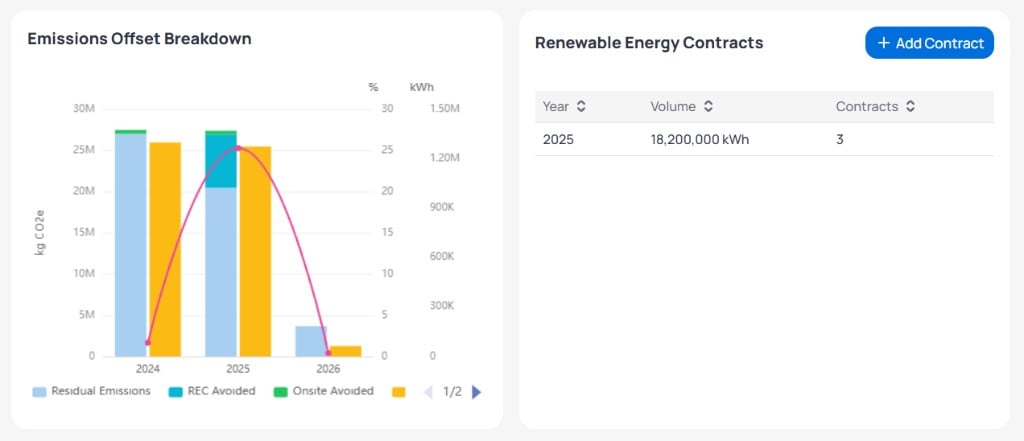
Emissions Offset Breakdown chart and Renewable Energy Contracts table
Emissions offset breakdown
The Emissions Offset Breakdown chart shows residual emissions, REC avoided, and onsite avoided reductions by year. For definitions of these offset categories, see RECs and offsets. Use pagination controls when the chart has more than one view.Renewable energy contracts
The Renewable Energy Contracts table lists contract volume by year.
Click
+ Add Contract to record a new or volume contract. For full contract libraries, volume allocation, and retirement status, open Volume contracts.
Scope breakdown
The Scope Breakdown section includes wide tables for Annual Emissions (kg CO₂e) and Annual Consumptions. Scroll horizontally to view all scope and service-type columns. Column headers support sorting.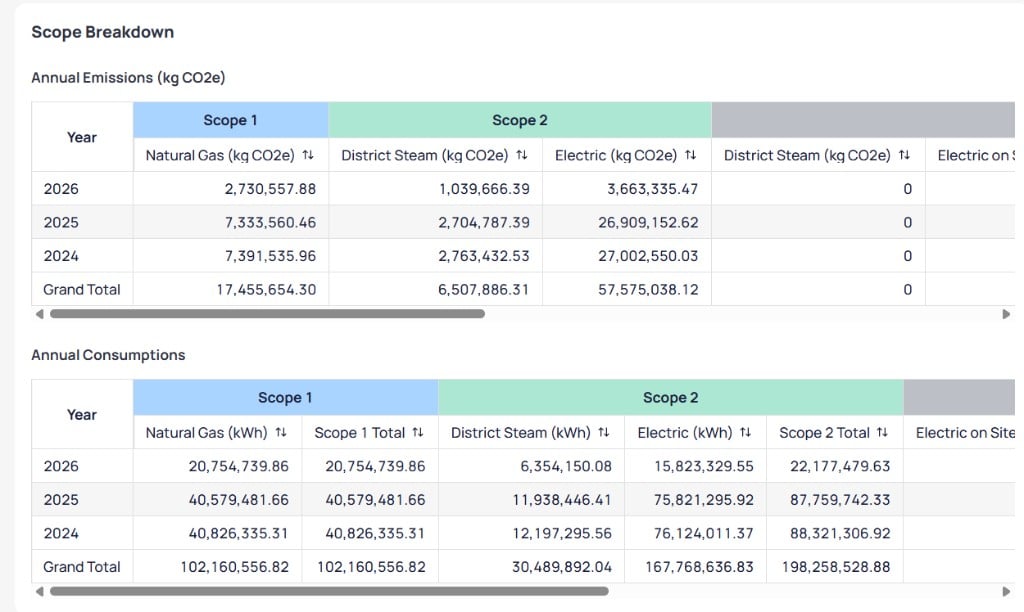
Scope Breakdown with Annual Emissions and Annual Consumptions tables
Next steps
Emissions accounting
Understand scopes, methods, RECs, and factors.
Emissions reference
Look up scope column groups and record fields.
Emissions benchmarking
Compare Scope 1 and Scope 2 emissions by building.
Emission factors
Manage emission factors used in carbon calculations.
Volume contracts
Manage REC and volume-based emission contracts.
Fleet emissions
Manage vehicles and mileage for Scope 1 mobile combustion.
Fugitive emissions
Track refrigerant loss for Scope 1 fugitive reporting.
Report Builder
Build custom report layouts beyond the on-page emissions table export.