

Forecasts rely on interval reads with enough history for the model to learn daily and weekly patterns. Confirm meter completeness on the Meters page before you train.
Open Forecast
1
Select a building
From Portfolio Home, open a building in the building view.
2
Open Energy Modeling
In the left sidebar, expand Energy Modeling, then click Forecast.
Manage configurations
The Forecast page lists every forecast configuration for the building. The page subtitle describes the default horizon: forecast energy usage trends over the coming week. Click + Create Configuration to start the three-step wizard. Use the Actions menu on a row to edit or delete an existing configuration.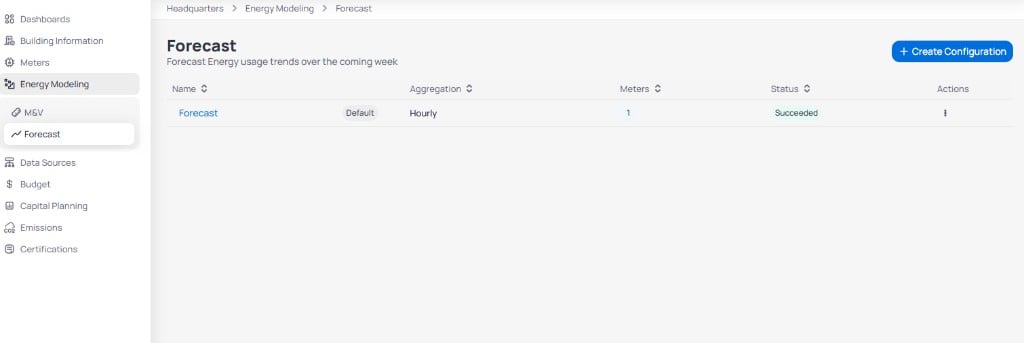
Forecast configurations list with aggregation and status
Create a forecast configuration
Click + Create Configuration to open the wizard. Progress appears in the left sidebar across three steps: Basic Setup, Data Selection, and Summary.Step 1: Basic setup
Define the configuration name and whether it is the default forecast for the building.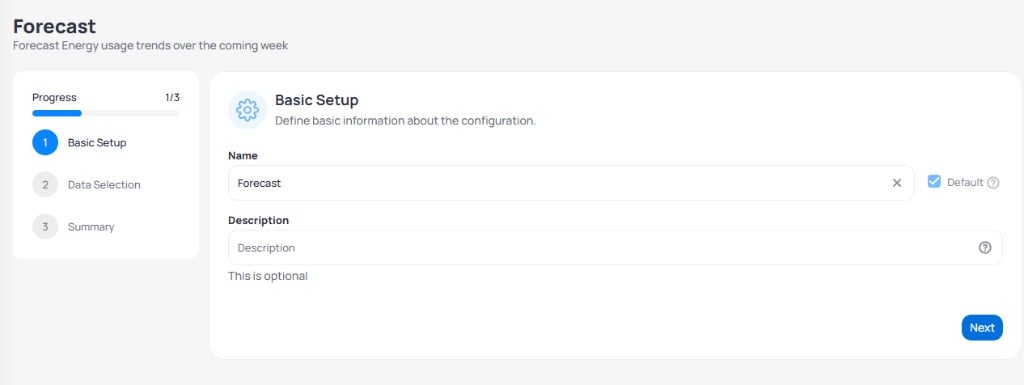
Forecast wizard step 1 Basic Setup
Click Next to continue.
Step 2: Data selection
Choose aggregation, training start date, interval meters, and accuracy thresholds.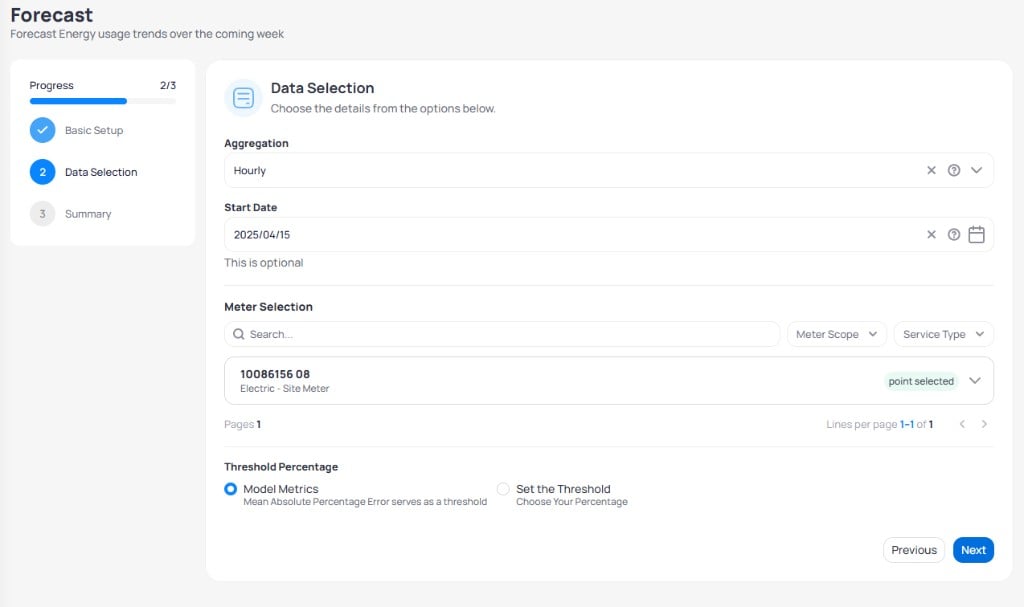
Forecast wizard step 2 Data Selection with meter and point selection
Many teams use Hourly aggregation when they need a week-ahead operational view. Match the point type to the same signal you use in meter comparisons.
Step 3: Summary
Review trained model metrics before you finish.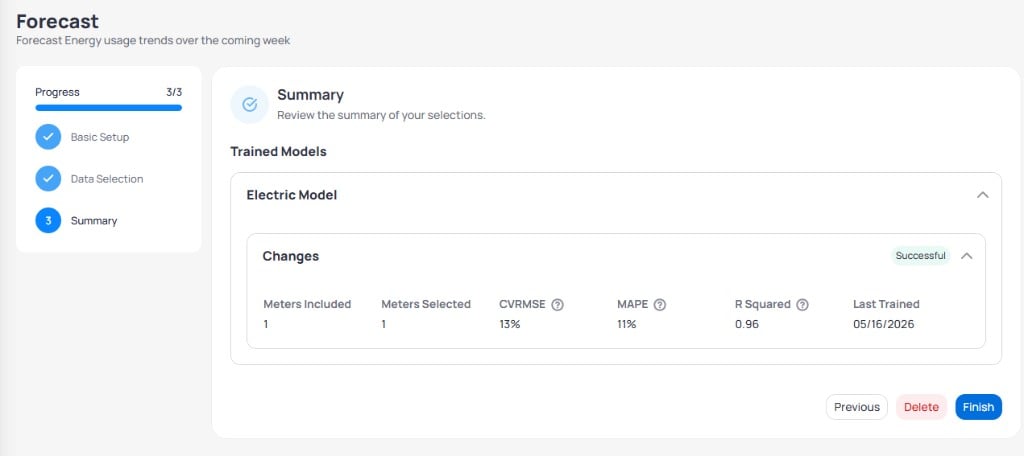
Forecast wizard step 3 Summary with model accuracy metrics
Read forecast results
Open Forecast from the Building Energy dashboard secondary menu to compare projected consumption to actual use for recent and upcoming periods. Charts update after the scheduled sync cycle, similar to M&V analysis results.When to use forecasting
When training fails
Forecast runs can fail when interval history is sparse or correlation is weak. Verify the meter has continuous reads, widen the training window, or change the selected point before you retry.Next steps
Building Energy dashboard
Review forecast charts without leaving the Energy dashboard.
Create an M&V model
Configure baselines and savings models alongside forecasting.
M&V analysis
Interpret savings and accuracy metrics after each model run completes.
Energy modeling overview
See how M&V, forecasting, and IPMVP practices fit together in EnerG.