

Dashboards in the left sidebar, then select Waste.
The page header reads Waste with the subtitle Review your building waste usage & reporting. Unlike Energy and Water, the Waste dashboard uses a single view without a secondary report menu.
Open a building and select Dashboards > Waste for site-level KPIs, charts, and pickup entry on the Building Waste dashboard.
Open the Waste dashboard
1
Open Dashboards
In the portfolio left sidebar, click
Dashboards, then click Waste.2
Set scope and units
Use Select Buildings to limit which properties appear. Choose a unit such as Pounds from the unit dropdown. Set the date range for the reporting window.
3
Read summary KPIs
Scan the metric cards for total waste, diversion, capture rate, and cost before you review charts below.
Controls
- Add Waste Data — enter or import waste readings when your workflow supports portfolio-level entry
- Select Buildings — filter the dashboard to specific properties
- Unit — display quantities in pounds, kilograms, or other supported units
- Date range — define the period for KPIs and charts, such as 01/01/2026 – 05/22/2026
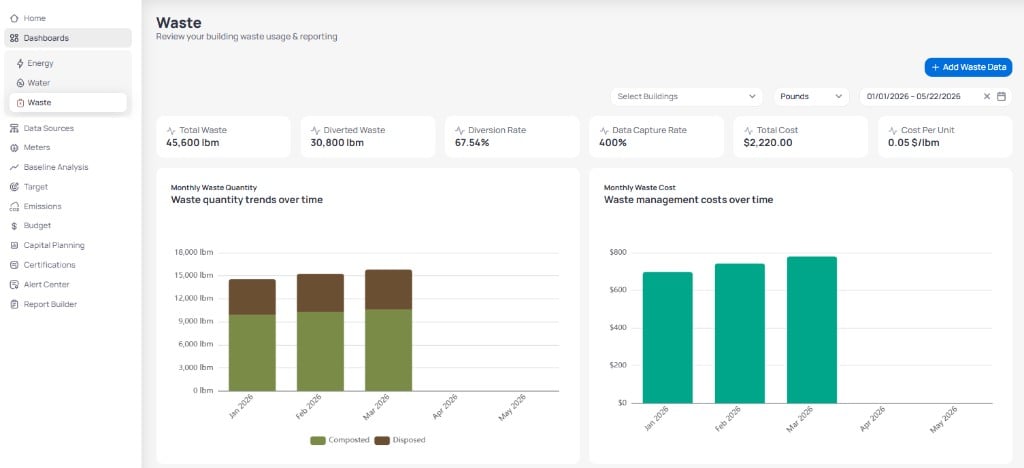
Portfolio Waste dashboard with KPI cards and monthly quantity and cost charts
Summary metrics
Six KPI cards appear below the header.Monthly waste charts
Monthly Waste Quantity
The Monthly Waste Quantity chart stacks waste by disposal method each month.- Composted — material sent to composting (typically shown in green)
- Disposed — material sent to landfill or disposal (typically shown in brown)
Monthly Waste Cost
The Monthly Waste Cost chart shows total waste management spend by month. Compare it with quantity trends to spot cost-per-unit changes.Diversion and composition
Scroll below the monthly charts for portfolio breakdowns.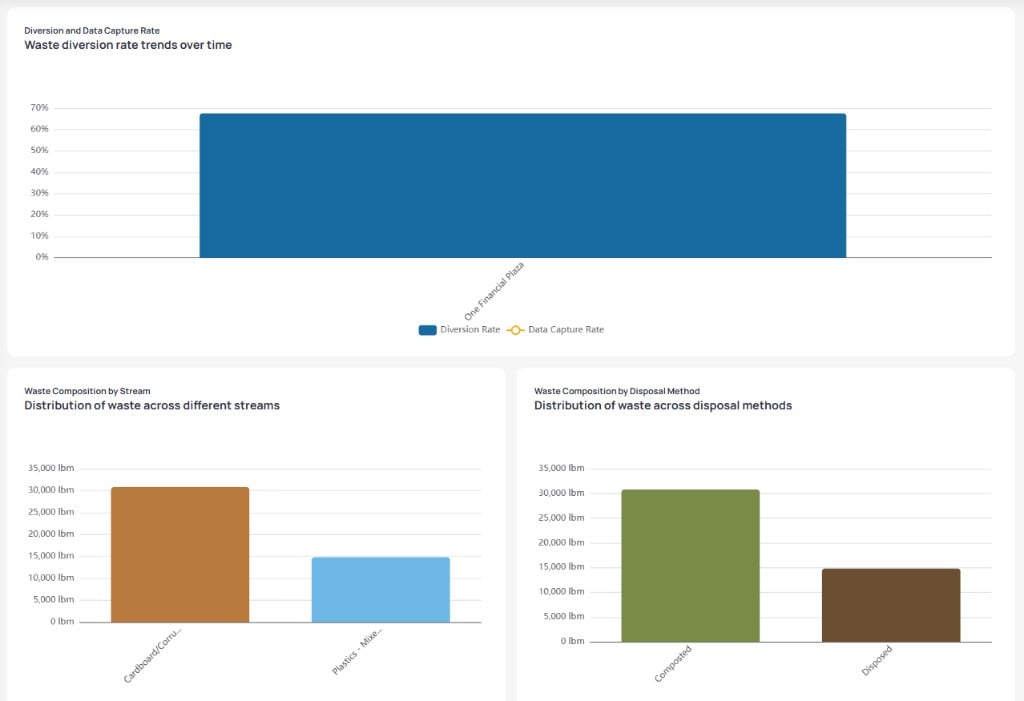
Diversion rate and waste composition by stream and disposal method
Diversion and Data Capture Rate
Compare Diversion Rate bars (and Data Capture Rate when shown) across buildings or portfolio totals.Waste Composition by Stream
See how much waste falls into each material stream, such as cardboard or mixed plastics.Waste Composition by Disposal Method
See how volume splits between Composted, Disposed, and other configured methods.Top buildings
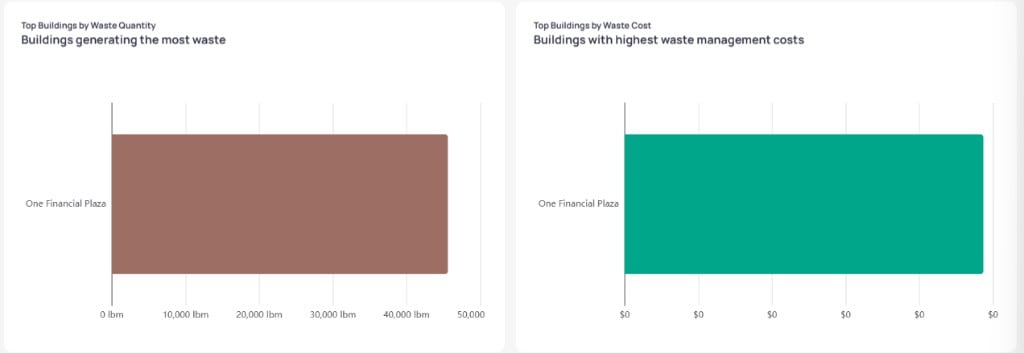
Top Buildings by Waste Quantity and Top Buildings by Waste Cost
- Top Buildings by Waste Quantity — properties generating the most waste
- Top Buildings by Waste Cost — properties with the highest waste management costs
Waste data often depends on manual entry at the building level. Confirm waste streams are configured on the Building Waste dashboard for sites you include in portfolio totals.
Add waste data at portfolio level
Click Add Waste Data when you need to record pickups or adjustments that apply to the selected building scope. For stream setup, use Create Meter on the Building Waste dashboard.Next steps
Portfolio Energy dashboard
Review energy usage and emissions for the same portfolio scope.
Portfolio Water dashboard
Review water consumption alongside waste reporting cycles.
Building Waste dashboard
Review building-level KPIs and composition charts.
Create waste streams
Configure waste streams and data entry at the building level.
Portfolio Home
Return to portfolio rankings and building detail panels from Home.