

Budget in the left sidebar to open Portfolio Budget Overview and Portfolio Budget Planning. Overview compares actual spend, , and by building. Planning shows monthly budget plans by service type in consumption, cost, or carbon.
To configure budget models for one site, open the building view and use Model configuration under Budget. For building-level budget creation, use Budget planning. For how predicted, actual, and variance relate, see Budgets and capital planning.
Navigate to portfolio budgets
ClickBudget in the portfolio left sidebar. Switch between Overview and Planning from the breadcrumb or tabs at the top of the page.
Portfolio Budget Overview
Portfolio Budget Overview tracks portfolio energy spend and compares performance against budget for the sites and period you select.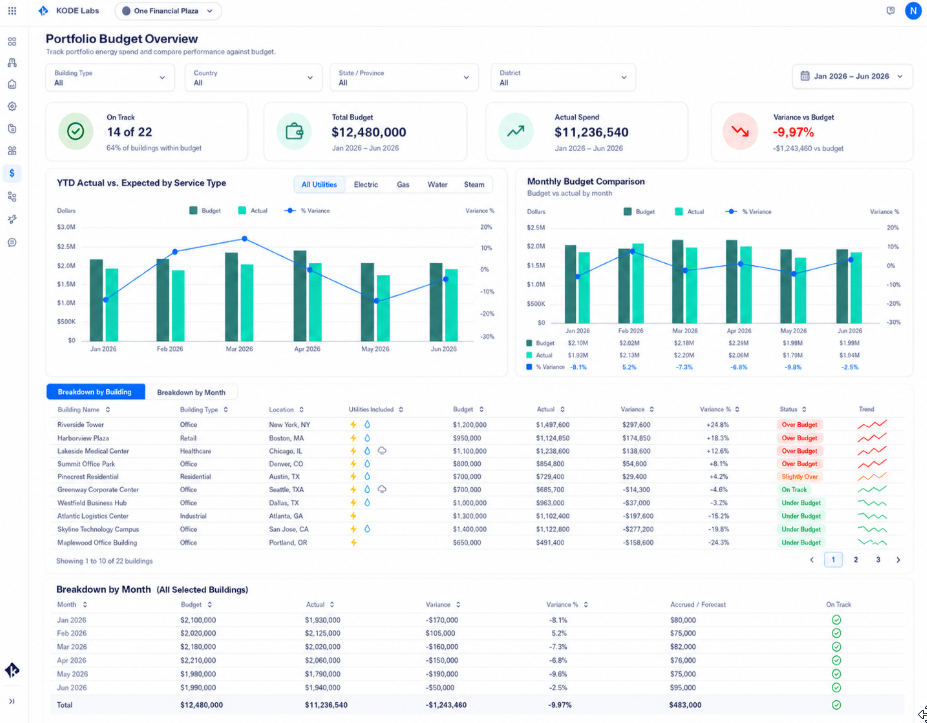
Portfolio Budget Overview with KPI cards, budget vs actual charts, and building breakdown
Summary KPI cards
Four cards roll up portfolio totals for the active filters and date range.Page controls
Use the filter bar and date range to align the view with your reporting scope.Charts
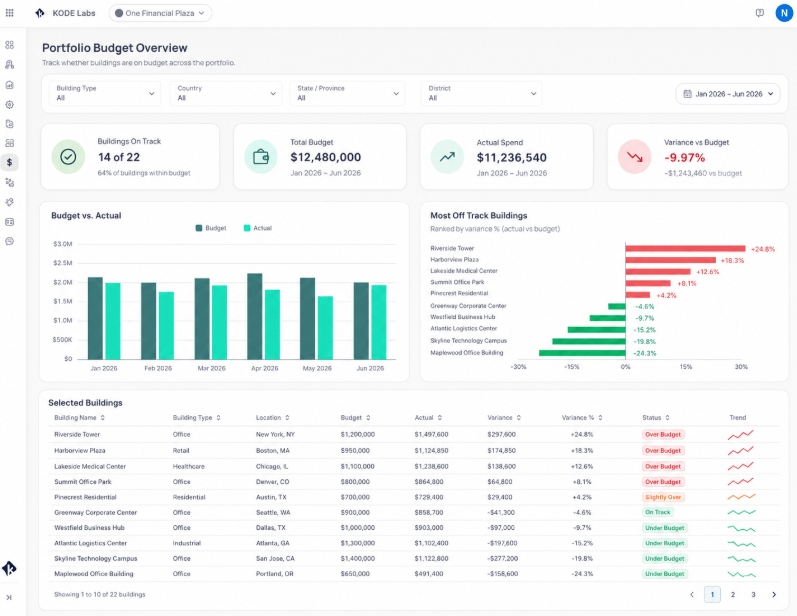
Portfolio Budget Overview highlighting buildings most off track
Building comparison table
Each row summarizes one building. Use status labels such as Over Budget, Slightly Over, On Track, and Under Budget with trend charts to prioritize follow-up.Export budget data
Use the download action on Overview or Planning to export budget data for the active filters. One export can include all service types so you do not download and merge separate files per fuel. Export accruals at meter level when you need actual versus budget with accrual values for review.Portfolio Budget Planning
Portfolio Budget Planning shows monthly budget plans for a single Service Type and year across the portfolio. ChooseElectric, Natural Gas, District Steam, or Fuel Oil No 4 from the Service Type dropdown. Units and summary cards update for the commodity you select.
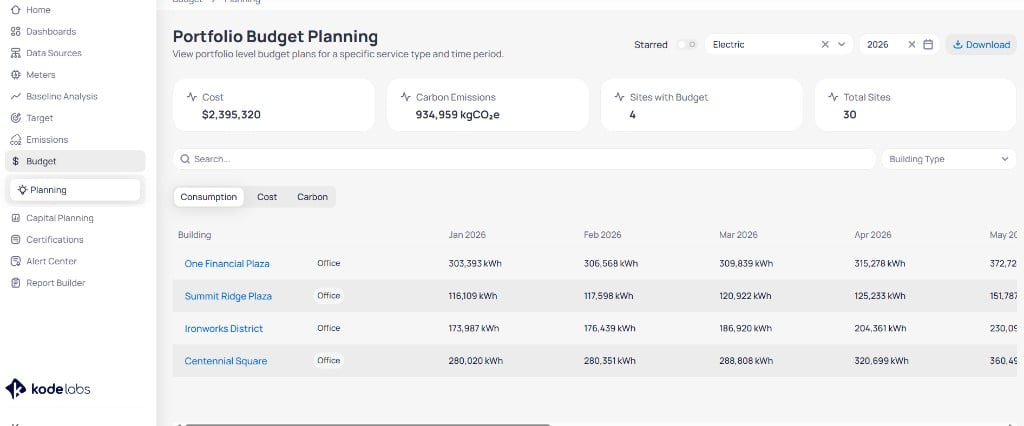
Portfolio Budget Planning with summary cards and a monthly consumption table
Summary cards
Four cards summarize the selected service type and year.Page controls
Use Search and Building Type above the table to narrow the building list.
Switch Consumption, Cost, or Carbon
Three toggles change how monthly values display in the table.
Consumption, Cost, and Carbon view toggles on Portfolio Budget Planning
Click a Building name in the table to open building-level budget detail for that site.
Download the budget report
ClickDownload on Portfolio Budget Planning to export the current view. EnerG generates an Excel workbook (.xlsx) that matches your active Service Type, Year, and table filters. The file includes both tabular data and chart-ready series you can use in Excel or Power BI.
Download the example portfolio budget export for 2026 (Electric) to review workbook layout, summary tabs, and chart data sheets before you export from your workspace.
1
Set filters on Planning
Choose Service Type, Year, and any building filters you need. Switch Consumption, Cost, or Carbon if you want the on-screen view aligned with what you export.
2
Click Download
Click
Download in the top-right corner. Save the file when your browser prompts you.3
Open the workbook
Start on Table of Contents. It lists every sheet, the date range, service type, and when EnerG generated the export.
Workbook sheets
The main Budget portfolio sheet holds the detailed grid you see in the product: one row per building and paired columns per month for consumption, unit, cost, and emissions where applicable.
The _bp_chart and _bb_chart sheets supply the underlying series for charts in the workbook. Use them when you rebuild visuals in Excel or connect the export to another reporting tool without re-aggregating the main table.
Sheet names and row counts depend on how many buildings and months match your filters. A portfolio export for one service type and calendar year typically includes a summary block, a multi-month building table, and separate chart data tabs.
Accruals
On Overview, turn Accruals on to include accrued amounts in Actual, Variance, and Projected columns. For how EnerG builds and trues up accruals, see Accruals and the accrual behavior reference.Accrual behavior may vary by deployment. Confirm labels and calculations in your workspace before you publish variance reports.
Next steps
Building budget overview
Review actual, variance, and charts for one building.
Model configuration
Configure monthly budget values for one building.
Budget planning
Create and activate building budgets with the six-step wizard.
Report Builder
Export budget and actual metrics for reporting cycles.
Portfolio Energy dashboard
Compare usage and cost trends with budget performance.