

Configure and train models at the building level to verify energy savings. In the building view, expand Energy Modeling in the left sidebar and open M&V. A trained model estimates the and feeds savings calculations in KODE OS and the Building Energy dashboard. For the methods behind M&V, see Energy modeling and M&V.
You typically need about 12 months of historical data in the baseline window so weather and seasonal patterns train reliably.
Open M&V
1
Select a building
From Portfolio Home, open a building in the building view.
2
Open Energy Modeling
In the left sidebar, expand Energy Modeling, then click M&V.
Manage configurations
The M&V page lists every configuration for the building. Click + Create Configuration to start the five-step wizard. Use the Actions menu on a row to edit or delete an existing configuration.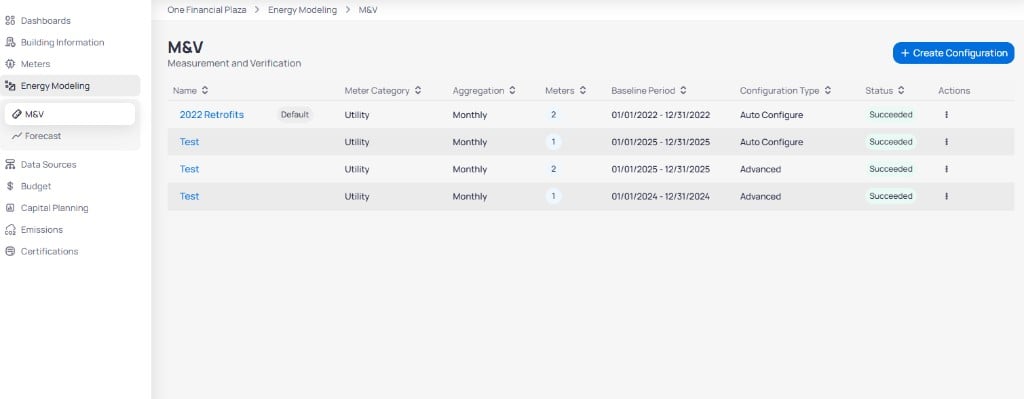
M&V configurations list with baseline period and status
Create an M&V configuration
Click + Create Configuration to open the wizard. Progress appears in the left sidebar across five steps: Basic Setup, Data Selection, Baseline Setup, Model Configuration, and Summary.Step 1: Basic setup
Define the configuration name, optional description, and measure dates that mark when savings counting begins.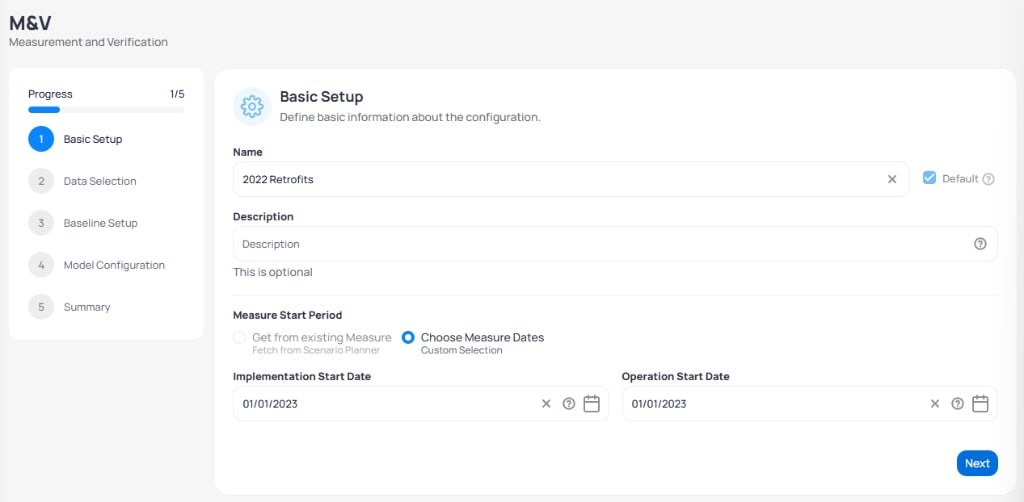
M&V wizard step 1 Basic Setup with measure dates
Click Next to continue.
Step 2: Data selection
Choose meter category, aggregation, and the meters that feed the model.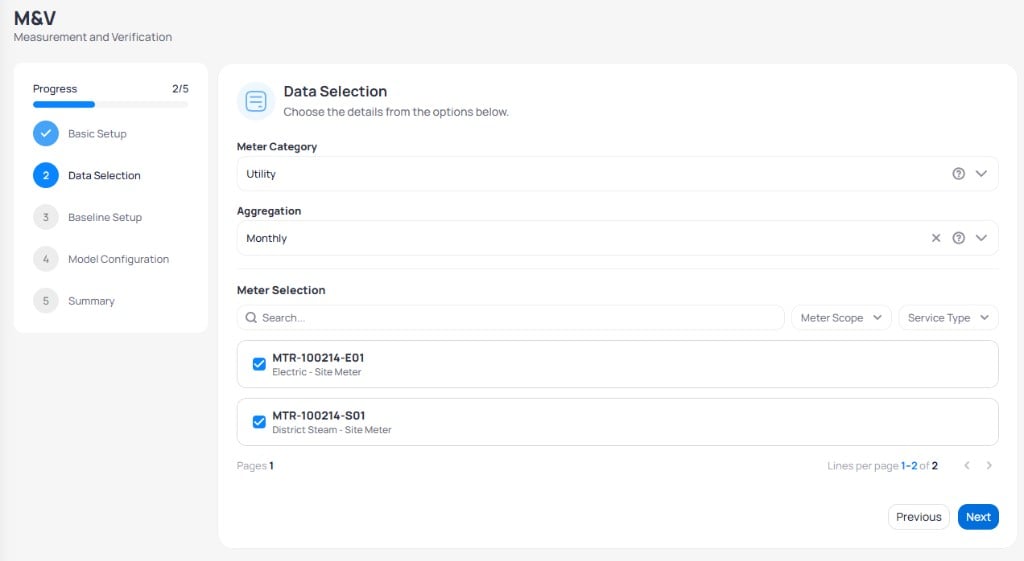
M&V wizard step 2 Data Selection with meter checklist
EnerG trains a separate model per service type when you include multiple commodities, such as Electric and District Steam.
Step 3: Baseline setup
Select the historical period used to train the baseline and set degree-day base temperatures.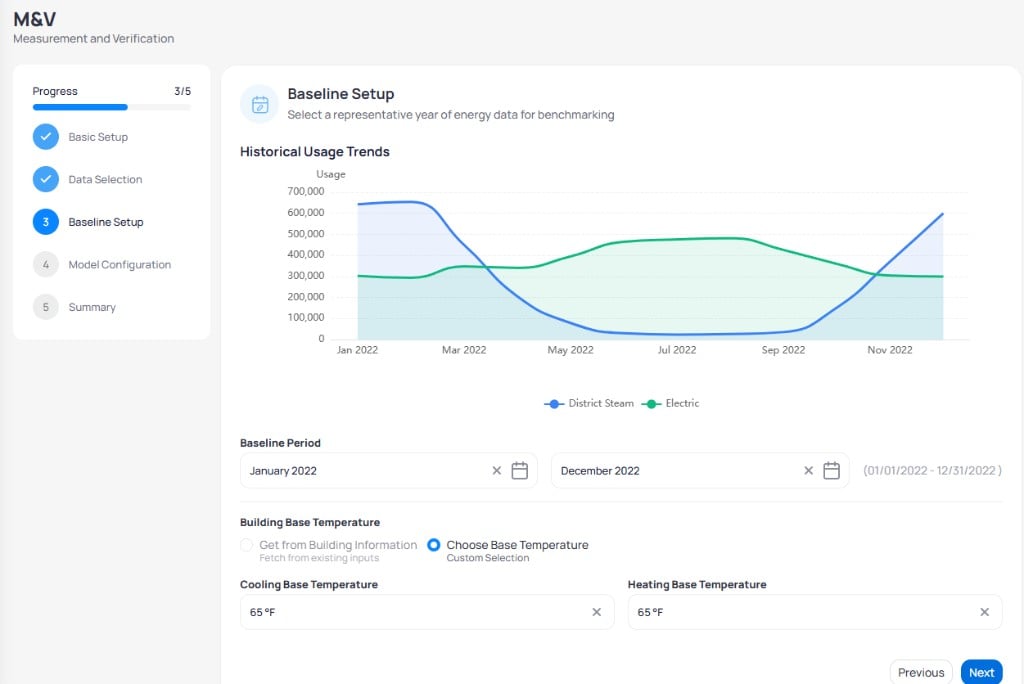
M&V wizard step 3 Baseline Setup with usage trends chart
Confirm the chart shows a full seasonal cycle before you click Next.
Step 4: Model configuration
Pick how EnerG trains the regression models and whether to project the baseline forward.Auto-configure
Auto-Configure trains and selects the optimal model for each service type without manual variable selection.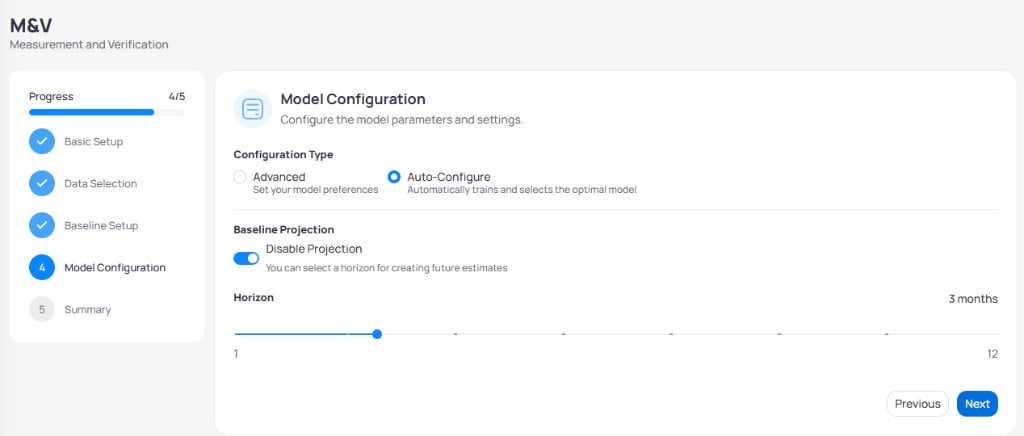
M&V wizard step 4 Model Configuration with Auto-Configure and projection horizon
Advanced
Advanced exposes drivers, model type, and accuracy thresholds. Use the scatter plot to confirm relationships before you submit.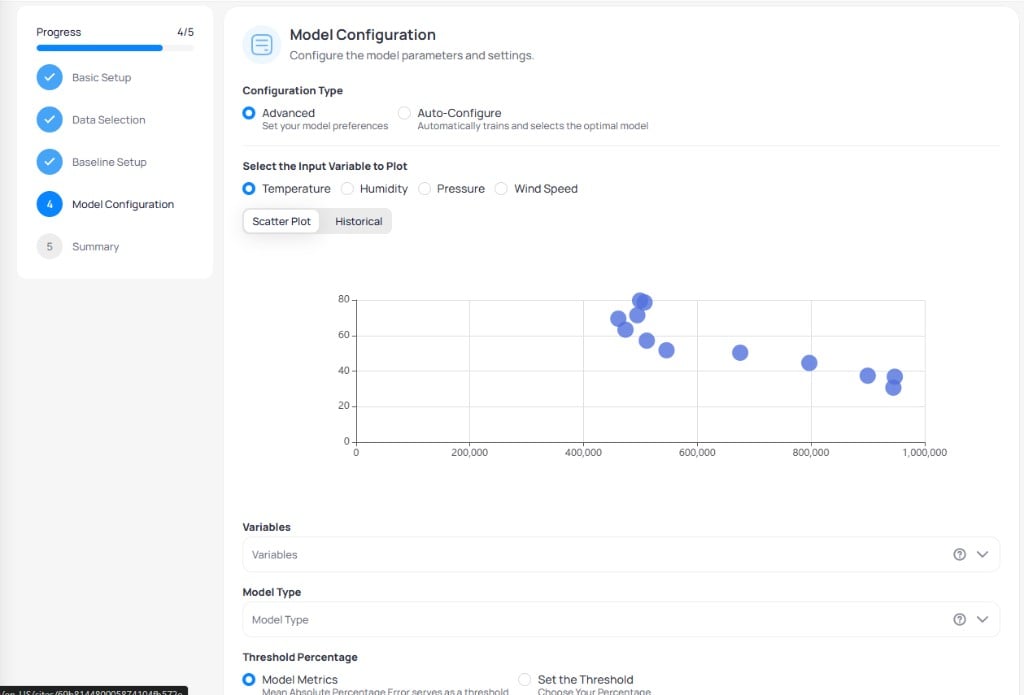
M&V wizard step 4 Model Configuration Advanced mode with scatter plot
Step 5: Summary
Review selections and trained model status before you finish.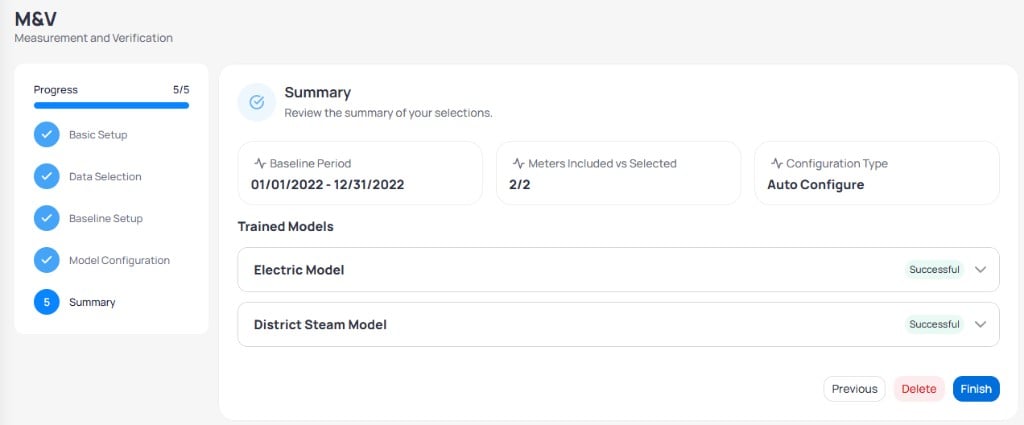
M&V wizard step 5 Summary with trained models
Click Finish to save the configuration. Results sync to dashboards after the scheduled job runs. See M&V analysis to read savings totals, charts, and accuracy metrics.
When models fail
Models can fail when correlation is too weak or the fit falls below your accuracy threshold. Interval training may also reject configurations that do not meet quality rules. See Model accuracy thresholds for the metrics EnerG checks.Next steps
M&V analysis
Interpret savings, charts, and accuracy metrics after the hourly job finishes.
Building Energy dashboard
Review M&V savings and consumption charts without leaving the Energy dashboard.
Energy modeling overview
See how IPMVP options, meter types, and forecasting fit together in EnerG.
Forecasting
Configure horizons and read projected consumption alongside actual use.