

Capital Planning menu
After you open Capital Planning, a secondary menu lists the workflow pages.
Complete Basic Information before you open Measure Creation, Scenario Planner, Scenario Analysis, or Comparison.
Open Basic Information
1
Select a building
From Portfolio Home, open a building in the building view.
2
Open Capital Planning
Click Capital Planning in the left sidebar, then select Basic Information in the Capital Planning menu.

Capital Planning Basic Information with building and baseline settings
Building and target settings
The Building & Target Settings card summarizes inputs EnerG pulls from the building record.
Click Go to Building Info to update area, systems, or service types on Building information.
Define baseline period
Set the historical window that measures and scenarios use as the reference for savings.
Pick a period with stable operations and reliable meter coverage. A full calendar year is typical so seasonal patterns appear in charts.
Visualize baseline usage
Scroll below the baseline settings for a multi-series chart and configuration table.
Baseline usage chart with weather overlay and factors table
Use the chart to confirm heating or cooling peaks match expectations before you assign savings curves on Measure Creation.
Factors and calculations configuration
The Factors & Calculations Configuration table sets rates and degree-day base temperatures per utility type. See Weather normalization for degree-day settings.Confirm Utility Rate matches the tariff class or blended average you use in audit narratives and Budget planning rate analysis.
Measure Creation
Select Measure Creation in the Capital Planning menu to add conservation measures and manage distribution curves for the building.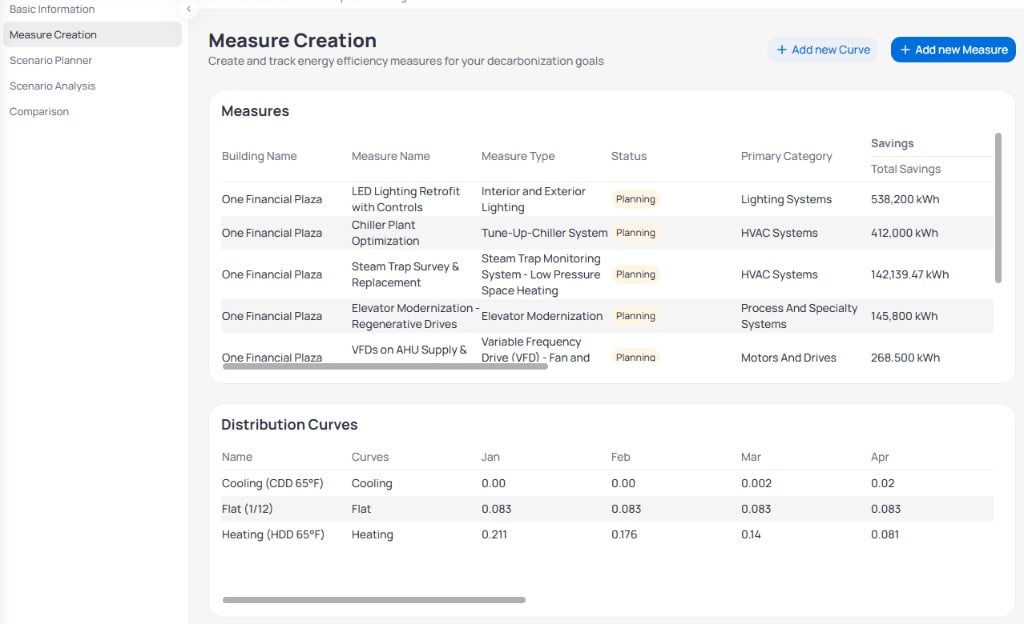
Measure Creation page with Measures table and Distribution Curves
Add a new measure
Click + Add new Measure to open the Add New Measure panel.
Add New Measure panel with category, curve, and savings fields
Click Save to add the row. EnerG calculates payback and fuel-specific savings columns after you save. Additional fields may appear when you select multiple service types.
Create a custom curve
Click + Add new Curve to open the Create Custom Curve panel when default cooling, heating, or flat curves do not fit your measure.
Create Custom Curve panel with monthly factors
Click Create Curve when the sum reaches 1.000. The new curve appears in the Curve dropdown on Add New Measure.
Measures table
The Measures table lists every conservation project for the building. Scroll horizontally to see financial and fuel-specific columns.
When a measure reaches Operations, EnerG can connect it to M&V models. Keep the measure record aligned with the meters and models that prove savings.
Distribution curves
The Distribution Curves table defines how annual savings spread across months. EnerG provides default cooling, heating, and flat curves derived from degree-day logic on Basic Information.
Assign a curve when you create or edit a measure so EnerG allocates savings without manual spreadsheet work. For when to use each curve type, see Distribution curves.
Scenario Planner
Select Scenario Planner in the Capital Planning menu to bundle measures into funding packages. Each scenario lists included measures with implementation and operation dates.
Scenario Planner with expandable scenario cards
Scenario cards
Each card shows the scenario name, a priority tag, and a table of measures when expanded.Implementation date marks construction or install start. Operation date marks when savings first count in forecasts and analysis.
Create a scenario
Click + Add new Scenario to open the Create Scenario panel.
Create Scenario panel with measure selection
Click Create Scenario, then open Edit Scenario on the card to set Implementation Date and Operation Date per measure when projects phase over time.
Review savings and payback on Scenario Analysis. Compare bundles on Comparison or at the portfolio on Portfolio capital planning.
Scenario Analysis
Select Scenario Analysis in the Capital Planning menu to review financial and environmental impacts for a scenario you built on Scenario Planner.
Scenario Analysis with KPI cards and Target chart
Page controls
Summary metrics
Five cards roll up results for the active scenario and view.Target chart
The Target chart compares long-range trajectories through 2040.
Use the goal dropdown, such as 2040 Reduction Goal, to align the chart with targets you set on Portfolio targets and review on the Building Energy dashboard.
Baseline vs. projected and measures timeline
Scroll below the Target chart for service-type breakdowns and a measure schedule.
Scenario Analysis Baseline vs Projected chart Reduction table and Measures Timeline
Scenario Analysis shows trailing-twelve-month Forecast TTM and baseline separation for one scenario. Use it when you explain how savings emerge across seasons before you compare bundles on Comparison.
When you stagger implementation dates
When you stagger implementation dates
Set each measure Implementation Date when work begins and Operation Date when savings start. Staggered dates keep cash flows and contractor access realistic in one scenario.
Scenario Comparison
Select Comparison in the Capital Planning menu to evaluate multiple scenarios side by side on one chart and table.
Scenario Comparison with Capital Planning Roadmap and comparison table
Page controls
Capital Planning Roadmap
The Capital Planning Roadmap chart projects each selected scenario from the current year through 2040.
Steeper drops indicate larger or earlier savings. Compare scenario lines to Target to see which bundle closes the gap soonest.
Comparison table
The table below the chart summarizes each scenario for the active toggle.
Use the table to compare Simple Payback and Capex when you shortlist funding options. Open Scenario Analysis for a single-scenario drill-down.
For portfolio-wide comparison across buildings, use Portfolio capital planning.
Next steps
Portfolio capital planning
Compare scenarios across buildings on the roadmap chart.
Budget planning
Add capital projects from planning into an annual budget in step 4.
Building information
Update area, heating, cooling, and service types before you lock a baseline.