

Open Emissions Overview
1
Select a building
From Portfolio Home, open a building in the building view.
2
Open Emissions
Click Emissions in the left sidebar.
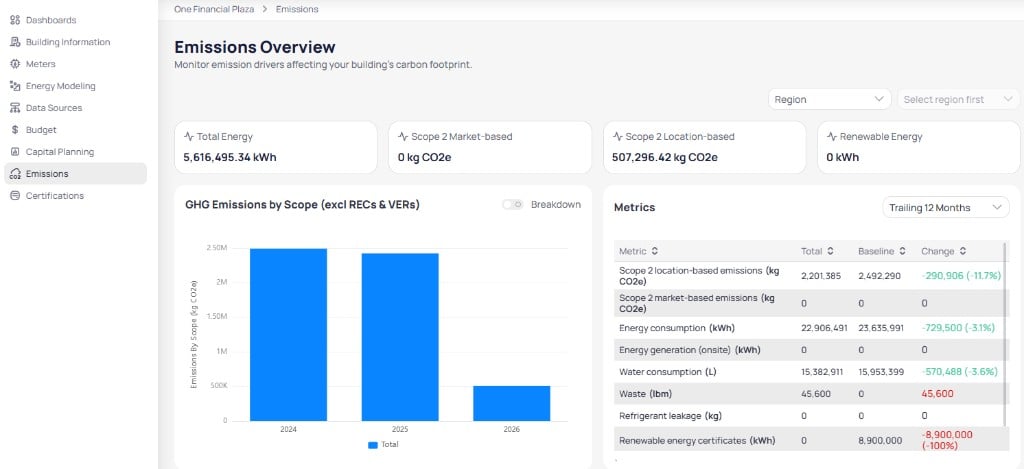
Building Emissions Overview with summary cards and metrics table
Filter by region
Use Region and the dependent region selector at the top right when your building spans multiple reporting regions. Summary cards, charts, and tables update for the scope you select.Summary cards
Four cards roll up key drivers for the building. The two cards separate the methods described in location- and market-based Scope 2.GHG emissions by scope
The GHG Emissions by Scope (excl RECs & VERs) chart shows total emissions by year. Turn Breakdown on to split bars by scope when your deployment supports it. The vertical axis measures kg CO₂e. Compare year-over-year totals before you drill into the metrics table.Metrics table
The Metrics table compares totals to a baseline for the period in the dropdown, such as Trailing 12 Months.
Common rows include Scope 2 location-based emissions, Scope 2 market-based emissions, Energy consumption, Water consumption, Waste, and Renewable energy certificates.
Use the download control to export the full emissions table to an Excel (
.xlsx) file. The export uses the same filters and period active on the page.
Emissions offset and renewable contracts
Scroll below the overview charts for offset visualization and contract management.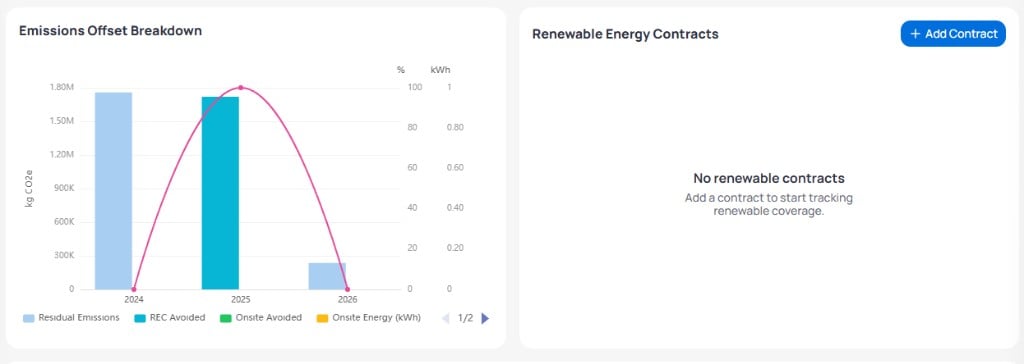
Emissions Offset Breakdown and Renewable Energy Contracts empty state
Scope breakdown
The Scope Breakdown section includes Annual Emissions (kg CO₂e), Annual Consumptions, and Annual Factors tables. Scroll horizontally to view all columns.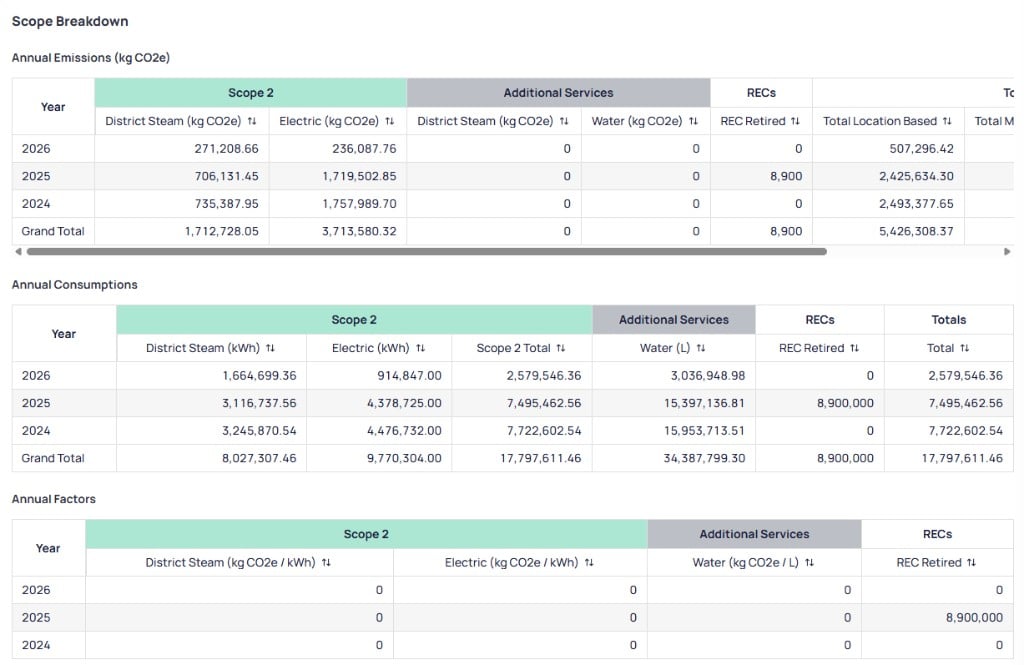
Scope Breakdown Annual Emissions and Annual Consumptions tables
Next steps
Emissions accounting
Understand scopes, methods, RECs, and factors.
Emissions reference
Look up scope column groups and record fields.
Emissions benchmarking
Compare Scope 1 and Scope 2 emissions across buildings.
Volume contracts
Create, allocate, and retire REC volume.
Building Energy dashboard
Toggle Emissions on monthly reports alongside usage and cost.