

Navigate to Baseline Overview
In the portfolio view, expandBaseline analysis in the left sidebar and select Overview.
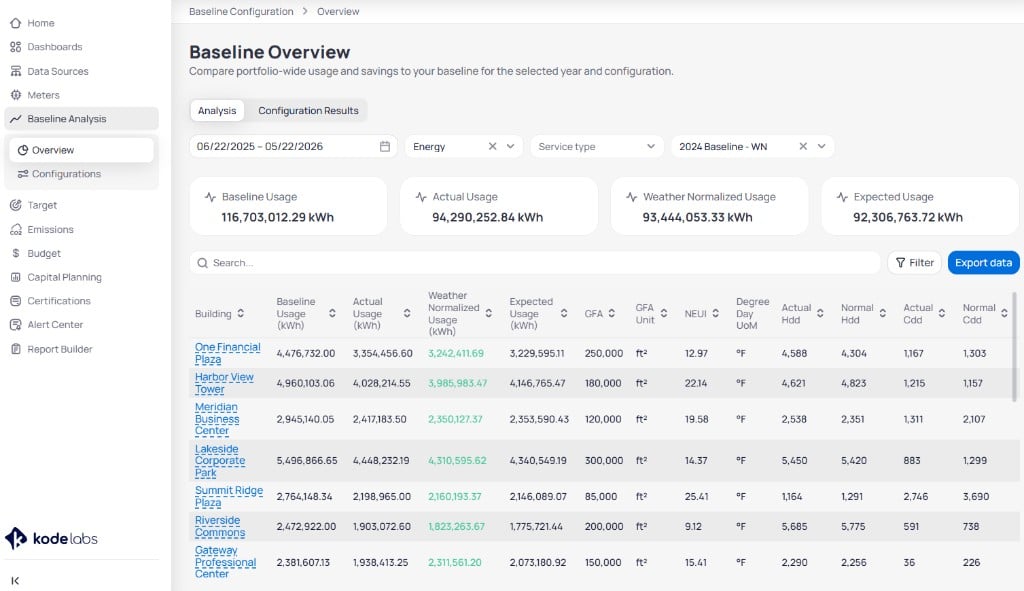
Baseline Overview Analysis tab with summary cards and building comparison table
Choose filters
Use the filter row to scope the comparison.
When Resource type is
Energy, Service type lists commodities such as District Steam, Electric, Electric on Site Solar, Lighting, Natural Gas, and Steam. Options change when you switch to Water or Waste.
Analysis tab
The Analysis tab summarizes portfolio totals and lists each building in a sortable table.Summary cards
Four cards roll up usage for the selected filters: Baseline Usage, Actual Usage, Weather Normalized Usage, and Expected Usage. For what each figure means, see how normalized comparisons read.Building comparison table
The table lists one row per building. Click a Building name to open Building information for that site. Columns cover the four usage figures, gross floor area (GFA), normalized energy use intensity (NEUI), and actual versus normal heating and cooling .
Use Search and Filter above the table to narrow the list. Click Export data to download the current view.

Search and geographic filters above the building table
Configuration Results tab
Switch to Configuration Results to review model training status and regression detail by building.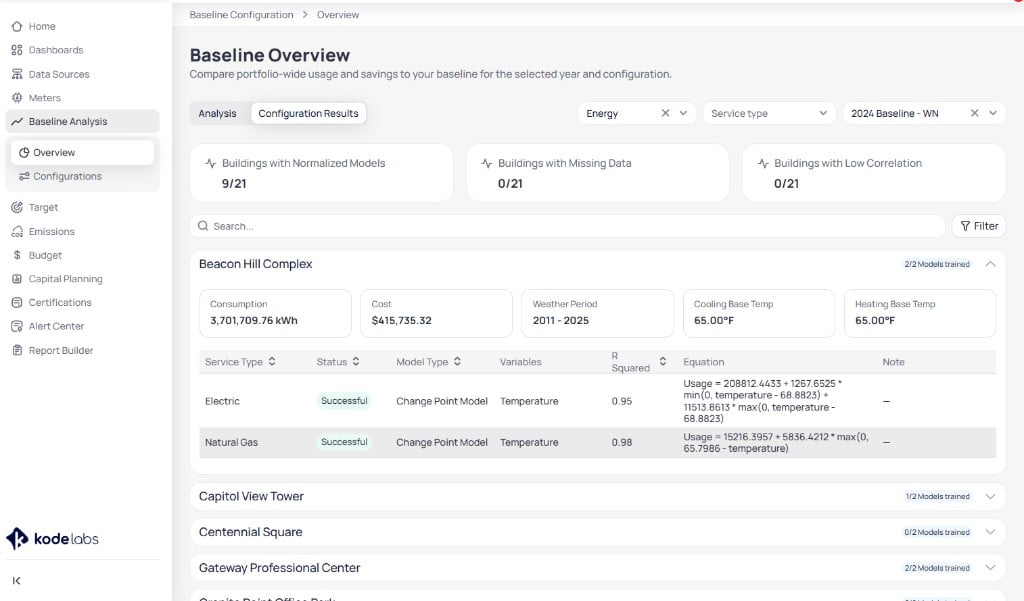
Configuration Results tab with model status summary and expandable building rows
Summary cards
Building detail rows
Expand a building row to see consumption, cost, weather period, and base temperatures. The service-level table shows model type, variables,R Squared, and the regression equation for each service type, plus a note when training needs review. For model fit thresholds, see model accuracy thresholds.
Next steps
Configurations
Create or edit portfolio baseline configurations and train weather models.
Portfolio Home
Return to portfolio rankings before you drill into baseline results.
Portfolio meters
Confirm meter completeness before you collect historical data for baselines.
Portfolio targets
Link reduction targets to the configurations you select on Overview.