

Certifications in the left sidebar to open the dashboard. The page title reads Certifications with the subtitle Manage and track certifications for your buildings.
To add or edit a certification for one building, open the building view and use Building certifications.
EnerG tracks certification status, fees, expiration dates, and historical records. It does not submit or manage certification applications on your behalf.
Navigate to portfolio certifications
ClickCertifications in the portfolio left sidebar.
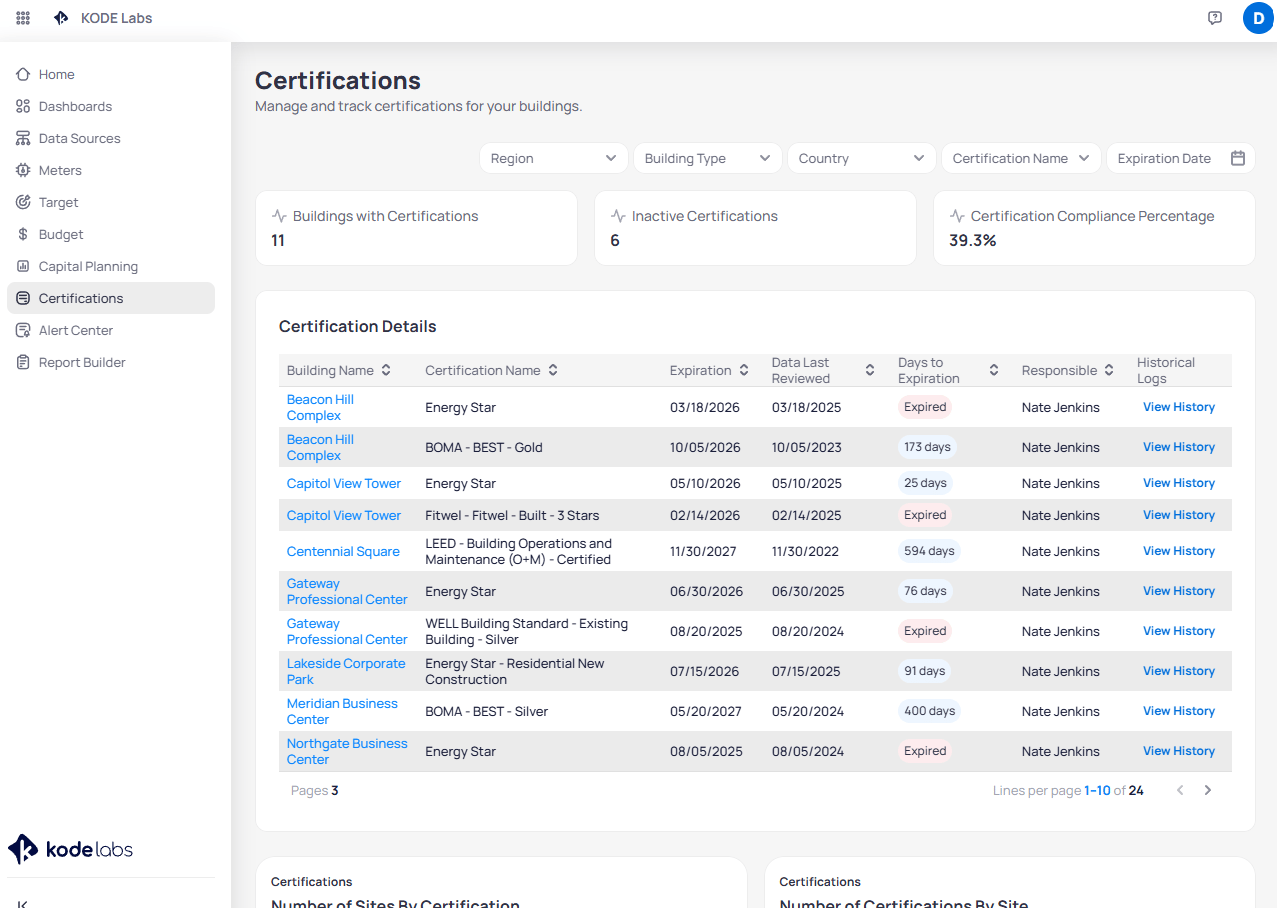
Portfolio certifications dashboard with KPI cards and detail table
Summary cards
Three cards summarize portfolio certification health.Filter the portfolio
Use the filter row above the summary cards to narrow the table and charts.Certification Details table
The Certification Details table lists every certification record in the portfolio. Click a Building Name to open that site in the building view. Use the download control to export the filtered certification list to a spreadsheet.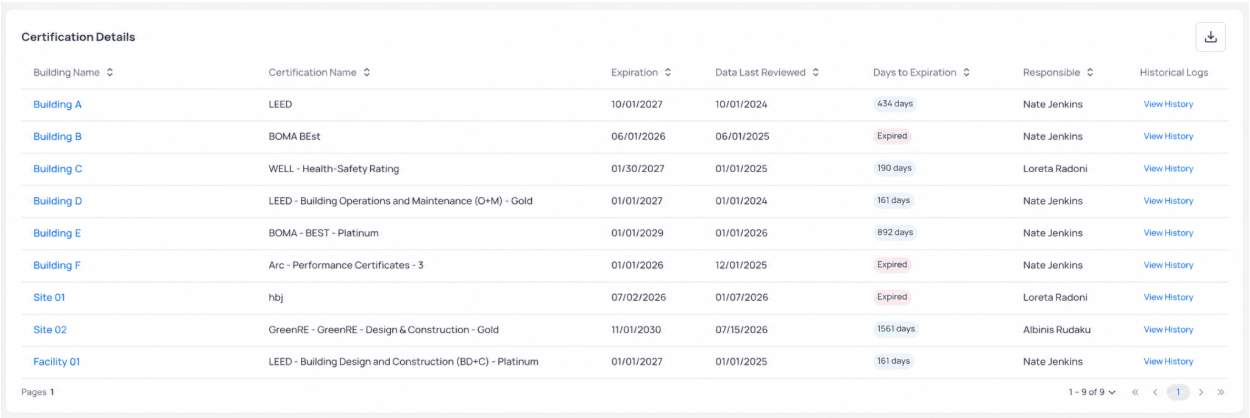
Certification Details table with expiration status and responsible owners
Overview charts
The Overview section includes charts that summarize certification coverage across the portfolio.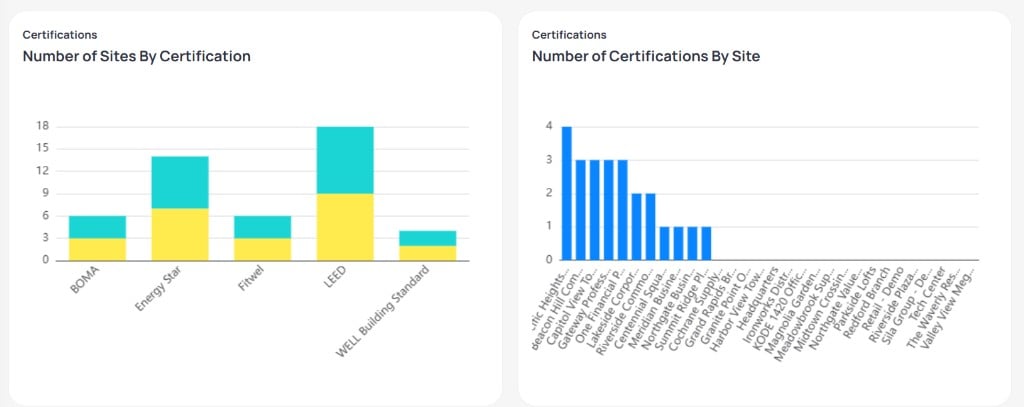
Overview charts for sites by certification and certifications by site
Fee overview
The Fee Overview charts break down certification-related fees by building and by year.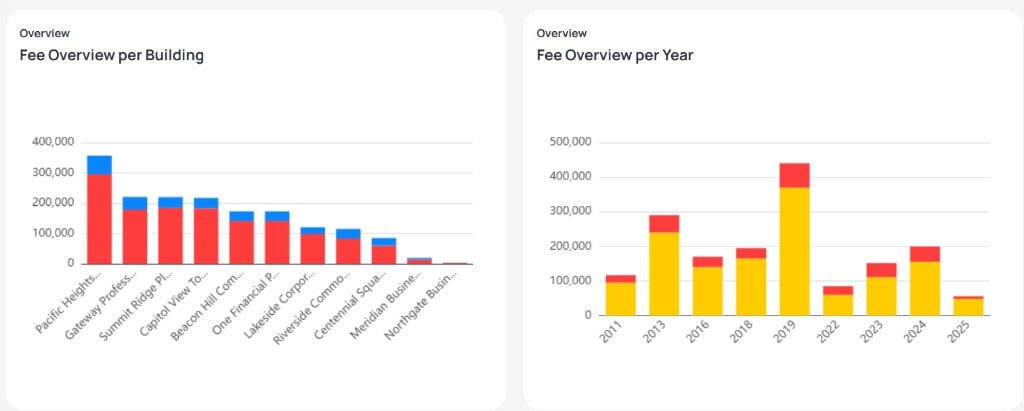
Fee Overview per Building and Fee Overview per Year stacked bar charts
Stacked colors represent fee categories configured in your workspace (for example, consulting versus certification fees).
Cost analysis
The Cost Analysis section shows total investment across certification programs.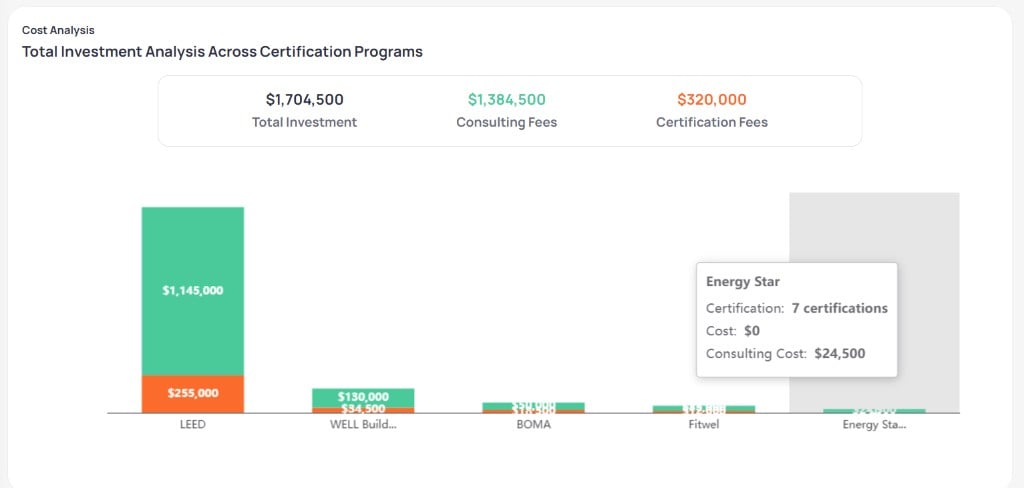
Cost Analysis with total investment summary and fees by certification program
Summary metrics
Fees by program
The stacked bar chart lists each certification program on the horizontal axis. Consulting Fees and Certification Fees stack within each bar so you can compare total cost by program (for example, LEED versus WELL Building Standard versus Energy Star). Hover a bar to see program name, certification count, and fee breakdown when your deployment supports tooltips.Certification data supports environmental, social, and governance reporting when finance and sustainability teams share the same system of record.
Next steps
Building certifications
Add or update certification records for one building.
Portfolio targets
Align reduction targets with certified performance goals.
Portfolio Home
Select a building to manage site-level certifications.
Capital planning
Connect capital programs to certification narratives.