

Savings and charts
The dashboard summarizes performance against the , as shown below.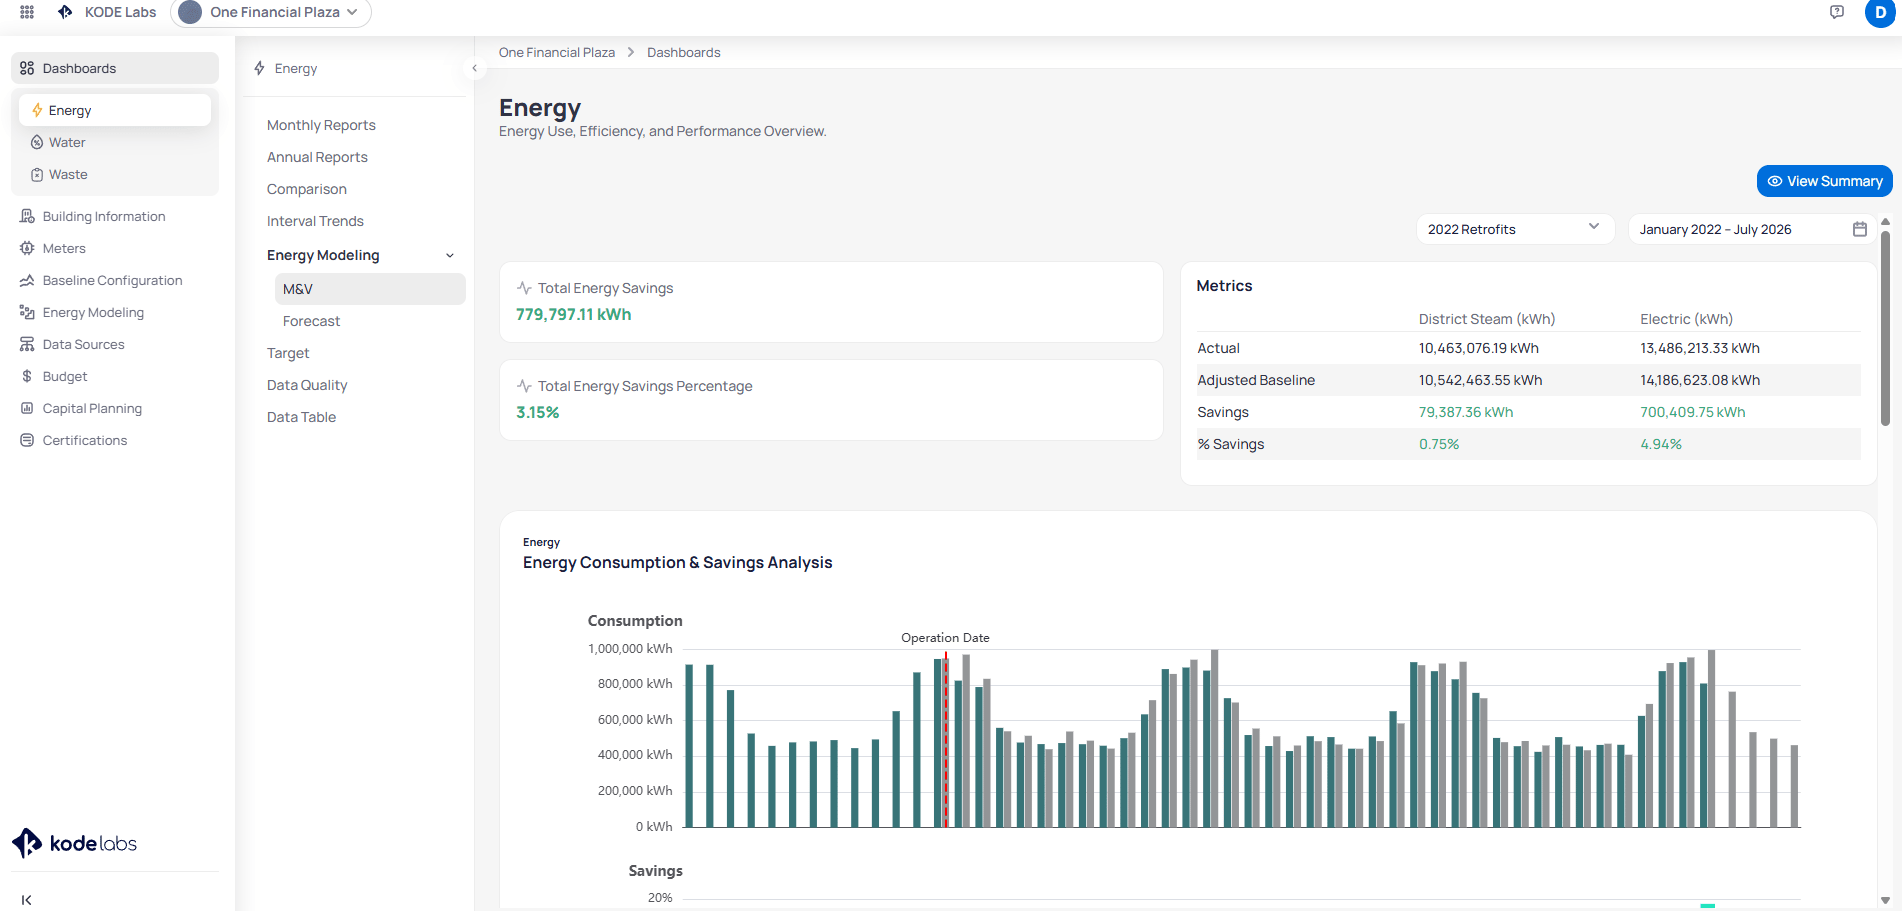
M&V results dashboard showing total savings, metrics table, and consumption chart
- Totals: View total energy savings, percent savings, and breakdown views where the UI provides them.
- Trends: Compare baseline period history, savings over time, and adjusted baseline versus actual series.
- Interval models: Drill into hourly savings when your model uses interval data.
Summary tab
Open the summary tab for the meters, points, model type, and variables used in the run. You also see accuracy metrics and an acceptable or not acceptable status. For what R-squared, CV-RMSE, and MAPE mean and their thresholds, see Model accuracy thresholds.Failed models
Failed runs surface a reason such as low R-squared or insufficient data. Read the error message, then adjust inputs or data coverage and create a new model as needed.Multiple models per building
You can keep more than one model per building when scopes or metering differ. Name and document each model so stakeholders know which run applies to which measure.Next steps
Energy modeling overview
Review IPMVP options, meter types, and how forecasting extends modeling.
Create an M&V model
Configure baselines, variables, and thresholds for a new training run.
Forecasting
Project future consumption after you have an acceptable model.