

Open building budget overview
1
Select a building
From Portfolio Home, open a building in the building view.
2
Open Budget
In the left sidebar, expand Budget, then click Overview.
Summary metrics
Three cards at the top roll up performance for the year you select.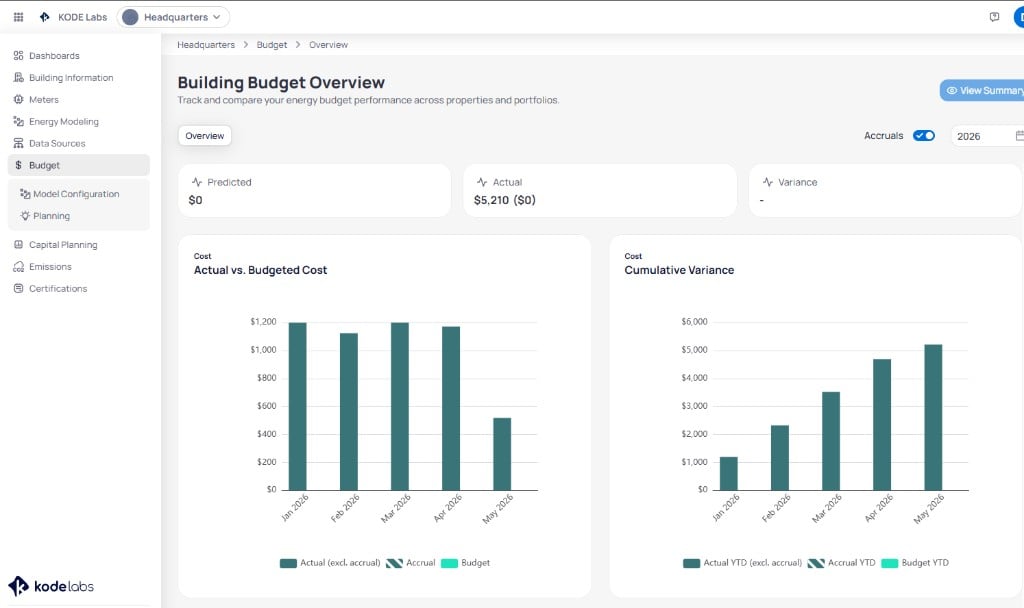
Building Budget Overview with KPI cards and cost charts
When Budget columns are zero, configure monthly amounts in Model configuration so variance and predicted values populate.
Page controls
Charts
Two charts sit below the summary cards. Use the service type toggle to break down total budget versus actual and see which commodities drive increases or reductions.Actual vs. budgeted cost
A monthly bar chart compares spend to plan for each month in the selected year.Cumulative variance
A year-to-date chart stacks the same series cumulatively so you can see how variance builds across the year.Monthly and YTD table
Scroll below the charts for a tabular breakdown. Switch between Monthly and YTD to change how rows aggregate.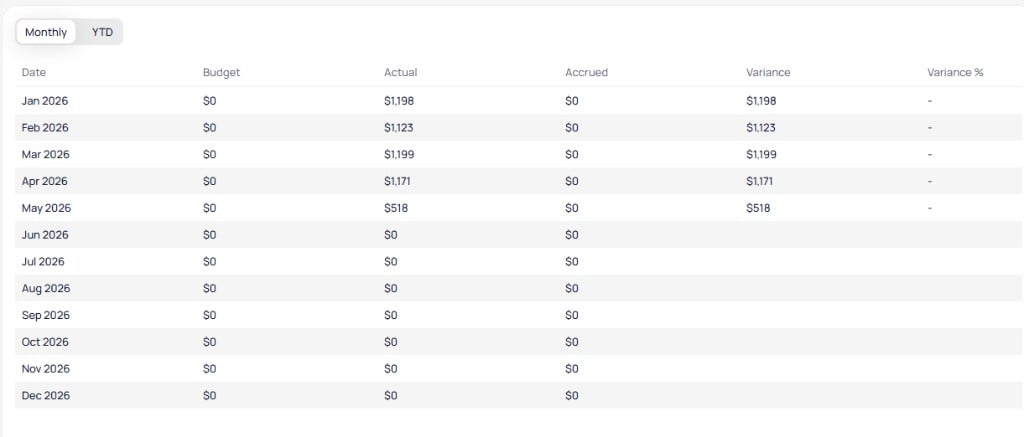
Building budget monthly table with variance columns
Accruals
On Overview, enable Accruals to include estimates for unbilled months in Actual totals, chart series, and variance. Disable Accruals when you need a billed-only view for audits or close processes. For how EnerG builds and trues up accruals, see Accruals and the accrual behavior reference.Accrual behavior may vary by deployment. Confirm labels and calculations in your workspace before you publish variance reports.
Next steps
Model configuration
Create or edit monthly budget values with Manual Flow or Smart Generation.
Budget planning
Create and manage annual budgets with the six-step wizard.
Portfolio budget and planning
Compare this building to portfolio budget rollups.
Building Energy dashboard
Analyze usage and cost trends alongside budget performance.