

FDD Faults groups faults by equipment or routine, shows occurrence metrics, and links to point trends for diagnosis. This page follows Faults on the web.
Events vs Faults
FDD surfaces two related but distinct views of equipment problems:
Open fault detail from
FDD Events when you follow a device link, from FDD Reports from a device, or from the FDD Faults app launcher.
Open FDD Faults
SelectFDD Faults from the building app launcher. Use the header filter icon for area and date chips such as Last 7 Days. Use the history icon to refresh when streaming is enabled.
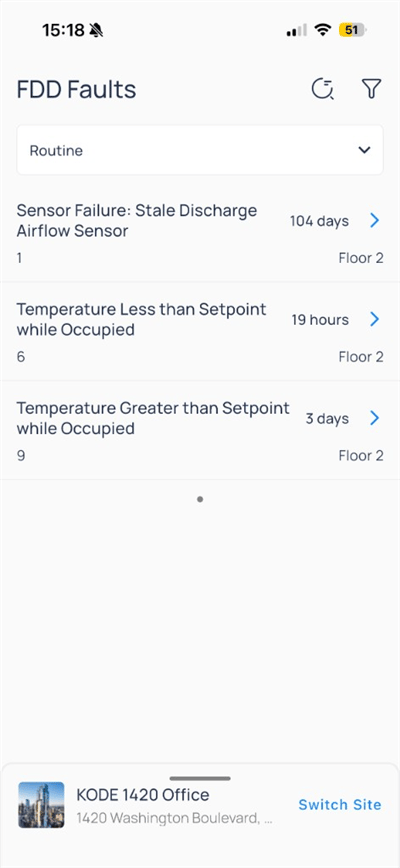
Group faults by view
The header dropdown switches how the list is organized: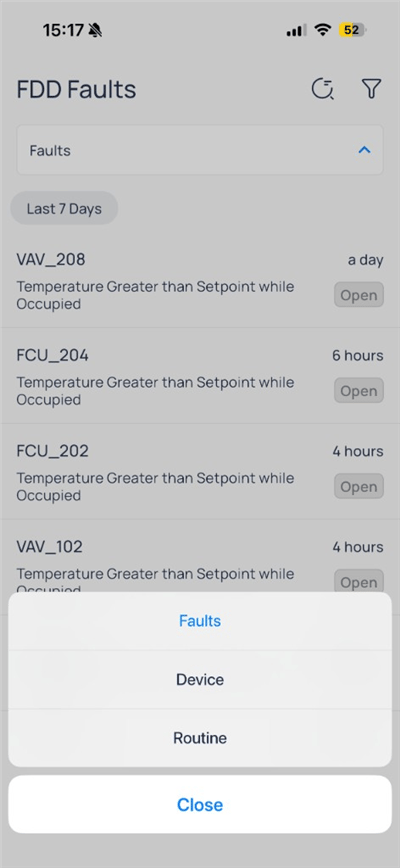
Faults, Device, and Routine
- Faults
- Device
- Routine
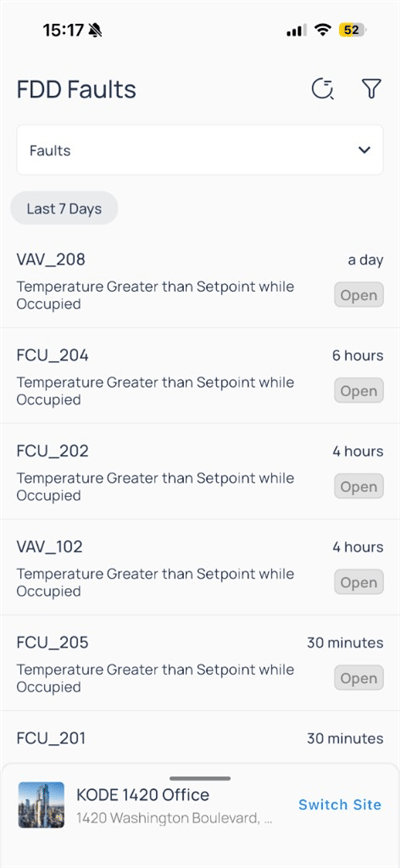
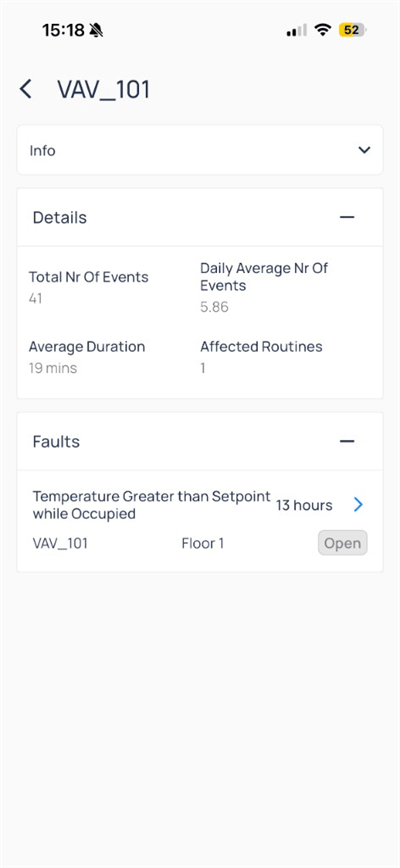
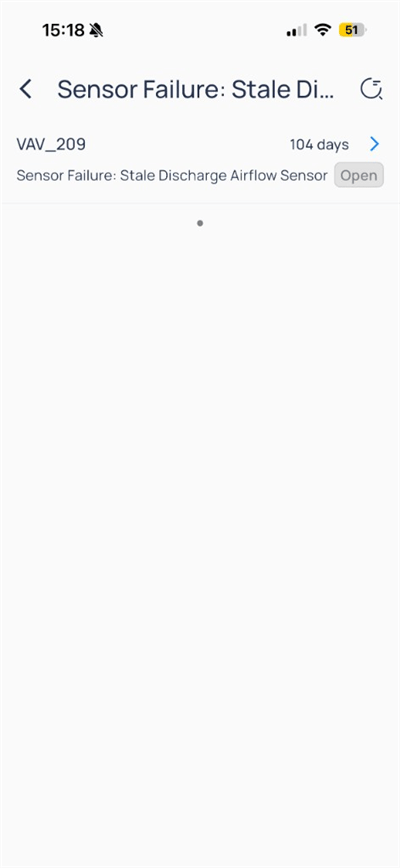
Tap a row for a summary sheet, then
Fault Details for the full page.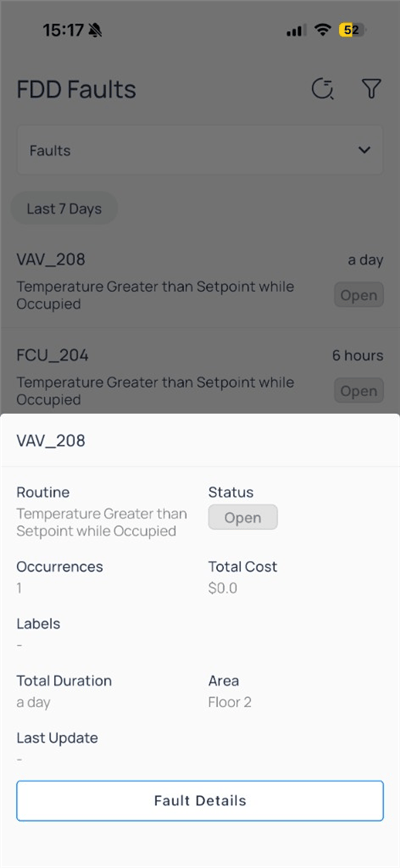
Fault summary before full details
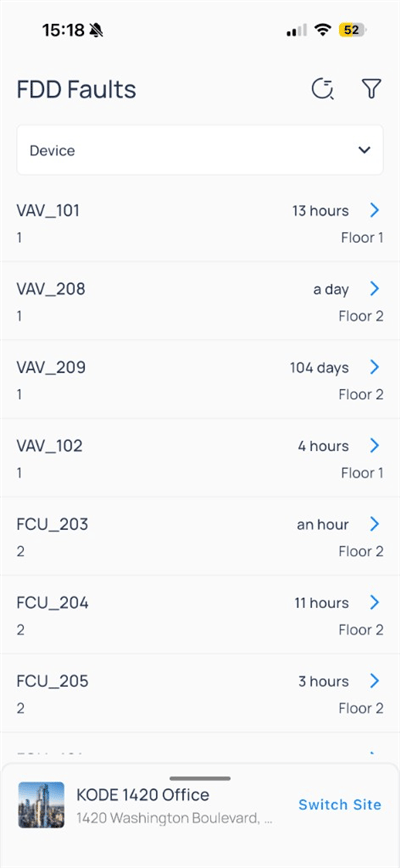
Fault detail
The fault detail page shows status, metrics, and routine logic.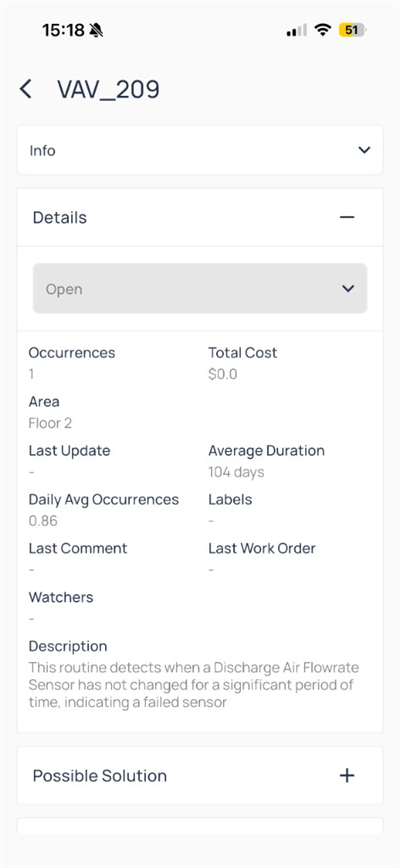
Long-running sensor fault
Expand
Possible Solution for recommended actions. Change status from the dropdown when your role allows.
Investigate with trends
Open the more menu on the fault page: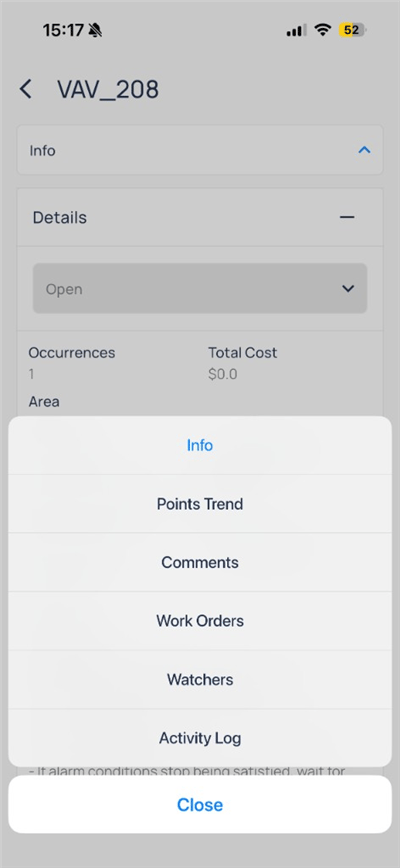
Points Trend, choose points on the device, then open Trends View.
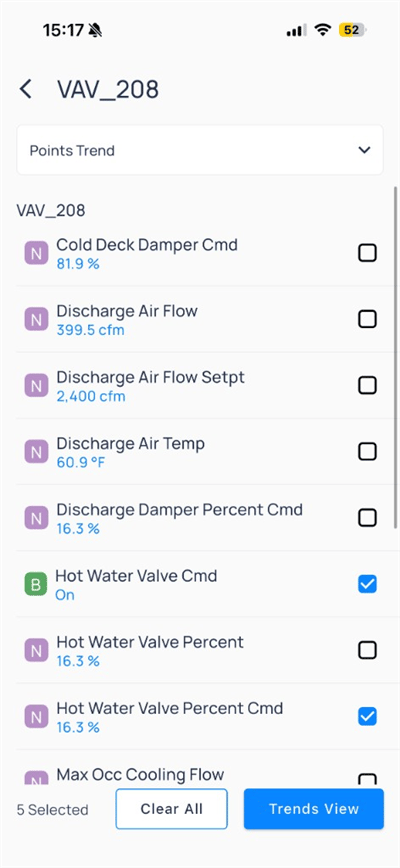
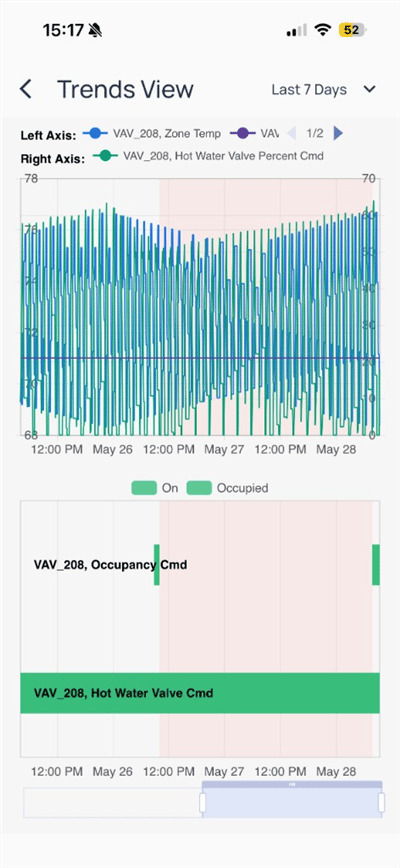
Zone temperature and valve command over time
Collaboration and history
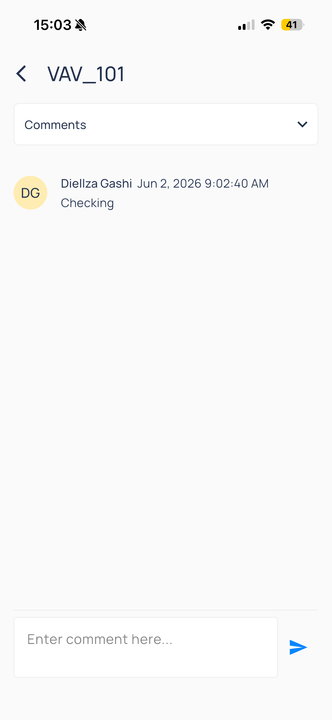
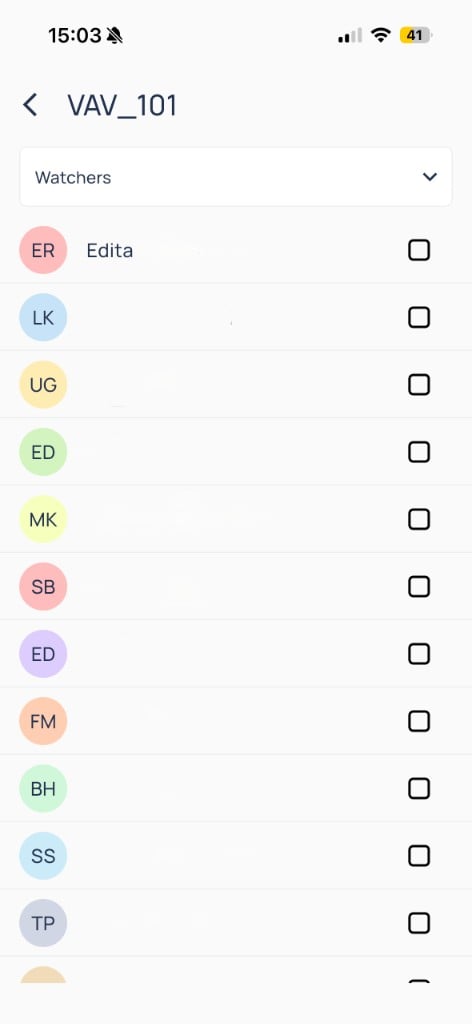
Use the section dropdown below the fault title to switch betweenComments, Work Orders, Watchers, and Activity Log.
Comments
Comments
Work Orders
Work Orders
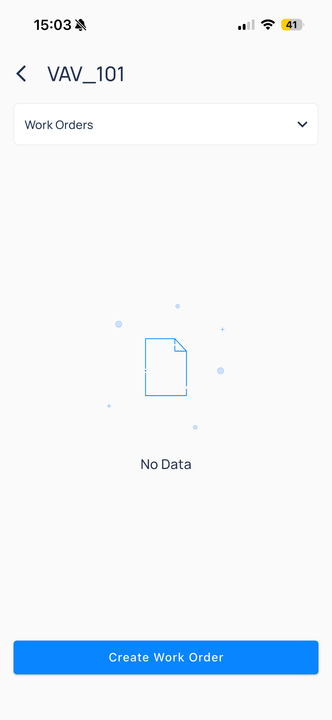
Create Work Order from fault
Work Orders lists work orders linked to the fault. Tap Create Work Order when no record exists yet.Watchers
Watchers
Activity Log
Activity Log
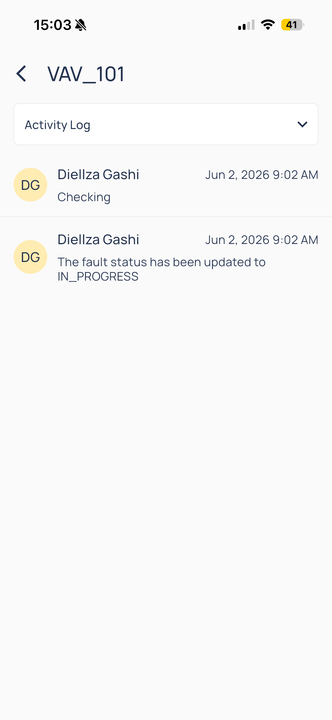
Comments and status changes
Compare to web
Next steps
FDD overview
Choose the right FDD screen for the job.
Events on mobile
Filter, acknowledge, and investigate events.
Devices on mobile
Open equipment, trends, and device actions.