

FDD Events header when you need a summary view instead of only the event table.
When to use Active vs Historical
Both modes share the same chart types. The numbers change with the time window and whether items are still open.
Open dashboards
1
Open FDD Events
Launch
FDD Events from the building app launcher.2
Select Active or Historical
Use the header dropdown.
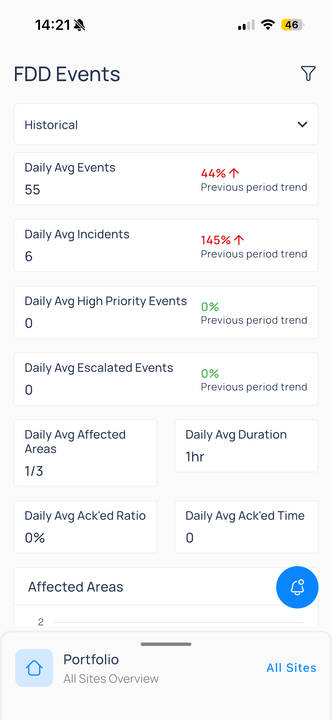
Active shows open-event KPIs. Historical shows period averages and trends.3
Align filters
Use the
filter icon so cards match the same area, priority, and date chips as the list.4
Return to triage
Switch back to
Events or Incidents in the header dropdown when you need to acknowledge or open a record. See Events on mobile.- Active
- Historical
Active puts summary cards at the top of FDD Events.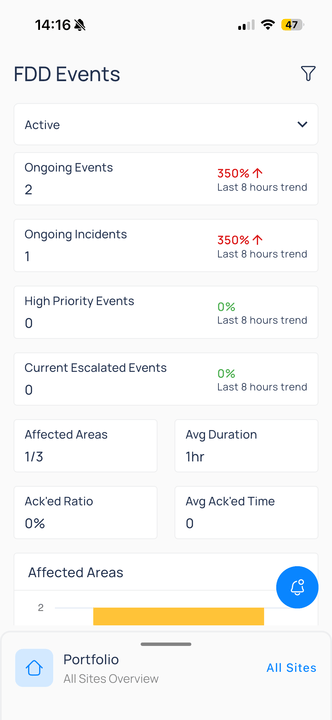
Summary KPI cards with 8-hour trends
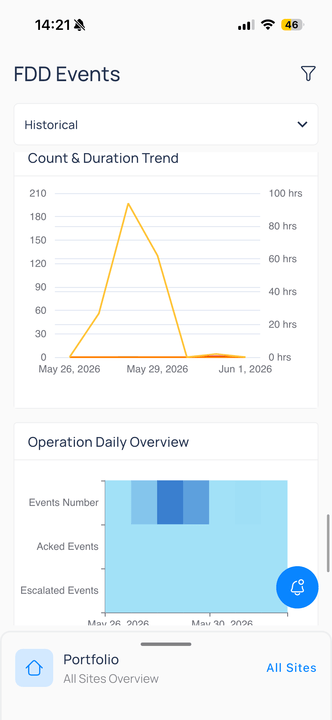
Scroll for charts that break down open events by area, routine, priority, device type, resolution, and assignee.
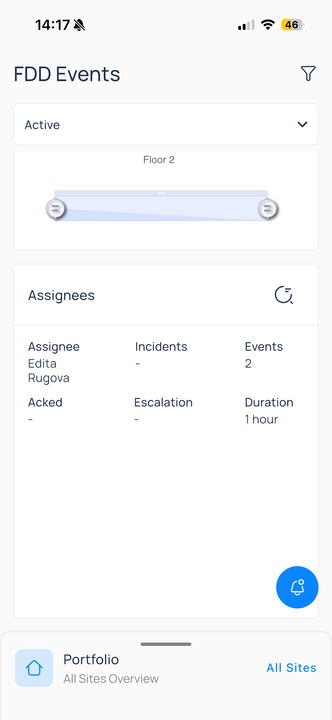
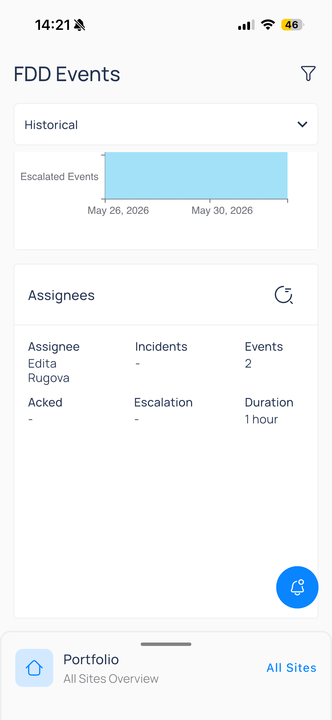
Assignees and floor filter
Assignees table lists open events by owner. Use the floor range control to focus charts on a specific area.Active chart reference
Active chart reference
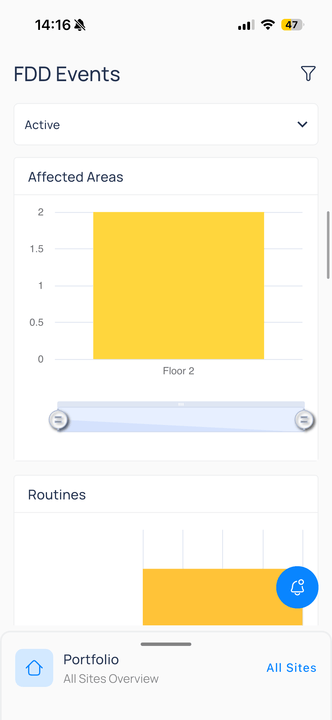
Affected areas by floor
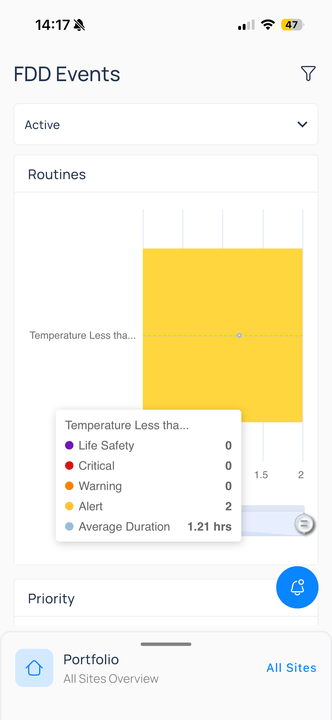
Routines with severity breakdown
Customize layouts on web
Dashboard composition, card types, and building-wide defaults are configured on the web. Mobile shows the published definitions for your role.Next steps
Events on mobile
Filter, acknowledge, and investigate events.
FDD overview
Choose the right FDD screen for the job.