

Trends View for synchronized charts. Adjust the time range and interpolation, and save the view for yourself or your building team. This page follows Trends on the web.
Open Trends
ReachTrends from the building app launcher, equipment menus, system points, or search when enabled.
Select points to chart
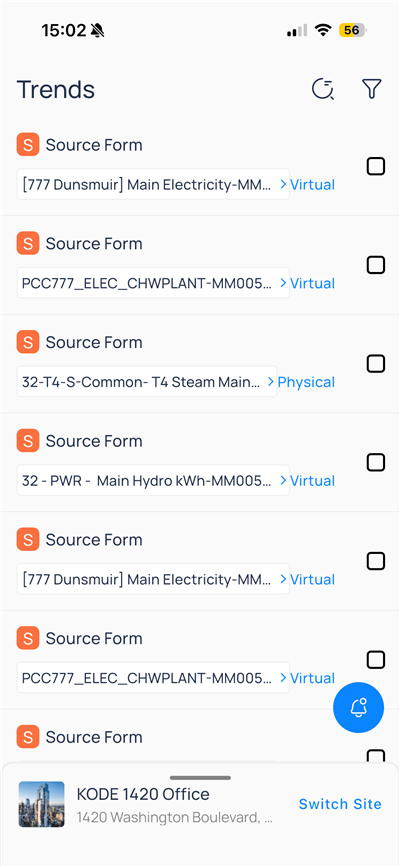
TheTrends home screen lists point entries. Each row shows the point name with the device name below and a label for the device origin—virtual or original.
Apply trend filters
Tap the filter icon on the Trends list to narrow which points appear before you select them.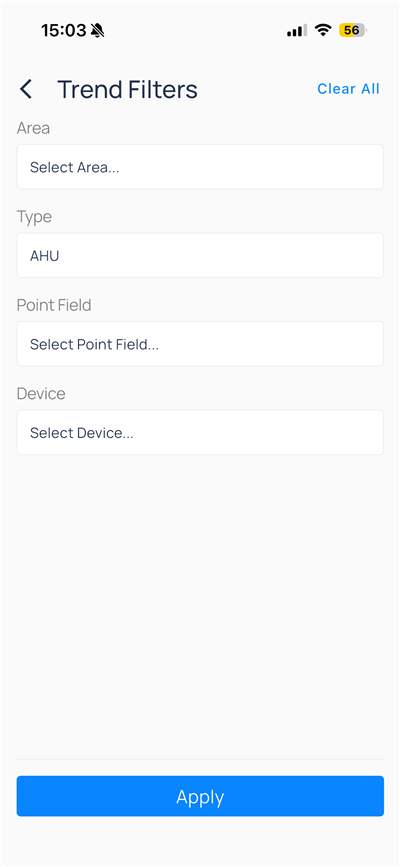
Use
Clear All, then Apply to refresh the list.
Trends View
Select the points you want to trend from the Trends home screen, then tapTrends View on the bottom bar.
Trends View shows stacked charts that share one time axis. Numeric series appear on the top chart; boolean or state series appear on the lower chart.
Header controls
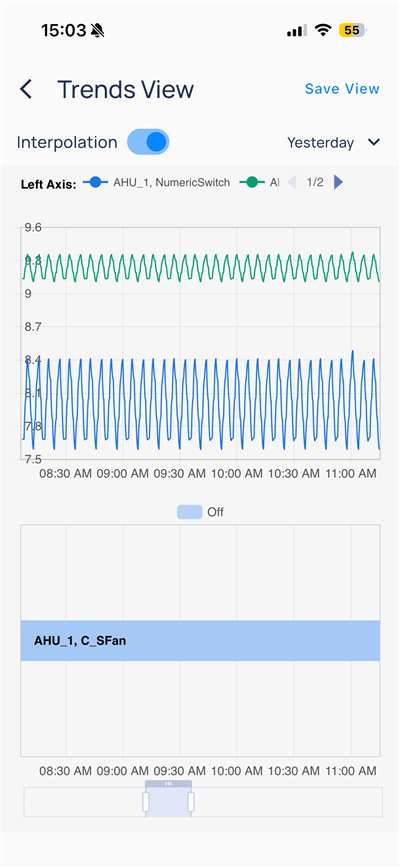
Yesterday with interpolation on
Legend and pagination
Below the controls,Left Axis lists active series (for example, AHU_1, NumericSwitch and AI). Use 1/2 arrows when more series exist than fit on screen.
Numeric chart
- Y-axis shows engineering values (for example, 7.5–9.6)
- Multiple series may render as dense bands when sampling is fast
- Pinch or use the bottom range slider to pan and zoom time
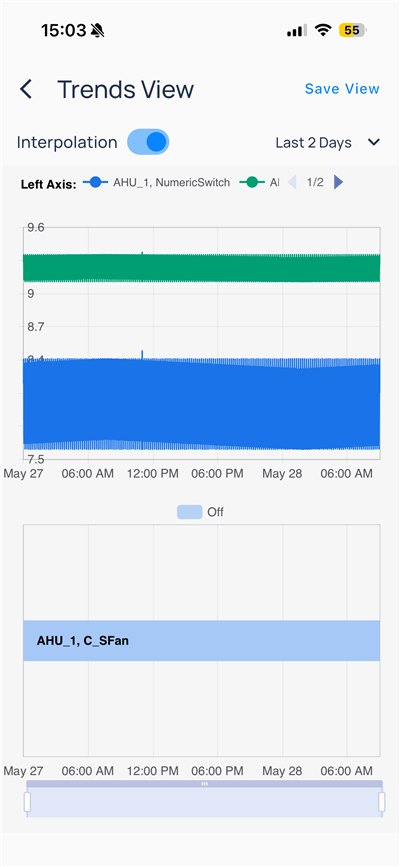
Last 2 Days spans multiple dates on the X-axis
State / boolean chart
The lower chart shows boolean or enum-style points (for example, an AHU fan status) as horizontal bars. A toggle above the chart may label the current state (Off in the screenshot).
Time range presets
Tap the time dropdown to change the window.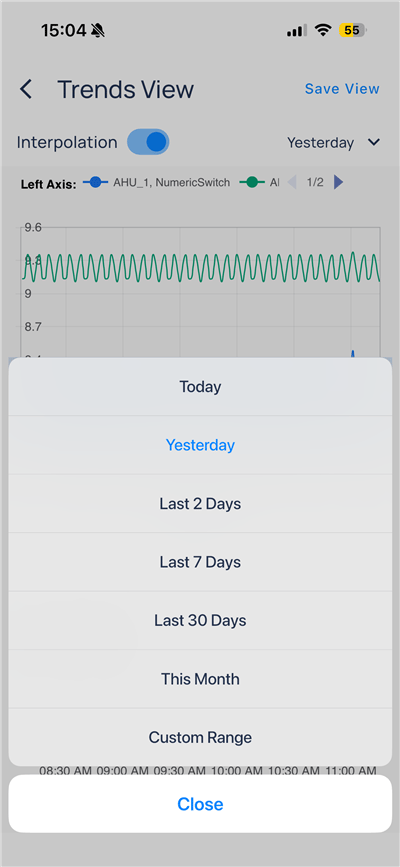
Select
Close to return to the chart.
Save a view
TapSave View to store the current points, range, and interpolation settings.
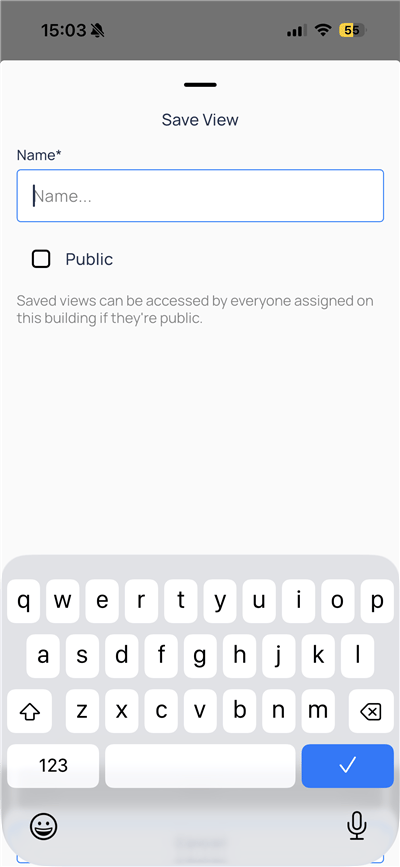
Saved views complement Bookmarks for personal shortcuts; public views behave like lightweight shared templates on mobile.
Compare to web
Next steps
Points on mobile
Browse status, filters, and point writes.
Systems on mobile
Switch dashboard, graphic, and widget views.
Areas and floor plans
Browse floors, layers, and spatial triage.