

Navigate to systems
Select your site
Sites in the left navigation bar and select the building you want to manage.Open the systems module
Systems in the left sidebar menu. The systems list displays all configured systems for the selected building.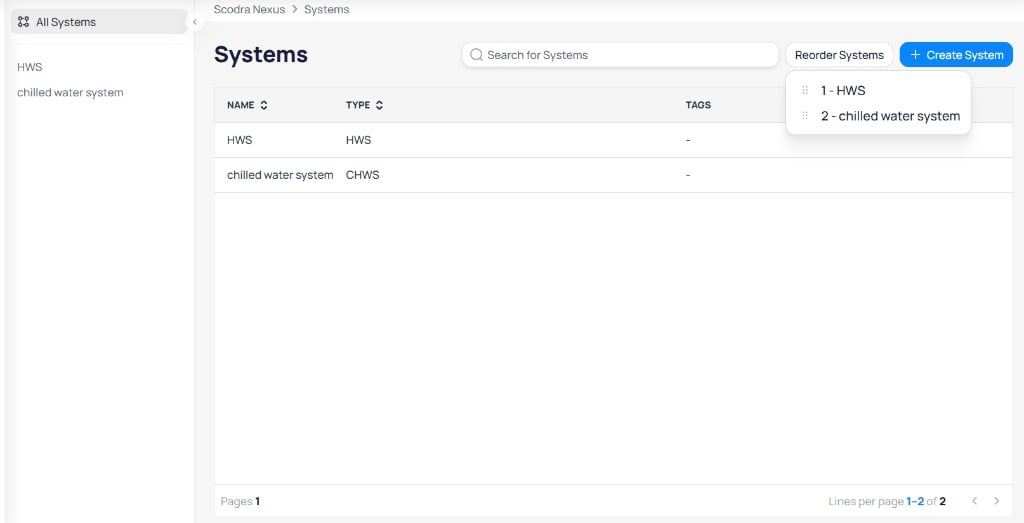
The Systems list shows all systems with their type and tags, plus options to search, reorder, and create
Select a system
Create a system
Click+ Create System to open the creation dialog.
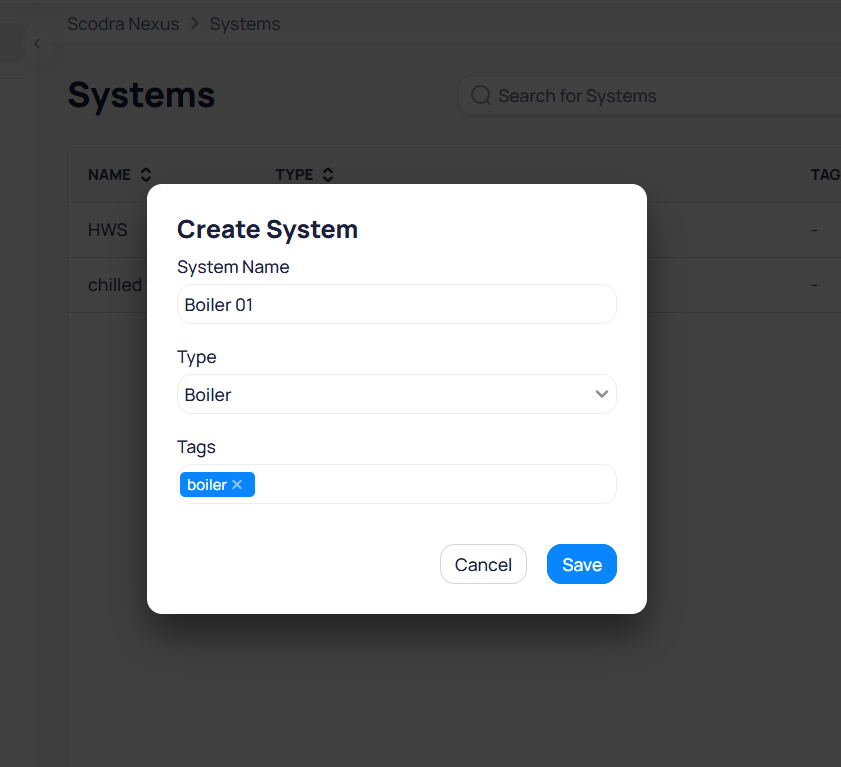
The Create System dialog collects the system name, type, and tags
Boiler 01).Boiler, HWS, CHWS).+ Create New button to add a graphic. Use the icons on the right sidebar to switch between views and access system details.
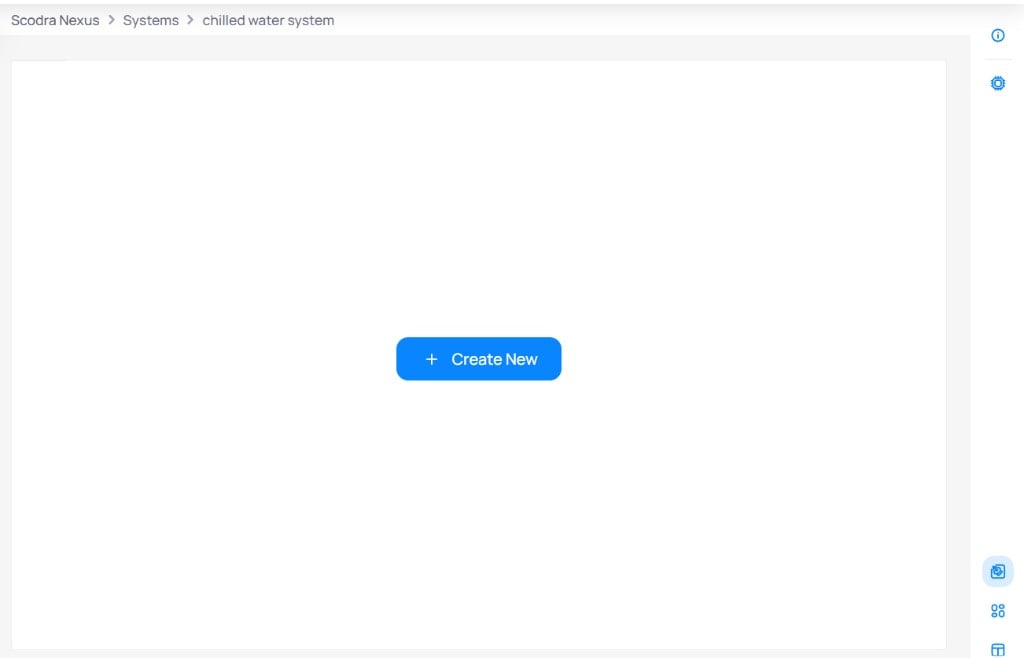
A newly created system opens with an empty canvas ready for a graphic
Reorder Systems and drag them into the desired sequence.
View options
When you select a system, the system details view provides several perspectives. Switch between views using the icons on the right navigation bar.Graphics view
The Graphics view displays the system schematic with live data overlaid on equipment components. Point values update in real time on the diagram.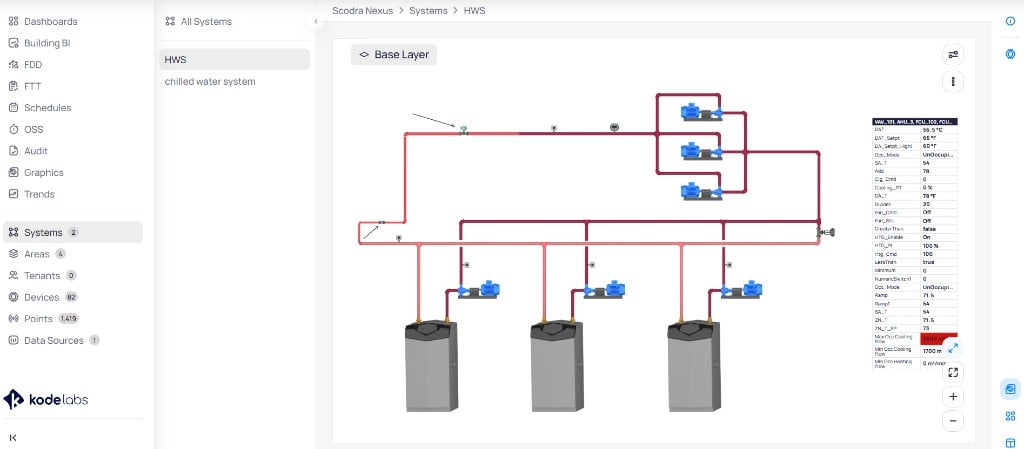
The Graphics view shows a chilled water system schematic with live point values displayed in a table alongside the diagram
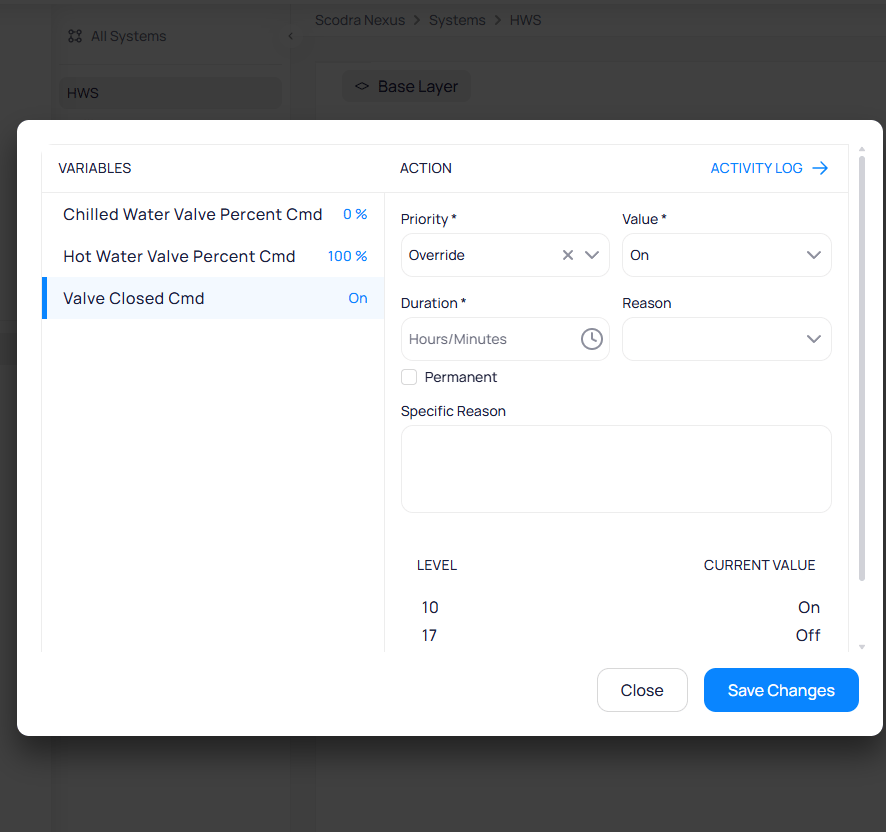
The command panel shows device variables and the action form for overriding a point value
- Priority — select the command priority level (for example,
Override) - Value — set the target value. Use the dropdown for enumerated values (for example,
OnorOff). - Duration — specify how long the command remains active. Check
Permanentfor an indefinite override. - Reason — select a predefined reason from the dropdown
- Specific Reason — enter a custom reason for the change
Save Changes to send the command, or Close to cancel. Click Activity Log in the upper right corner to view the command history.
Command actions and priority levels
Cloud BMS uses a BACnet-inspired priority model for writable points. The same command dialog appears for BACnet and non-BACnet integrations, such as REST API thermostats. How each action maps on the device depends on the connector.BACnet points that accept commands have 16 priority levels (1 is highest, 16 is lowest). When every level is empty (null), the point uses a fallback / default value (Relinquish_Default in BACnet). That fallback is not a 17th BACnet priority. Some interfaces label it as level 17 for display only.Override and Set turn different knobs under the hood, even when the visible value looks the same.Override, Auto, and Set borrow Niagara-style action names. Release is a Cloud BMS action that clears a Set.In Niagara-style control, Set keeps a non-null fallback so sequences and logic keep a reliable baseline. Use the priority array (including Override) for programmed automation and temporary exceptions.To make Set write to priority 16 instead of the fallback or default, enable Set in Slot16 (Niagara) on the point. Configure that option from device details, device templates, or points batch update.Dashboard view
The Dashboard view charts system points over time, grouped by category (Temperature, Flowrate, and others). Each chart shows sensor and setpoint values with a configurable time range.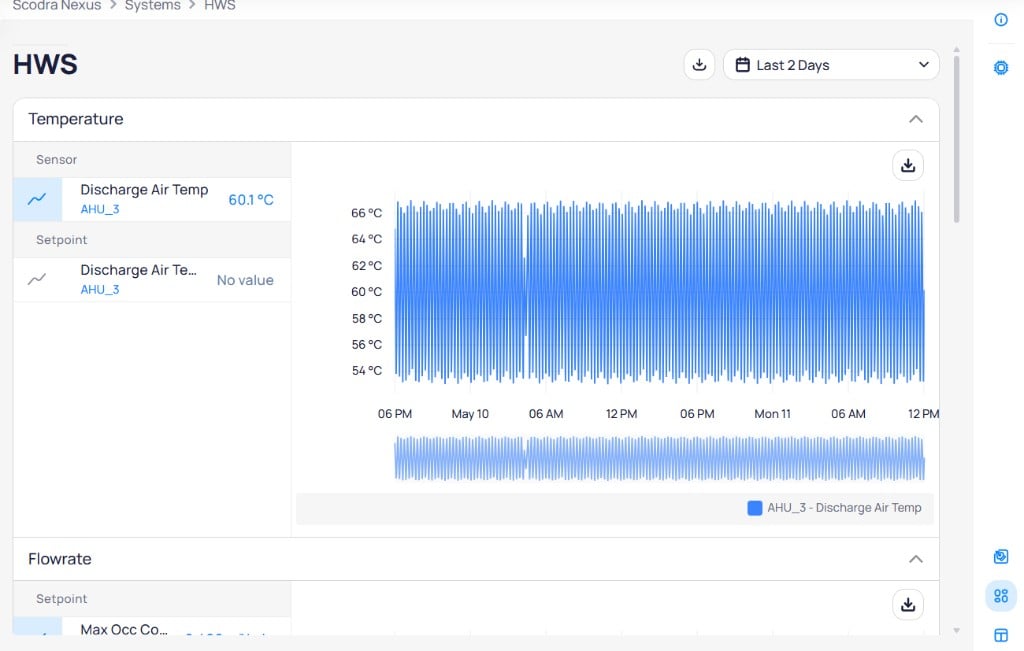
The Dashboard view displays point trends organized by category with downloadable charts
Widget view
The Widget view displays all system devices as cards with their current point values. Each card shows the device name and its key readings.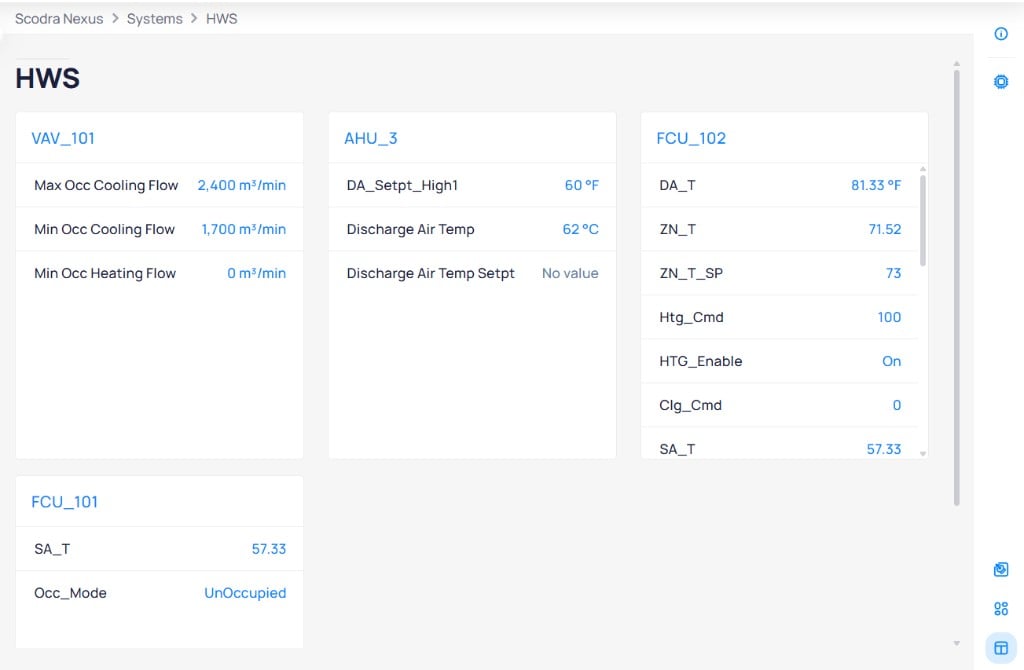
The Widget view shows all system devices as cards with live point values
System details
Click the information icon on the right sidebar to view the About System panel.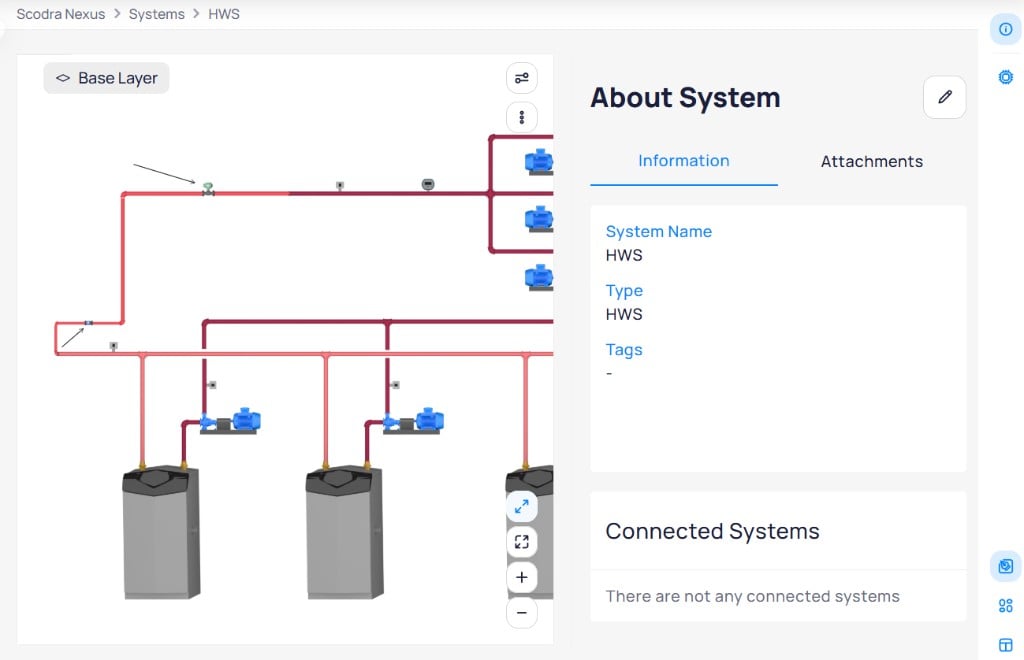
The About System panel shows system metadata including name, type, tags, and connected systems
- Information — displays the system name, type, tags, and connected systems
- Attachments — upload and manage photos, documents (submittals, O&M manuals, as-built drawings), and notes
System devices
Click the devices icon on the right sidebar to view all devices associated with the system. The panel lists each device with tabs for quick switching between them.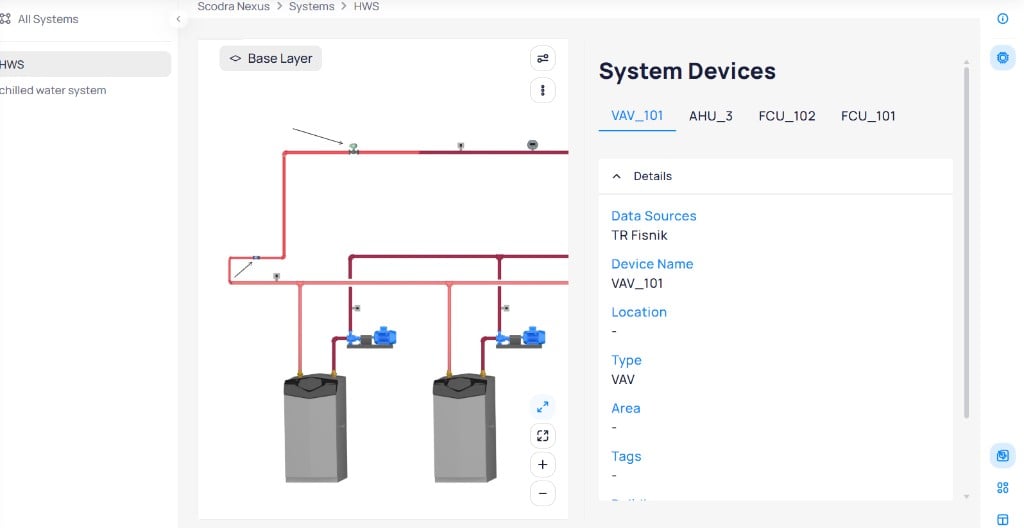
The System Devices panel shows device details including data source, name, location, type, area, and tags
System-level health indicators
Each system displays aggregate health information:- Total devices in the system
- Percentage online showing the ratio of communicating devices
- Active alarms indicating fault conditions across the system’s equipment
- Communication score reflecting overall data source reliability for the system
Edit system graphics
Click the three-dot menu on the right side of the Graphics view and selectEdit to enter edit mode. You can also select Delete to remove the graphic.
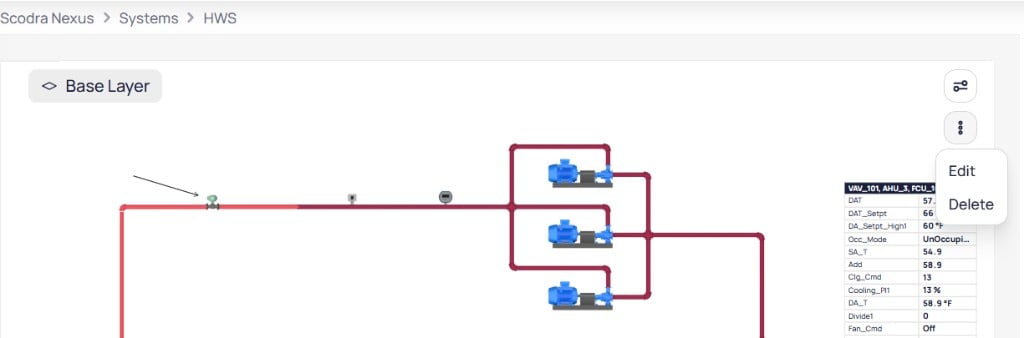
The three-dot menu on the system graphic provides Edit and Delete options
Enter edit mode
Edit from the three-dot menu to open the system graphic in the editor.Modify the graphic
Save changes
Save to apply your changes to the system graphic.