

OSS in the left sidebar. You can also access OSS from the Schedules module by clicking the OSS tab.Benefits
- Energy savings — reduces energy consumption by starting HVAC equipment only when needed, avoiding unnecessary early starts
- Occupant comfort — ensures spaces reach the target temperature by the time occupants arrive
- Engineering efficiency — frees up engineers from manually adjusting start times based on weather and building conditions
- Real-time insights — provides daily data on comfort performance and space conditions through the OSS dashboard
- Performance tracking — analyzes energy savings and equipment performance over time with historical trend data
How OSS works
The OSS algorithm analyzes three categories of input to calculate the optimal start time:- Sensor data — indoor zone temperatures, setpoints, occupied mode, run status, and fan commands
- Weather data — outdoor temperature, humidity, wind speed, and atmospheric pressure
- Building factors — insulation characteristics, current conditions, and device performance history
OSS Start Time = Schedule Start Time - OSS Prediction
For example, if the schedule start time is 08:00 and OSS predicts 45 minutes to reach the setpoint, OSS starts the equipment at 07:15 instead of the traditional 06:00 fixed start.
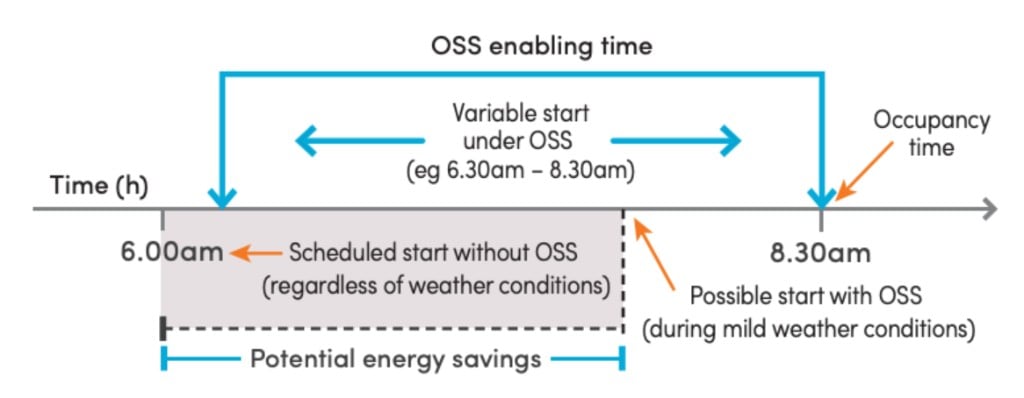
OSS calculates a variable start time between the traditional fixed start and occupancy time, creating potential energy savings
Operation modes
OSS provides three modes that balance comfort and energy savings differently. Select the operation mode from the OSS page. The status bar at the bottom shows whether OSS is currently active or inactive, with anActivate button to enable it.
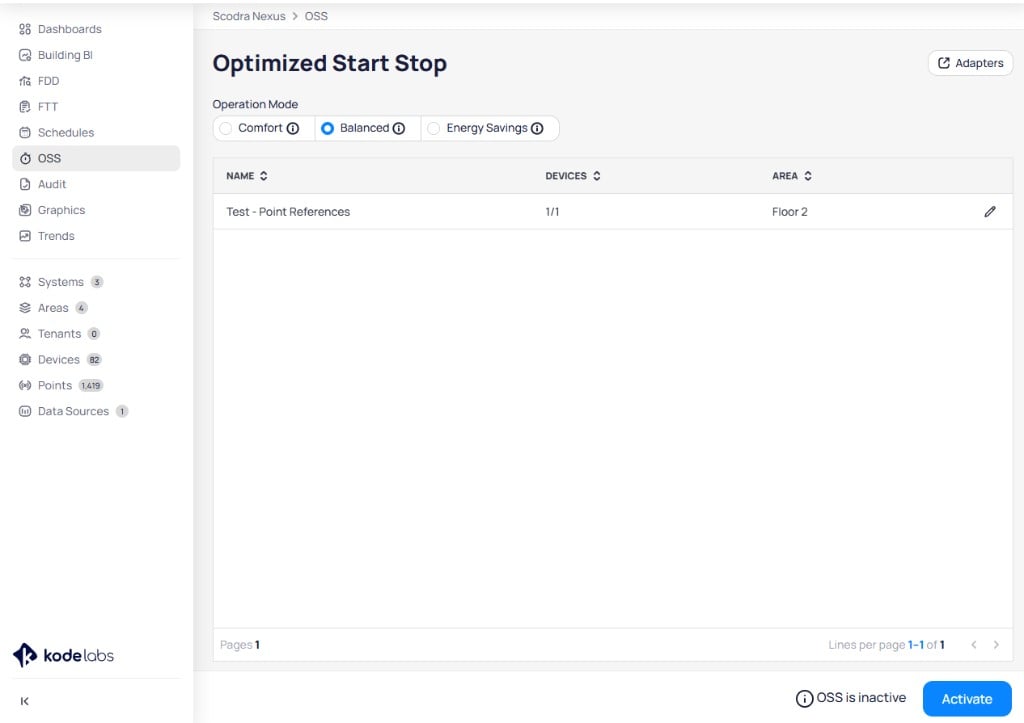
The OSS page shows the operation mode selector, adapter configurations, and activation status
Requirements
Permissions
The following user roles have default permissions to configure OSS:- Super Admin
- System Admin
- System Integrator
- Engineering Manager
Required points
The OSS machine learning model requires these five points on each device:occupied_mode point must be writable on either the base or reference device.Schedule requirements
OSS requires a valid schedule configured on the devices. Without a schedule, OSS cannot determine when occupancy starts or control equipment start times.Data requirements
For accurate predictions, OSS requires at least 15 to 20 devices with at least 15 days of valid historical data. Theoccupied_mode and run_status points must show regular on/off switching patterns during this period.
Supported HVAC architectures
OSS supports multiple HVAC system configurations:- VAV - AHU — variable air volume boxes controlled by an air handling unit
- VAV - AHU - AHU — cascaded AHU configurations
- FCU — fan coil units operating independently
- AHU — standalone air handling units
Configure an OSS adapter
The OSS specifies which devices to optimize and which points to use for control. Each building requires its own adapter configuration.Create a new adapter
Open the adapter page
OSS from the building sidebar. Click Adapters in the upper right to view the list of configured adapters.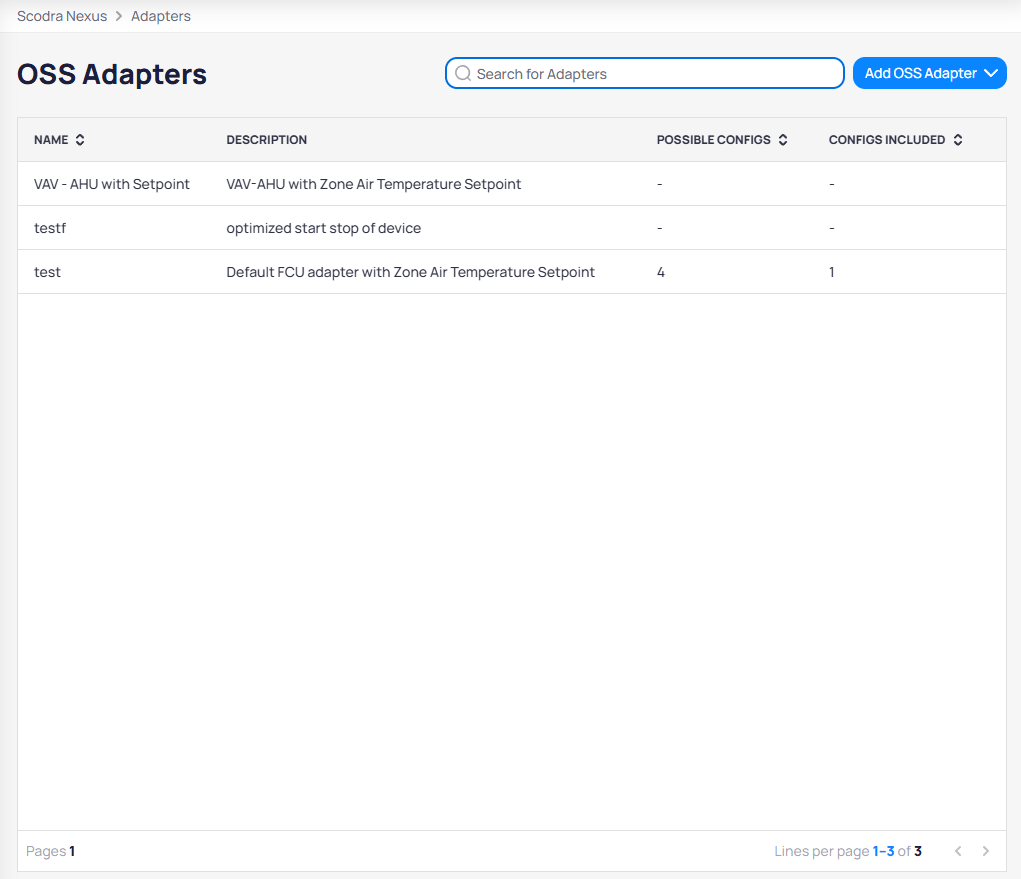
The OSS Adapters page lists all adapters with their description, possible configs, and configs included
Add OSS Adapter to expand the dropdown with two options: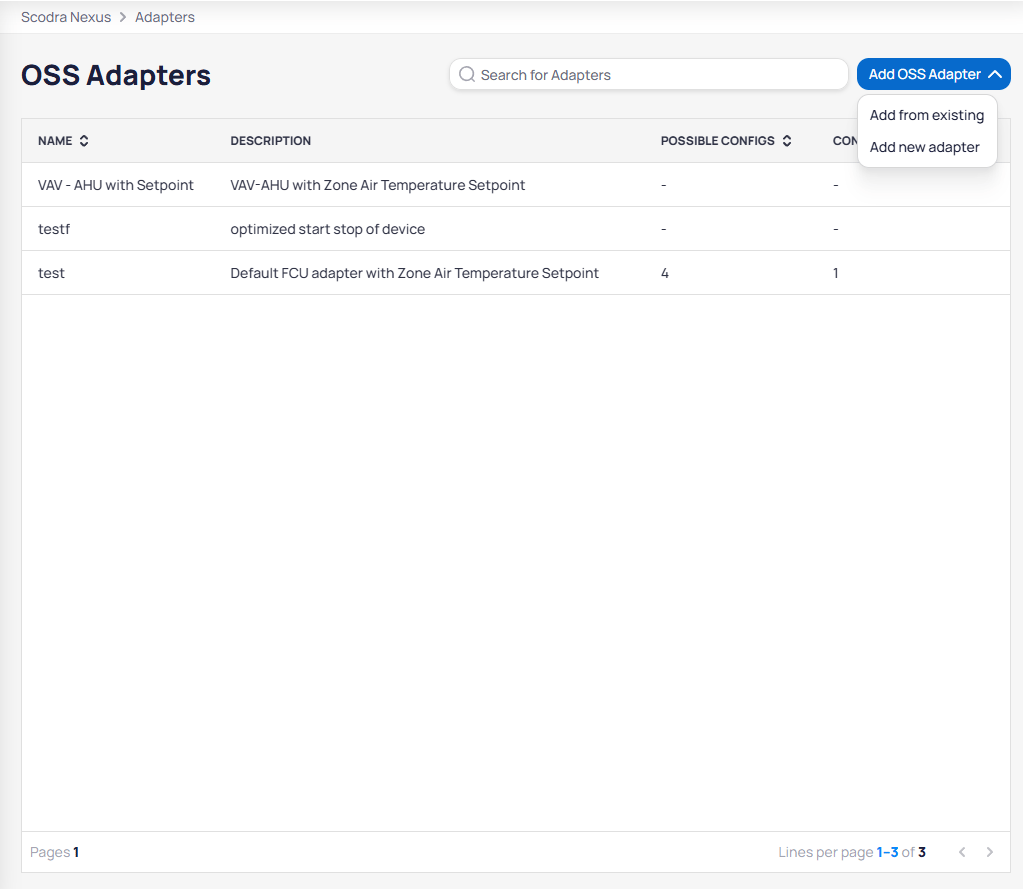
The Add OSS Adapter dropdown provides options to add from an existing template or create a new adapter
- Add from existing — use a pre-built adapter template from the KODE library
- Add new adapter — create a custom adapter from scratch
Add new adapter to start the creation wizard.Select devices
vav or fcu). Click + Add Reference to add a reference device if the architecture requires it (for example, an AHU that serves the selected VAVs).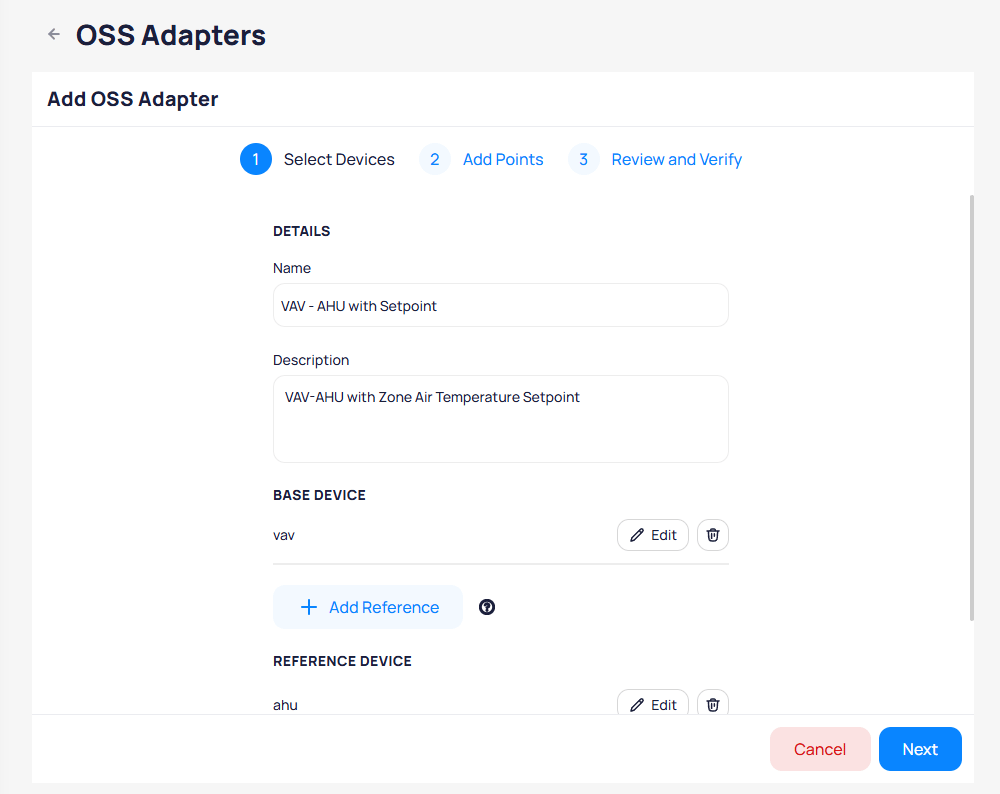
Step 1 configures the adapter name, description, base device, and optional reference device
Next to proceed to point mapping.Add points
Edit Points button to configure the specific point mapping.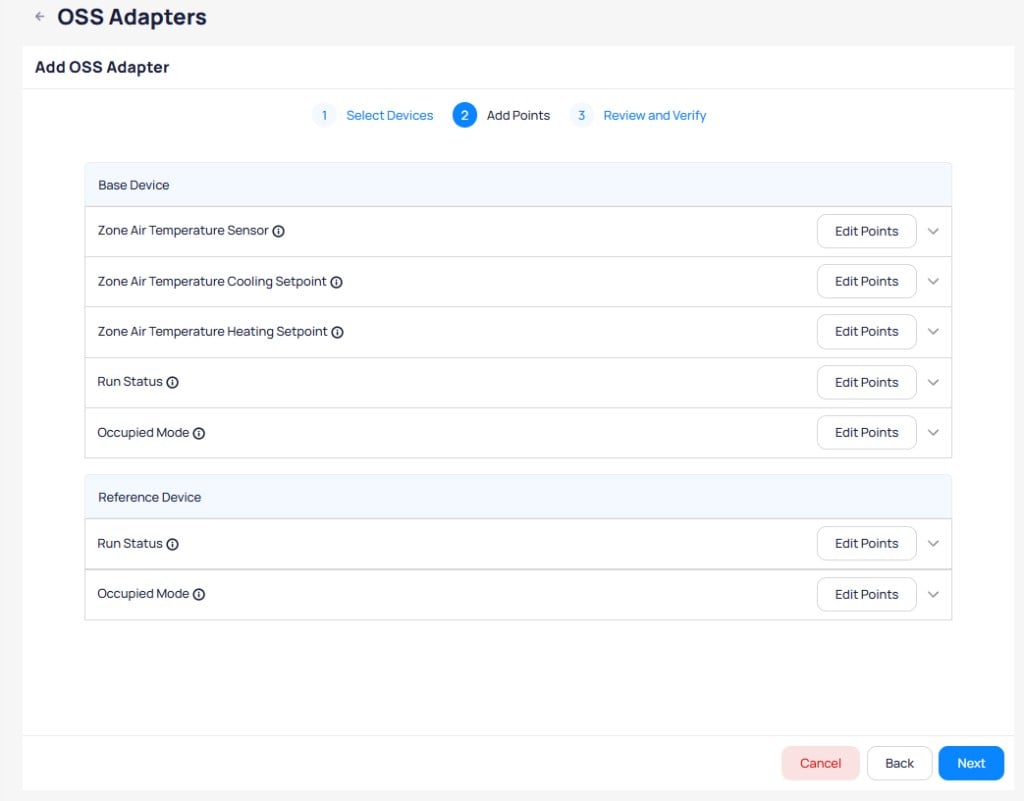
Step 2 lists the required points for the base device and reference device with Edit Points options
Edit Points on a point type to expand it and configure the mapping. Select the point from the device, set the aggregation function if multiple points of the same type exist, and map enum values for on/off or occupied/unoccupied states.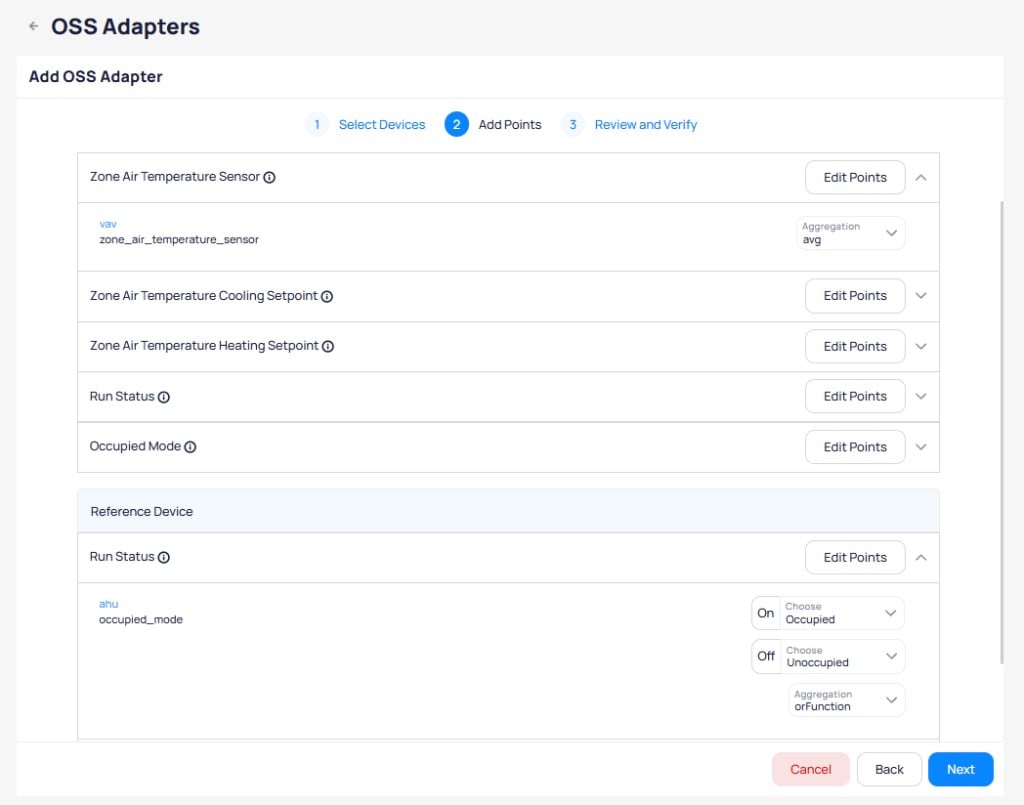
Expanded point mappings show the selected point, aggregation function, and enum value configuration
Review and verify
- Completed Devices — lists devices that meet all OSS requirements (required points mapped, schedules in place, writable occupied mode)
- Devices With Issues — lists devices that need adjustments before OSS can control them
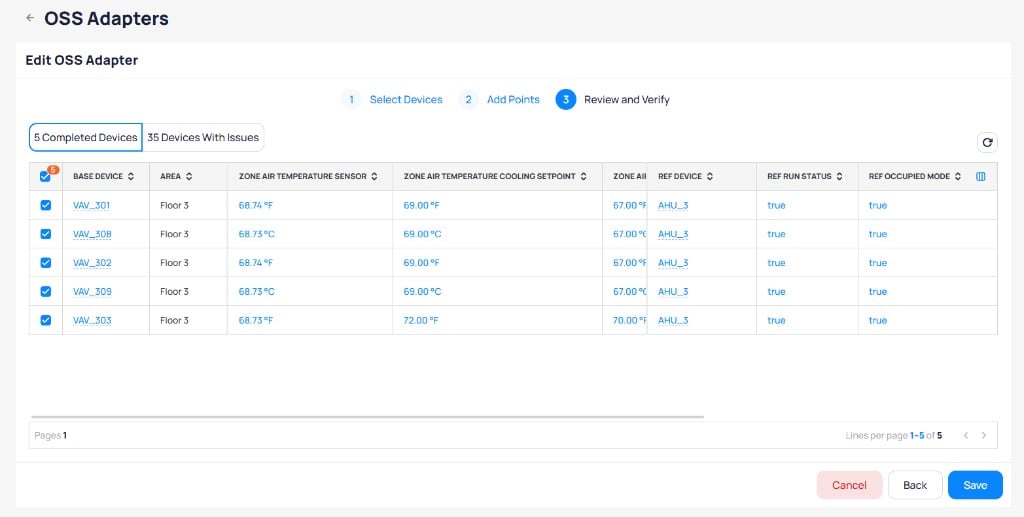
The Completed Devices tab shows devices with all points mapped and ready for OSS control
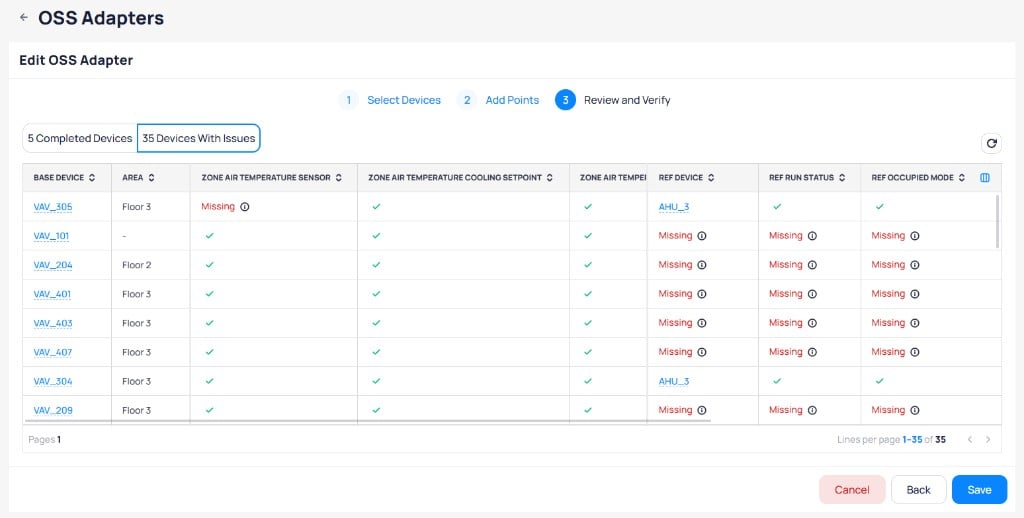
The Devices With Issues tab highlights missing points and configurations that need attention
- Required ontology point fields are not assigned
- Occupied Mode is missing or not writable
- Required enum values are not mapped for Occupied / Unoccupied interpretation
- The device has no schedule point reference
- Parent or child device referencing is missing (for example, a VAV without an
isFedByAHU)
- Fix missing schedule references on the schedule Point References page.
- Add missing device references (for example,
isFedBy) on the device. - Complete ontology field mapping in device modeling.
- Map enum values for Run Status and Occupied Mode as needed.
- Return to Review and Verify and select
Refreshto re-check status.
Save.Activate OSS
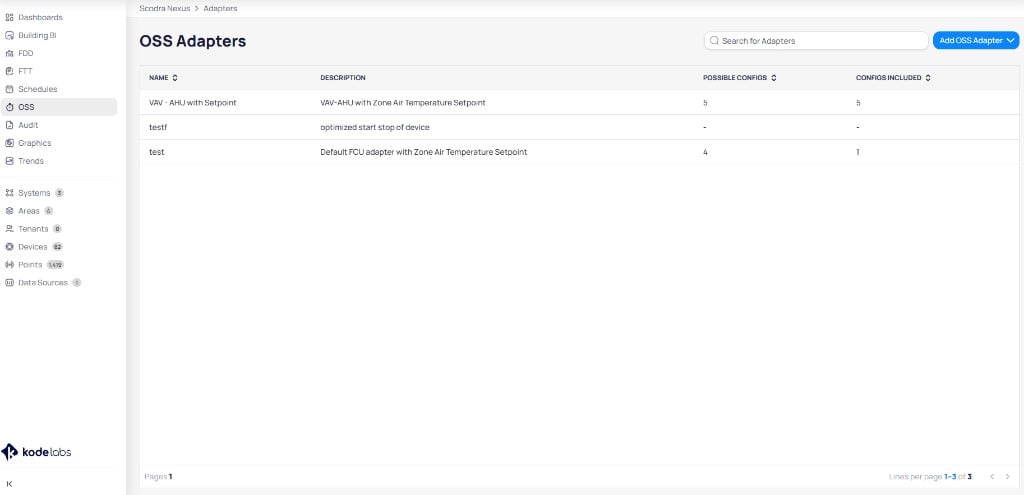
The OSS Adapters page shows the saved adapter with possible and included config counts
Activate in the bottom right corner to enable OSS.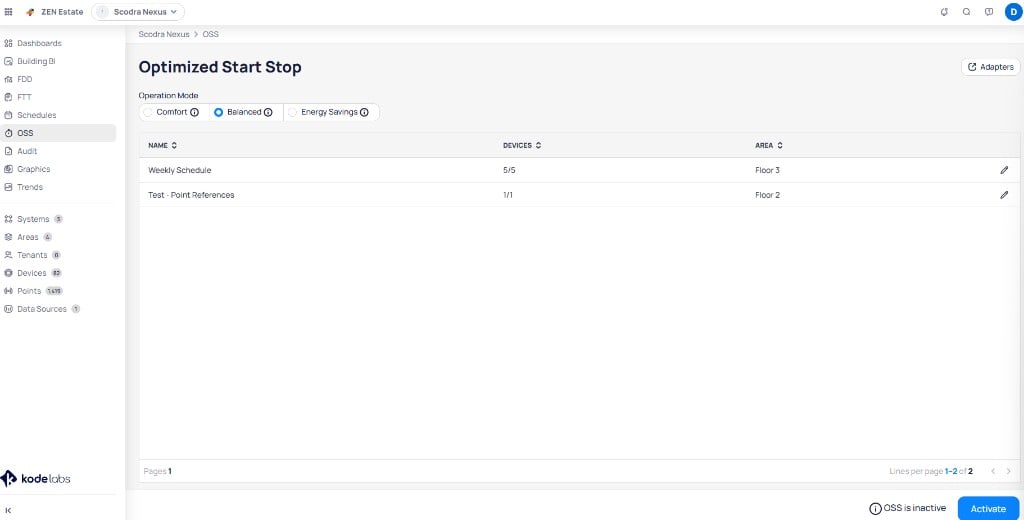
The OSS page shows all configured adapters with their device counts and the Activate button
Confirm to activate OSS.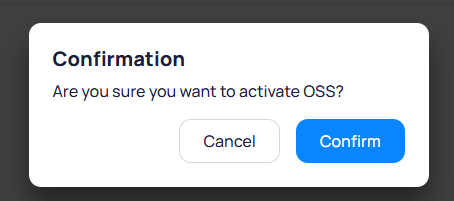
Confirm the activation to enable OSS for the configured adapters
OSS shows a preparing state while the algorithm initializes
Use an existing adapter template
KODE Labs provides pre-built adapter templates for common HVAC configurations. ClickAdd OSS Adapter and select Add from existing to browse the template library.
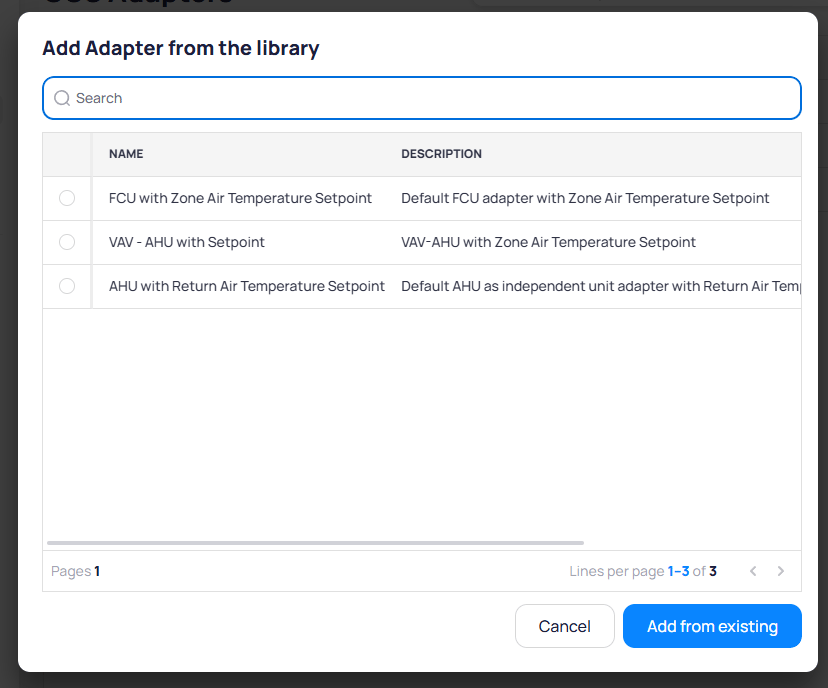
The adapter library lists pre-built templates for common HVAC configurations
Add from existing. Steps one and two of the adapter creation process are prefilled from the template. You can modify any prefilled values before saving.
Edit or delete an adapter
To edit an adapter, click the pencil icon next to the schedule name on the OSS page. The Add/remove devices dialog opens, where you can select or deselect devices for the adapter.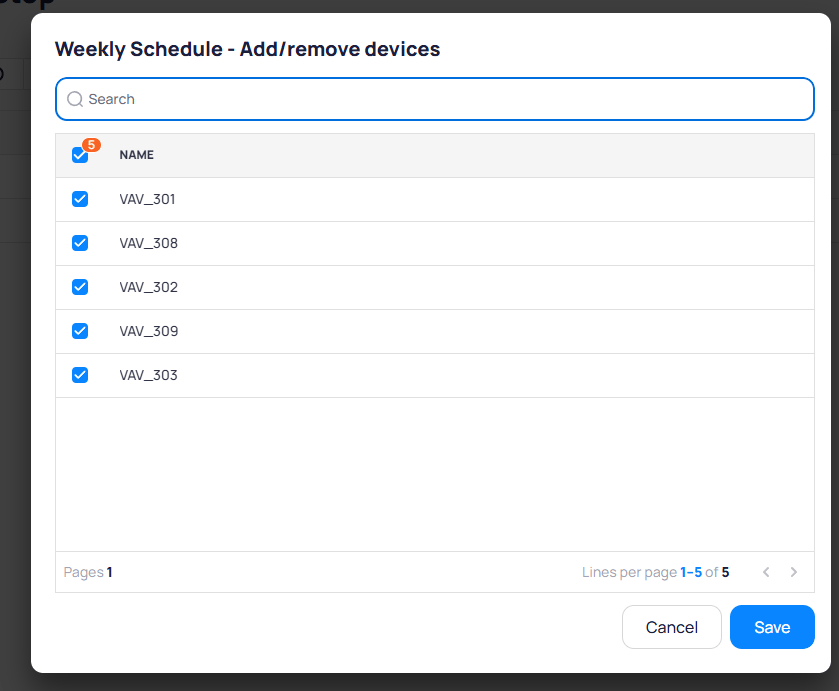
The Add/remove devices dialog lets you select which devices to include in the adapter
Schedule best practices for OSS
When OSS is active, the schedule start time represents the target satisfaction time (when the space should be at the setpoint), not the equipment start time. OSS handles the actual start time calculation. For example, if an office building has occupancy from 08:30 to 17:30, set the schedule start time to 08:30. OSS calculates the optimal equipment start time so that the building reaches the target temperature by 08:30.Schedule configuration guidelines
Schedule configuration guidelines
- Set the schedule start time to the desired occupancy start
- Ensure each device has its own independent schedule
- Turn off any BAS logic that automatically enables downstream devices when a parent device starts
- Schedules where starting an AHU automatically enables its connected VAVs
- Cascaded schedules where one schedule triggers another
- Enum schedules with point mappers or switches that control devices
Key behaviors and limits
- OSS requires a schedule to be in place. Without a schedule, OSS cannot override equipment.
- If a device is already in occupancy override, OSS does not make additional changes.
- If the predicted start time is less than five minutes before the schedule start, the device follows its original schedule.
- If a device is already at the setpoint, OSS does not override it.
- Devices that are occupied 24/7 cannot be controlled by OSS.
- OSS does not operate with schedules that start between 12:00 AM and 3:00 AM. For best results, schedules should start no earlier than 3:00 AM. If a schedule starts at 2:00 AM and OSS predicts a three-hour duration, it may override the device at 2:00 AM, which can lead to accuracy issues.
Ongoing operations
End user guidance
To ensure smooth building operations with OSS:- Initial rollout — adjust schedules to reflect target occupancy times, set proper temperature and equipment setpoints, and verify lease start and end dates
- Daily monitoring — check your inbox for recommended building startup emails from OSS
- Dashboard review — review the Daily OSS Dashboard regularly to confirm comfort goals are met, and use the Historical OSS Dashboard to identify outliers and address poor-performing devices or systems
Deployment checklist
Before activating OSS, verify the following:- Schedules are configured in Cloud BMS with proper AHU references
- VAV devices have Zone Air Temperature Sensor, Zone Air Temperature Setpoints, and
isFedByreferences to their parent AHU - AHU devices include a writable
Occupied Modepoint - Adapters are configured based on the correct Zone Temperature Setpoint type
- Users are trained on schedule adjustments, the OSS algorithm behavior, the control strategy, and dashboard interpretation
Verify OSS overrides
When OSS overrides a point, the point’s activity log records the action withOSS App as the user and Oss Start as the reason. The log entry shows the priority levels and current values at each level, along with the override duration.
Command actions and priority levels
Cloud BMS uses a BACnet-inspired priority model for writable points. The same command dialog appears for BACnet and non-BACnet integrations, such as REST API thermostats. How each action maps on the device depends on the connector.BACnet points that accept commands have 16 priority levels (1 is highest, 16 is lowest). When every level is empty (null), the point uses a fallback / default value (Relinquish_Default in BACnet). That fallback is not a 17th BACnet priority. Some interfaces label it as level 17 for display only.Override and Set turn different knobs under the hood, even when the visible value looks the same.Override, Auto, and Set borrow Niagara-style action names. Release is a Cloud BMS action that clears a Set.In Niagara-style control, Set keeps a non-null fallback so sequences and logic keep a reliable baseline. Use the priority array (including Override) for programmed automation and temporary exceptions.To make Set write to priority 16 instead of the fallback or default, enable Set in Slot16 (Niagara) on the point. Configure that option from device details, device templates, or points batch update.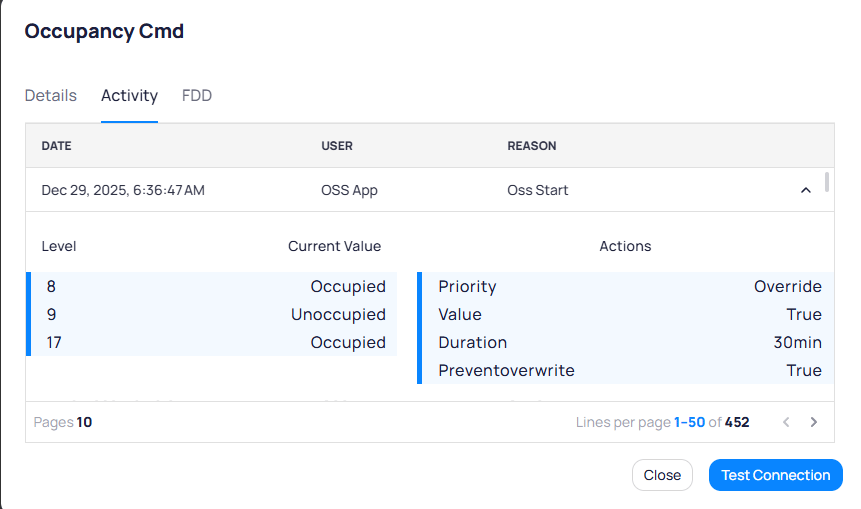
The point activity log shows OSS override details including priority levels, values, and duration
Test Connection to verify the point connection to the data source.
OSS dashboard
The OSS dashboard monitors device performance and optimization results through Building BI. Once the OSS adapter is activated, all dashboard calculations are enabled automatically except for the Hours Saved metric, which requires manual data submission. The dashboard shows data only for devices configured with OSS that were running for the specified day or time period. Two dashboard templates are available in Building BI:- OSS Dashboard [AHU-VAV] — for setups with parent-child devices (for example, AHU-VAV). Includes an AHU Startup Details table on the Current Day page.
- OSS Dashboard [FCU] — for individual devices (for example, FCU, AHU, or VAV alone). Replaces the AHU Startup Details table with a Weather Widget.
Key metrics
- Comfort Index (CI) — the difference between the temperature setpoint and the actual zone temperature at occupancy start (when people arrive)
- Recovery Temperature (RT) — the difference between the temperature setpoint and the zone temperature at device OSS start (when OSS starts the device)
- Hours Saved — total runtime hours saved compared to the pre-OSS schedule (requires manual data submission)
Current Day
The Current Day page is updated every hour and provides an overview of devices configured with OSS for the current day. The top cards display key metrics at a glance. The FCU template replaces the AHU Startup Details table with a Weather Widget showing current conditions and a seven-day forecast.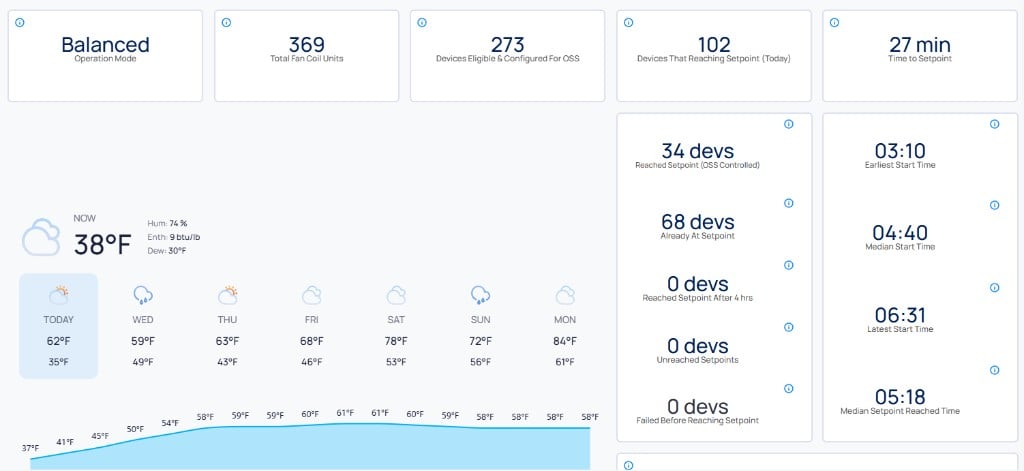
The FCU dashboard shows operation mode, total devices, devices eligible for OSS, devices reaching setpoint, time to setpoint, weather conditions, and start time statistics
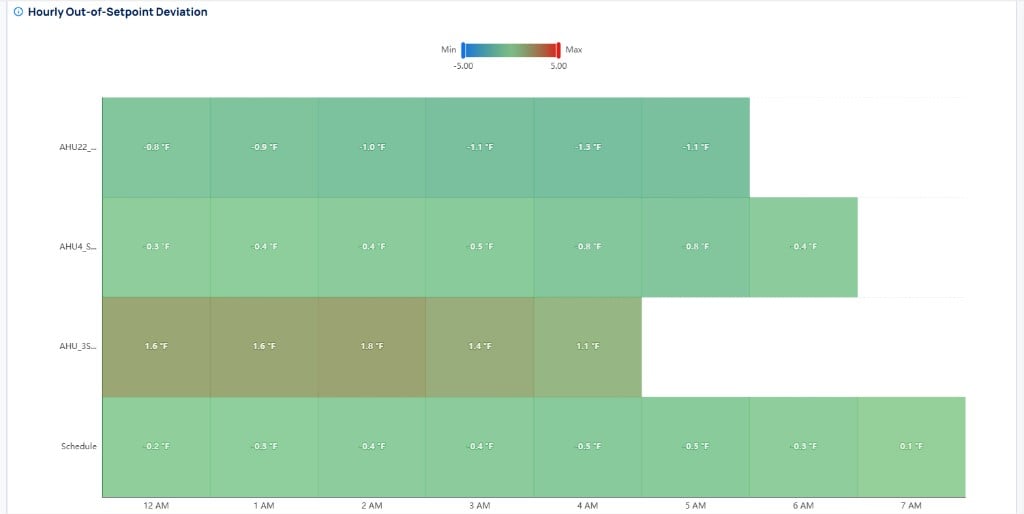
The heatmap shows hourly setpoint deviation per schedule with degree values, ranging from blue (below setpoint) to green (on target) to red (above setpoint)
Scheduler and Device Filter dropdowns to narrow down the view.
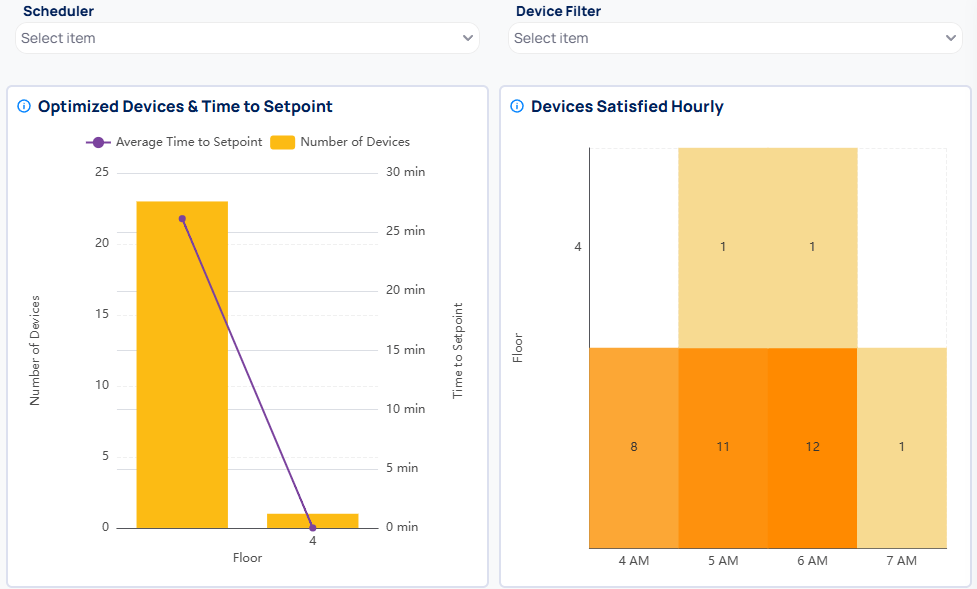
The bar chart shows optimized device counts per floor with a time to setpoint trend line, and the heatmap shows hourly satisfaction rates
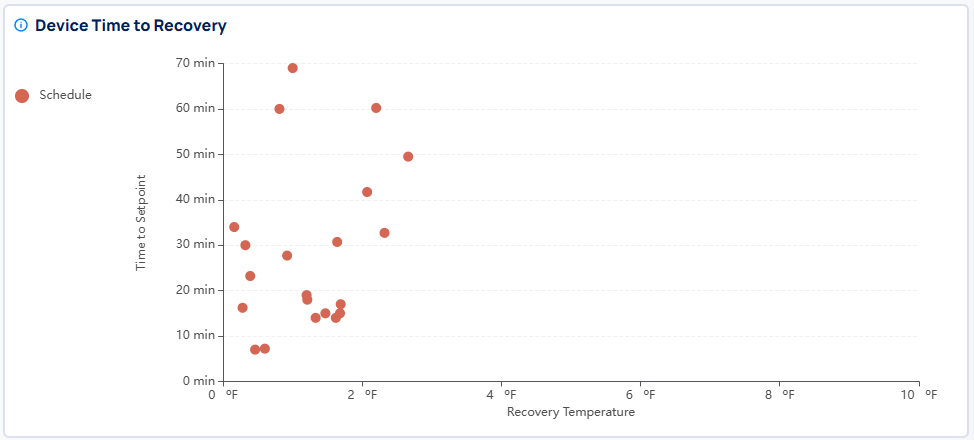
The scatter plot shows each device's recovery temperature versus time to setpoint, helping identify outliers
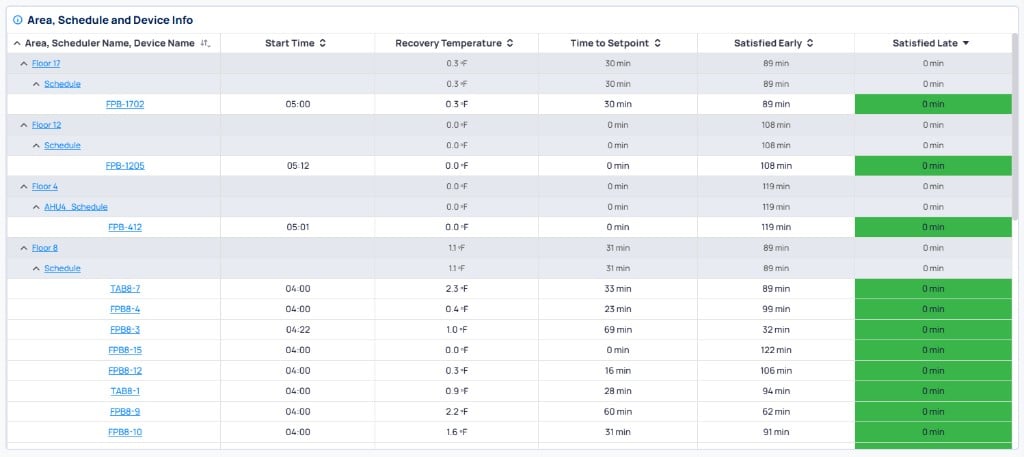
The hierarchical table shows device-level metrics grouped by floor and schedule, with green color-coded satisfaction timing
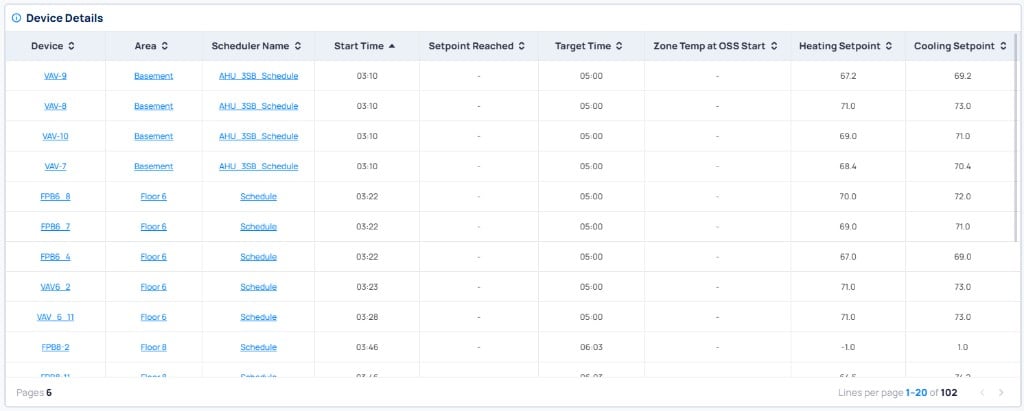
The device details table shows individual device data with start times, setpoint values, and zone temperatures at OSS start
Historical
The Historical page is updated every hour and provides long-term performance data over a selected time period. Use this page to track OSS performance trends and identify devices that consistently underperform.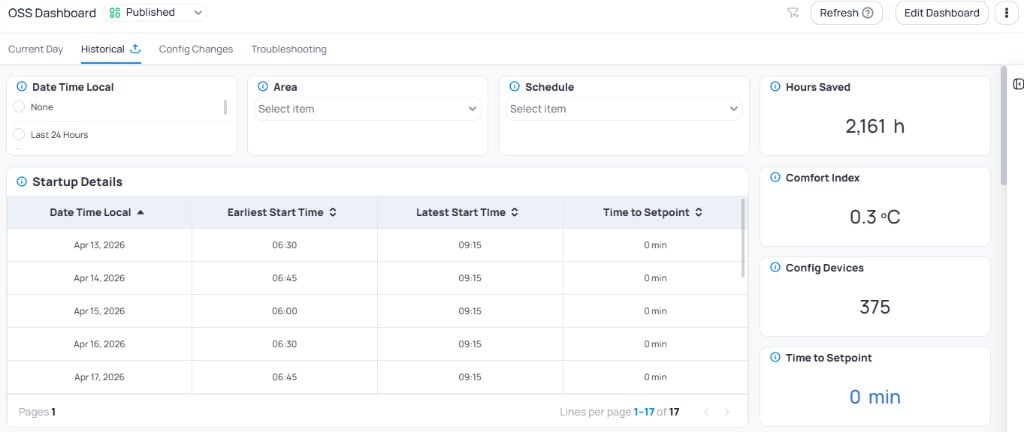
The Historical page shows filters, hours saved, comfort index, and startup details over a configurable date range
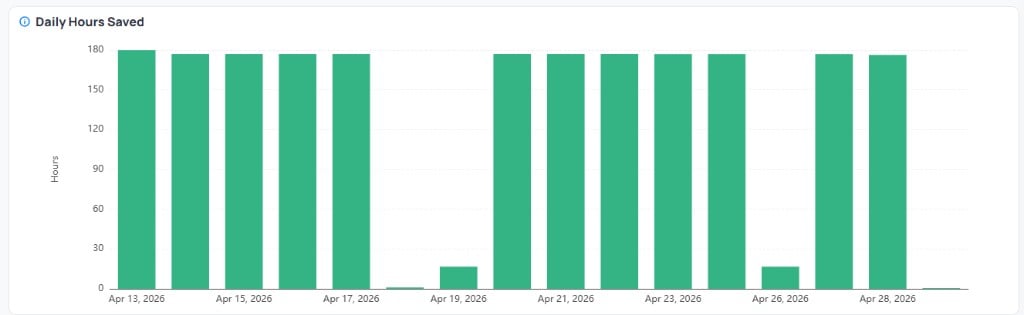
Daily Hours Saved shows runtime savings per day, while Number of Optimized Devices tracks daily optimization counts
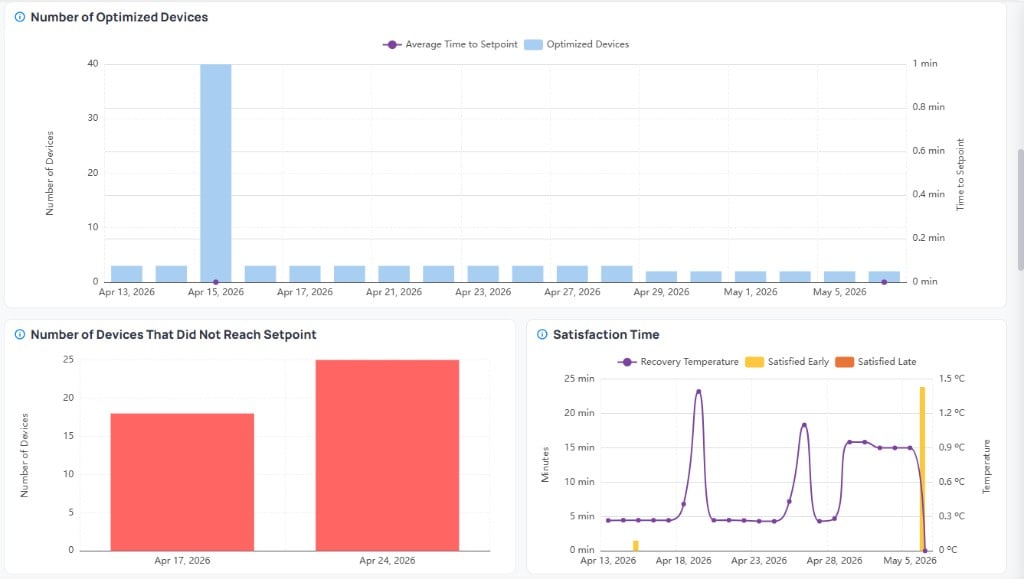
Devices that did not reach setpoint and satisfaction timing trends help identify performance issues over time
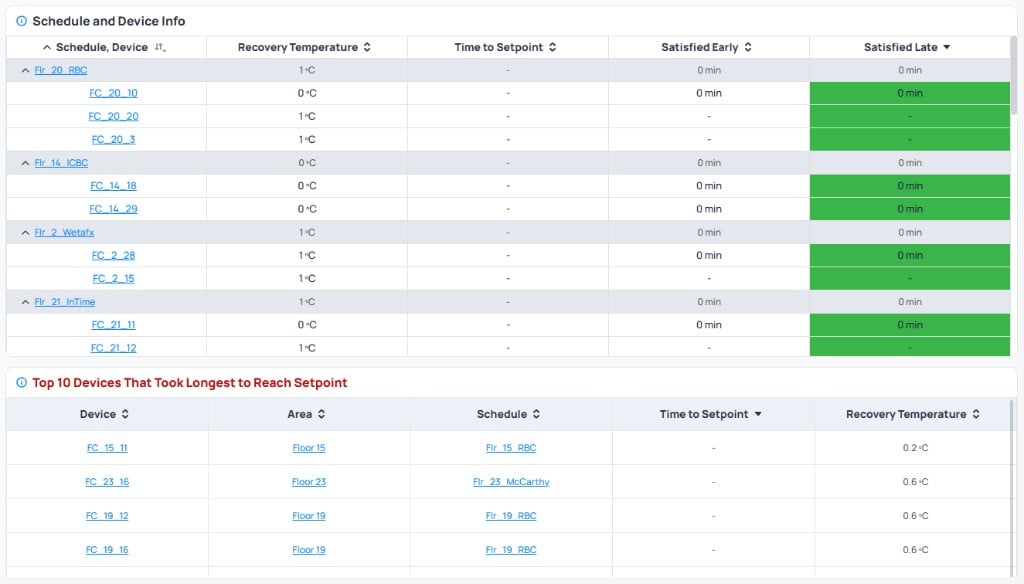
The schedule/device table and top 10 slowest devices table help identify underperforming equipment
Hours Saved metric
The Hours Saved metric is not calculated automatically. Submit a data sheet to KODE support at support@kodelabs.com with the following fields for each schedule:- Building Name — the name of the building
- Schedule Name — the scheduler name in Cloud BMS
- Day of Week — the day of the week (Monday through Saturday)
- Space Entry Time — the expected occupant arrival time used to benchmark target comfort time
- Pre-OSS Start Time — the typical scheduled HVAC start time before OSS activation
Config Changes
The Config Changes page is updated daily. It tracks changes to configured devices that may have made them incompatible with OSS. The top cards show Compatible Devices, Active Configs, Inactive Configs, Expired Configs, and Adapters Affected. The Detected Change Type chart and Expired Configs Per Adapter chart help identify which changes are causing incompatibility.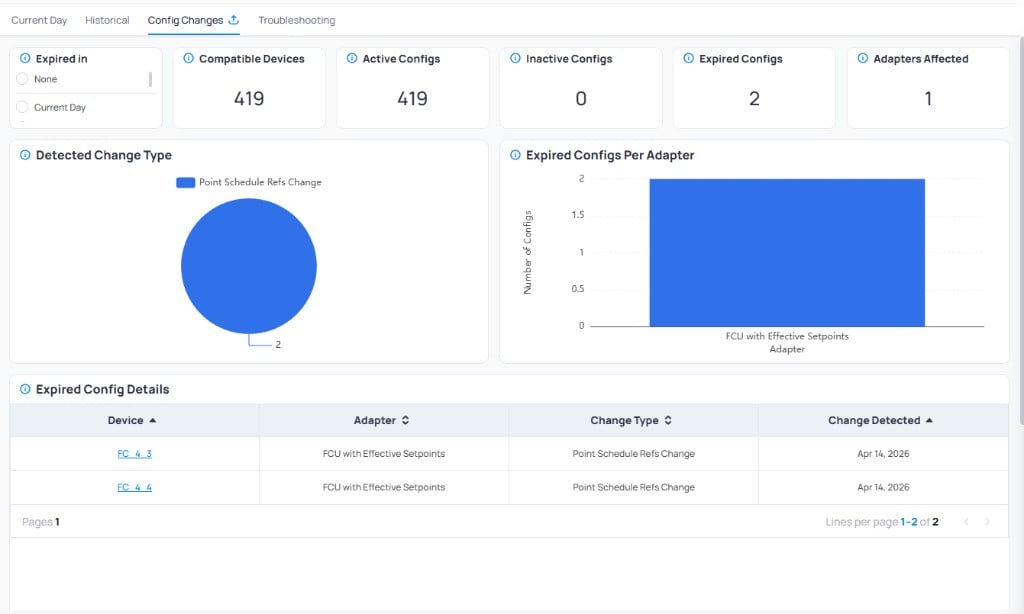
The Config Changes page shows expired configs, change types, and affected adapters with device-level details
Troubleshooting
The Troubleshooting page is updated every hour. It displays overrides made by OSS on configured devices. Filter byDate Time Local, Override Status, and Canonical Type to narrow down specific issues. The top cards show Devices Overridden and Issues counts.
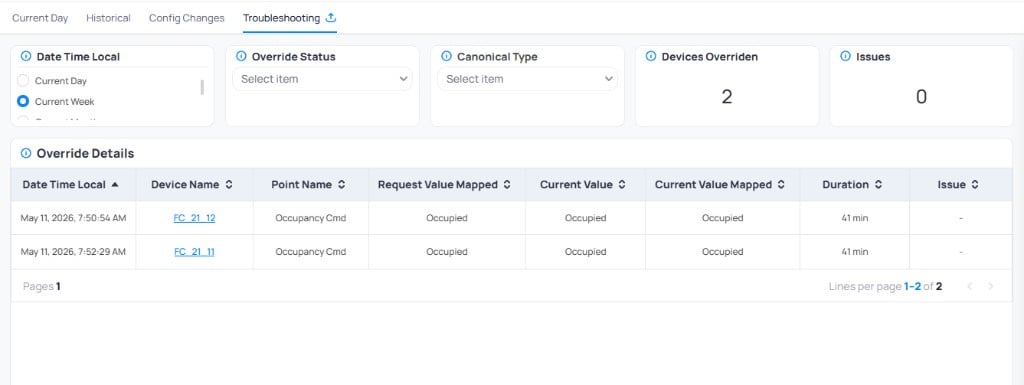
The Troubleshooting page shows OSS override details with device name, point, requested and current values, duration, and any issues