

Navigate to a floor plan
Select your site
Sites in the left navigation bar and select the building.Open areas
Areas in the left sidebar menu. Select a floor from the area list.View the floor plan
Interact with devices on the floor plan
Each device appears as a marker on the floor plan with its current value displayed. Devices are color-coded by status:- Green means the device is online and operating normally
- Red means the device has an active alarm
- Grey means the device is offline
Command actions and priority levels
Cloud BMS uses a BACnet-inspired priority model for writable points. The same command dialog appears for BACnet and non-BACnet integrations, such as REST API thermostats. How each action maps on the device depends on the connector.BACnet points that accept commands have 16 priority levels (1 is highest, 16 is lowest). When every level is empty (null), the point uses a fallback / default value (Relinquish_Default in BACnet). That fallback is not a 17th BACnet priority. Some interfaces label it as level 17 for display only.Override and Set turn different knobs under the hood, even when the visible value looks the same.Override, Auto, and Set borrow Niagara-style action names. Release is a Cloud BMS action that clears a Set.In Niagara-style control, Set keeps a non-null fallback so sequences and logic keep a reliable baseline. Use the priority array (including Override) for programmed automation and temporary exceptions.To make Set write to priority 16 instead of the fallback or default, enable Set in Slot16 (Niagara) on the point. Configure that option from device details, device templates, or points batch update.Create a floor plan graphic
Before creating a floor plan graphic, make sure you have created an area in the Areas module. The graphic must be linked to an existing area. Navigate toGraphics in the left sidebar and select the Floor Plans tab. Click New Graphic and select the area to link the graphic to. You can also create a floor plan from within an area by opening the area dashboard and adding a graphic widget.
Place devices on floor plans
Enter edit mode
Edit.Select a layer
Drag devices onto the plan
Devices tab on the left panel, drag equipment onto the floor plan at their physical locations. Zoom in for precise placement.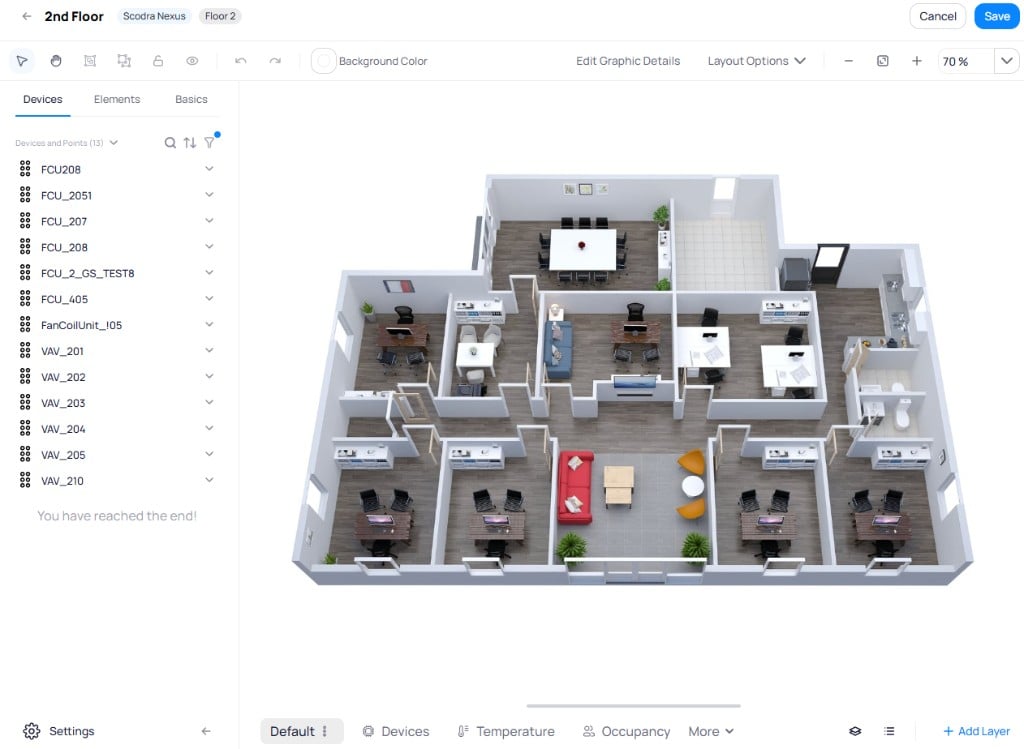
The Devices tab lists all devices and points available for the selected area
Use auto-suggest
Auto Suggest in the upper right corner. Cloud BMS maps the temperature points to the placed devices.Save the placement
Save to finalize the device placement.Smart markers
Smart markers provide dynamic, color-coded visualizations based on live point values. Instead of showing a static icon, smart markers change their appearance as values enter different ranges.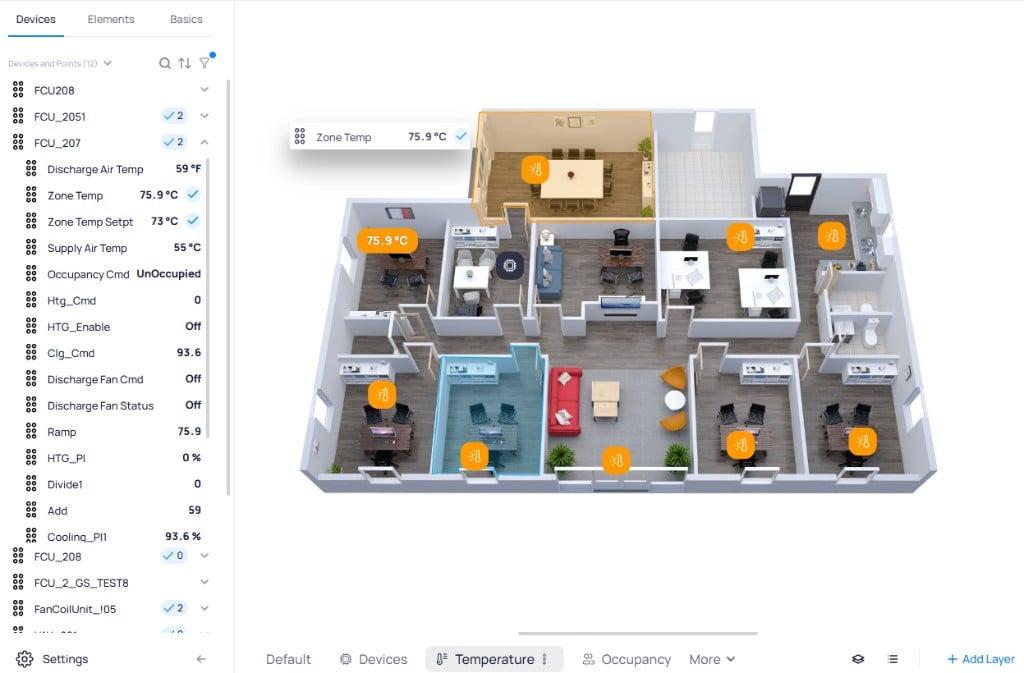
Smart markers on the Temperature layer display live temperature readings with color coding
- Icon only — the marker displays as a colored icon reflecting the current value range
- Value only — the marker displays the numeric value with color coding
- Icon and value — the marker displays both the icon and the value
Difference from setpoint smart markers
These smart markers change appearance based on how far the current value is from the device’s setpoint. This is useful for quickly identifying zones that are not achieving their target temperature.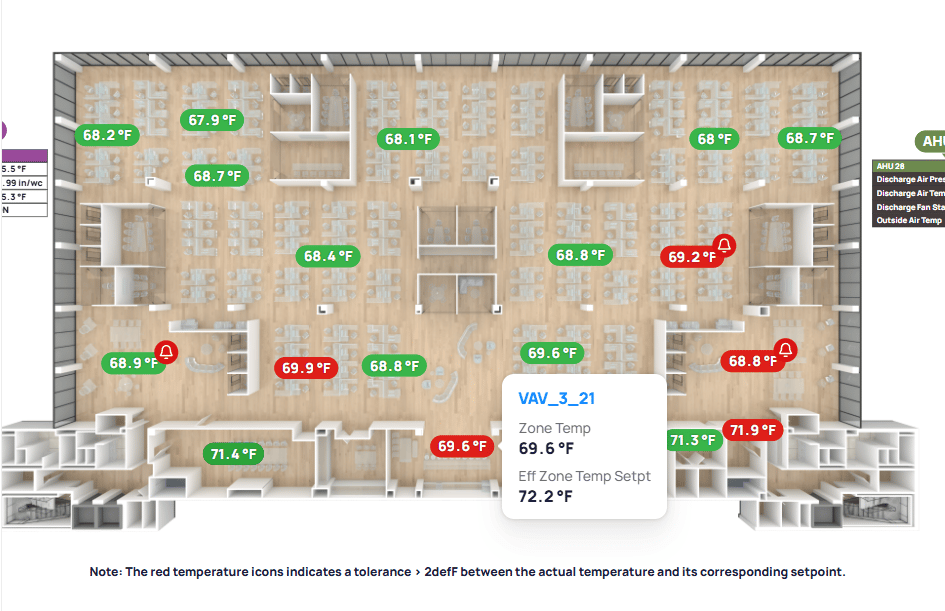
Green markers indicate values within tolerance. Red markers exceed tolerance. The bell icon signals an active FDD alarm.
- Green markers indicate the current value is within the configured tolerance of the setpoint
- Red markers indicate the value has drifted beyond the tolerated deviation
- The bell icon on a marker indicates that the point has an active alarm generated by FDD
- Hovering over a marker reveals the device name, current value, and effective setpoint
- Supports dual setpoints for heating and cooling modes
Tables in graphics
Table views list point values from devices directly within floor plan graphics. Drag the Device Table widget from theBasics tab onto the canvas to create a table.
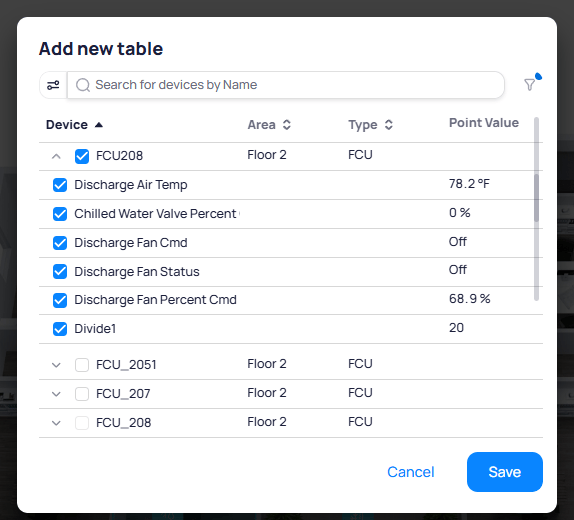
Select a device and check the points you want to display in the table
Save. The table appears as a single element on the graphic that you can move and resize.
Zone drawings and control
Zone drawings define colored regions on a floor plan that change appearance based on live device data. Click the Zone Tool widget from theBasics tab, then click on the floor plan to draw the zone outline. Each click places a point that defines a start and end line of the zone boundary. Close the shape to complete the zone.
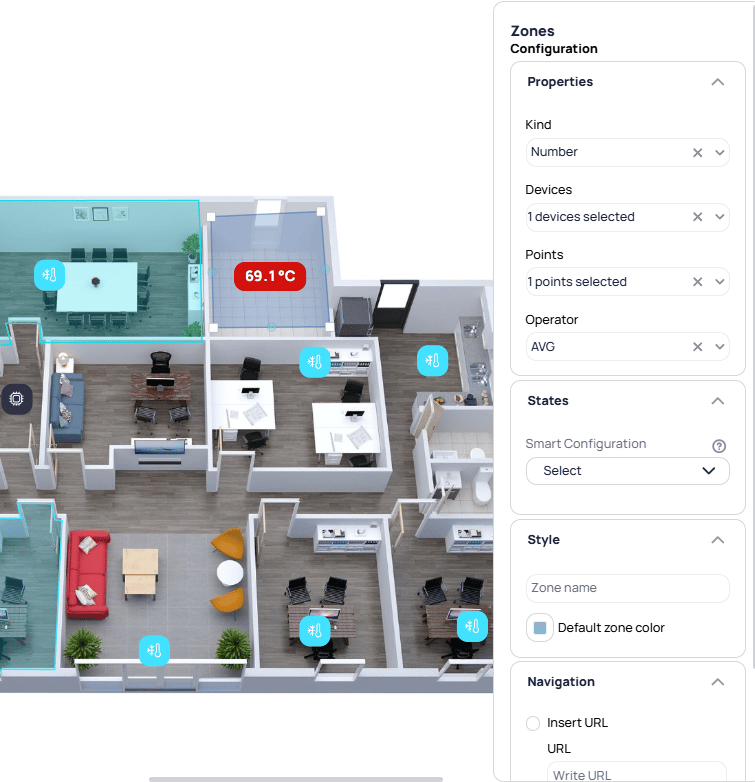
The Zones Configuration panel defines the zone's data source, states, style, and navigation behavior
- Properties — select the data type (
NumberorString/Boolean), controlling devices, the common point, and the aggregation operator (AVG,MIN,MAX,SUM,MEDfor numeric points;ANDorORfor boolean/enum points) - States — define value ranges with corresponding colors. Select a
Smart Configurationor create custom ranges manually.
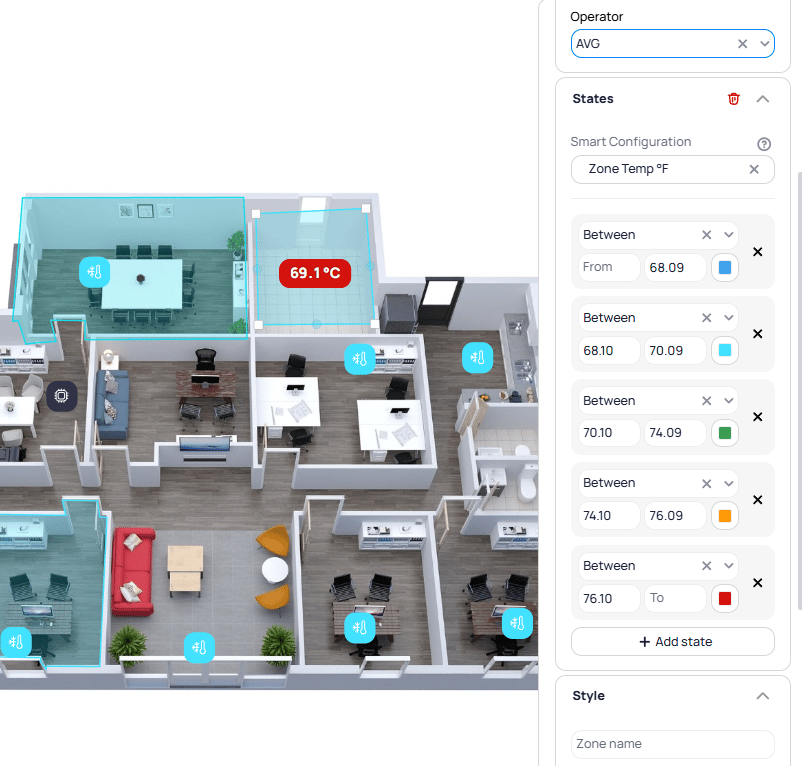
Each state maps a value range to a color. The zone changes color as the aggregated value moves between ranges.
- Style — set the zone name and default zone color
- Navigation — link the zone to a URL or a Cloud BMS device, area, or system
Hover-over markers
Hover-over markers allow you to reference multiple points on a single marker while showing only one value by default. The additional points appear when the user hovers over the marker.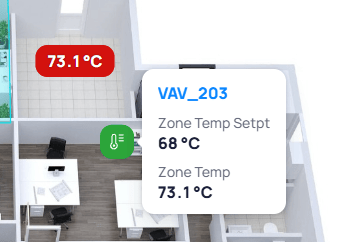
Hovering over a smart marker reveals the device name and additional point values
- Works with both smart markers and default markers
- Marker headers and labels can be hidden until hover
- When used with smart markers, hovering shows the device name with a link to navigate to device details
Point statuses and states
Markers on floor plans display real-time status indicators next to point values:Layers and overlays
Layers organize a floor plan graphic into multiple views. Each layer displays its own set of markers, tables, and points. Switch between layers using the tabs in the bottom toolbar.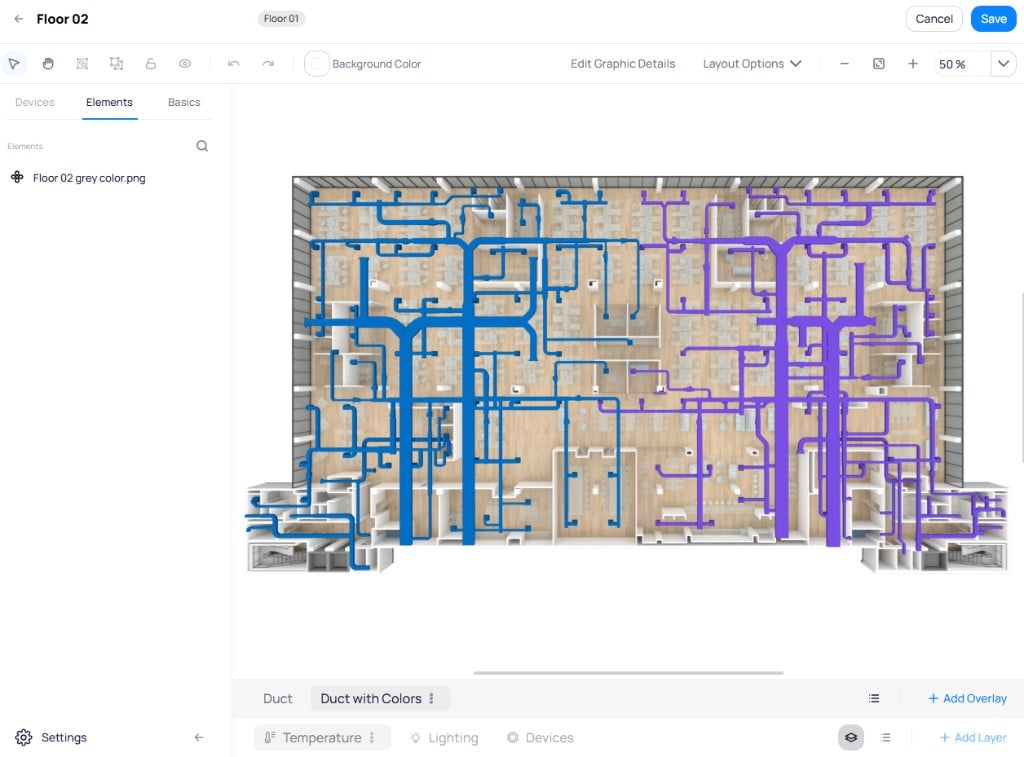
A duct overlay rendered on top of a floor plan, showing supply and return duct paths in separate colors
Filter the floor plan
Use the system type tabs at the top of the floor plan view to filter visible devices:- HVAC shows temperature devices, AHUs, VAVs, and related equipment
- Lighting shows lighting controllers and fixtures
- Fire Detection shows smoke detectors, pull stations, and alarm panels
- Icons toggles between value labels and icon-based display for dense floors
- Legend shows or hides the icon legend