

Use cases
System graphics are commonly used for:- AHU schematics showing airflow paths, damper positions, fan speeds, and temperature readings
- Chiller plant diagrams displaying chiller status, pump operation, and water temperatures
- Electrical one-line diagrams with live power readings and breaker status
- Boiler system layouts with supply and return temperatures, valve positions, and firing status
Navigate to system graphics
You can access system graphics from two entry points:- Graphics module — click
Graphicsin the left sidebar and select theSystemstab to view existing system graphics - Systems module — click
Systemsin the left sidebar, select a system, and switch to the Graphics view
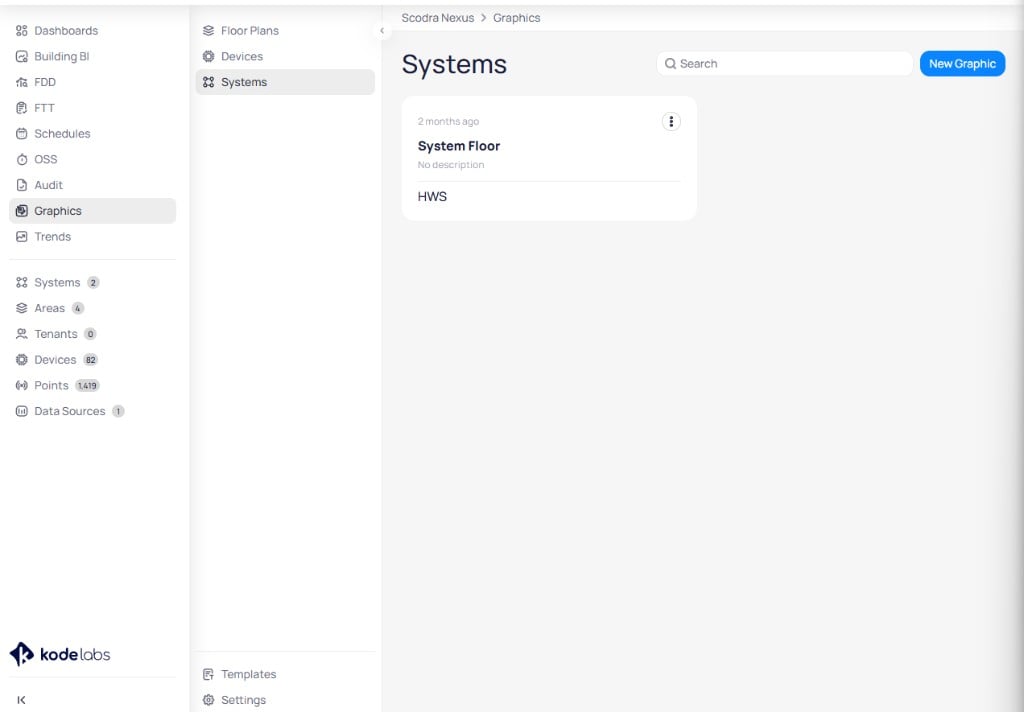
The Graphics module Systems tab lists existing system graphics with options to search and create new ones
Create a system graphic
Before creating a system graphic, make sure you have created a system in the Systems module. The graphic must be linked to an existing system.Open the new graphic dialog
Graphics in the left sidebar, select the Systems tab, and click New Graphic. You can also create a system graphic from within a system by navigating to the Graphics view and clicking + Create New.Configure the graphic details
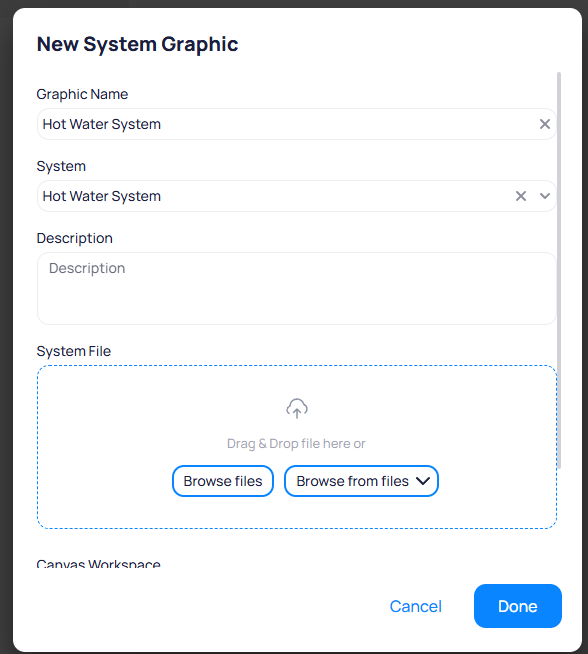
The New System Graphic dialog collects the graphic name, system assignment, description, and an optional system file upload
Hot Water System).Browse files to upload from your computer, or click Browse from files to select from previously uploaded files.Open the Graphic Tool
Done to create the graphic and open it in the Graphic Tool editor.Build the system schematic
The Graphic Tool editor provides three tabs for building system graphics: Devices, Elements, and Basics.Devices tab
TheDevices tab lists all devices and points associated with the linked system. A green checkmark with a number indicates how many points from that device are already placed on the graphic.
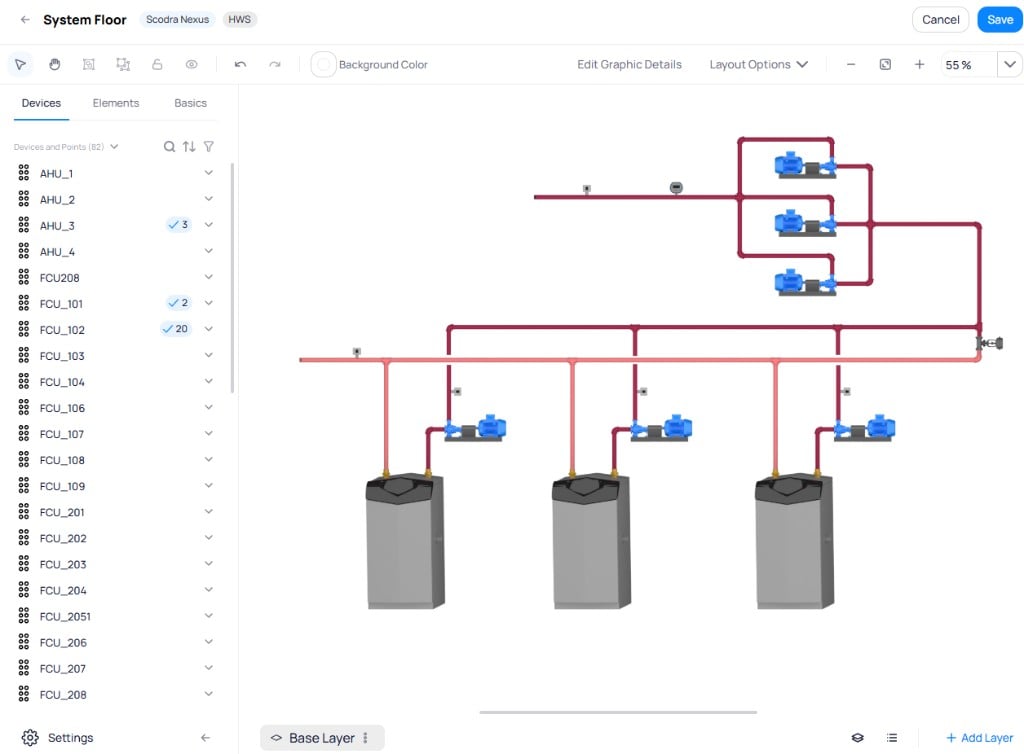
The Devices tab shows system devices with their points, and the canvas displays the system schematic
Marker style
When you select a placed marker, the right panel displays style options for customizing its appearance.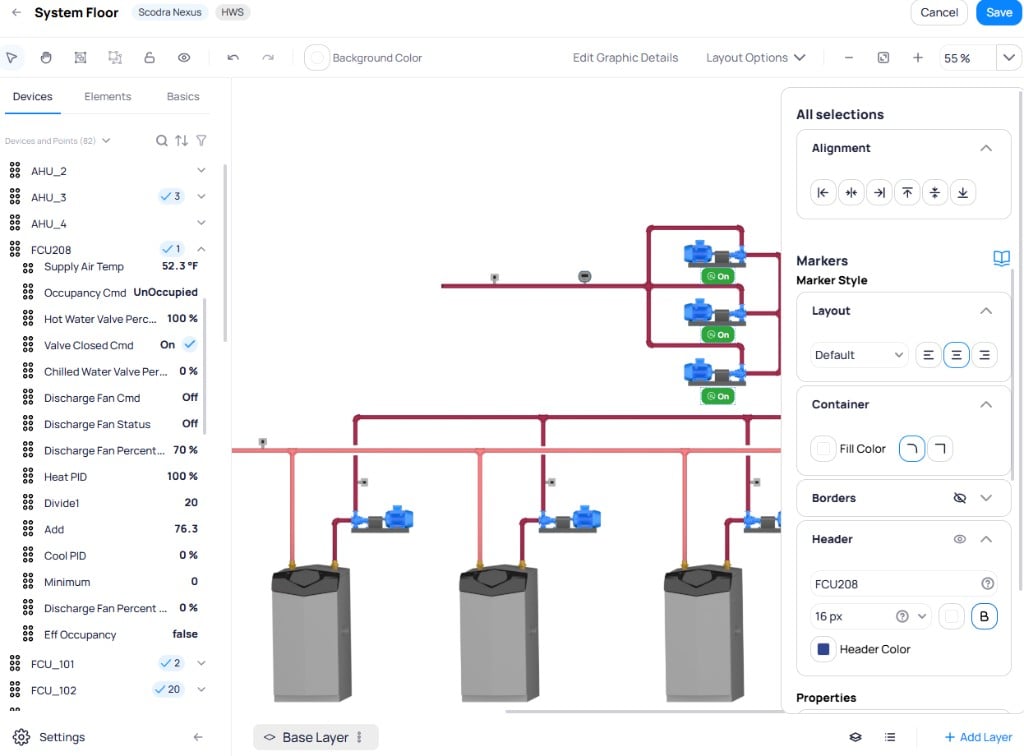
Selecting a marker reveals alignment, layout, container, border, and header styling options in the right panel
- Alignment — position the marker relative to other selected elements
- Layout — choose the display layout (Default, or horizontal/vertical alignment options)
- Container — set the fill color and choose rounded or square corners
- Borders — toggle border visibility and style
- Header — show or hide the device name header, set font size, and customize the header color
Elements tab
TheElements tab displays reusable elements that have been saved to the graphic’s element library. Use this tab to search, select, and style placed elements. Selecting an element from the list highlights it on the canvas and opens the Marker Style panel on the right.
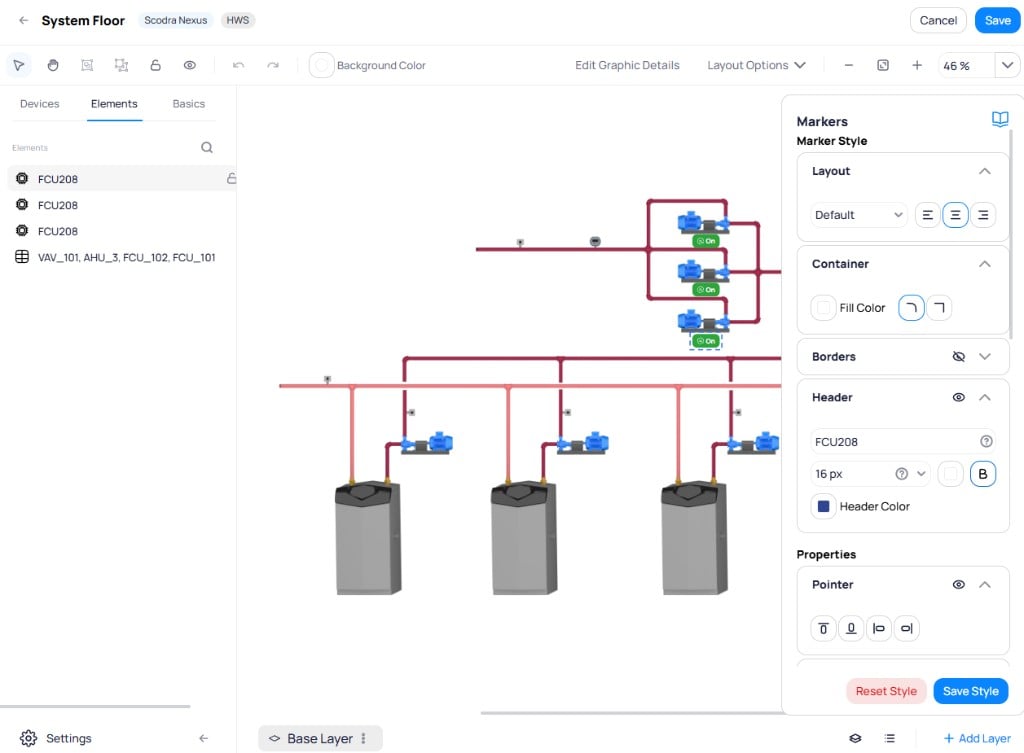
The Elements tab lists placed elements with options to search and style them using the Marker Style panel
Basics tab
TheBasics tab contains shapes, device widgets, uploads, and built-in drawings for constructing system schematics.
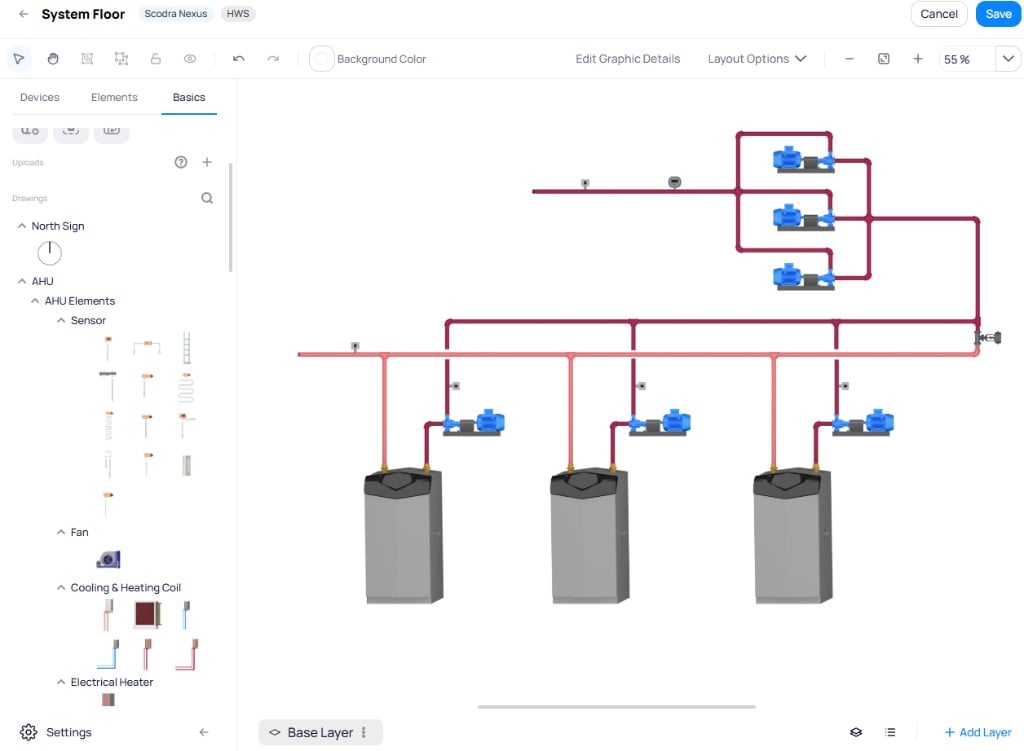
The Basics tab provides built-in drawing components organized by equipment category
Drawings section contains pre-built equipment components organized by category:
- North Sign — directional indicator
- AHU — air handling unit elements including sensors, fans, cooling and heating coils, and electrical heaters
- Additional equipment categories for valves, pipes, pumps, and other system parts
System layers
Layers organize the system graphic into multiple views, reducing clutter on complex schematics. Click+ Add Layer at the bottom right of the canvas to create a new layer.
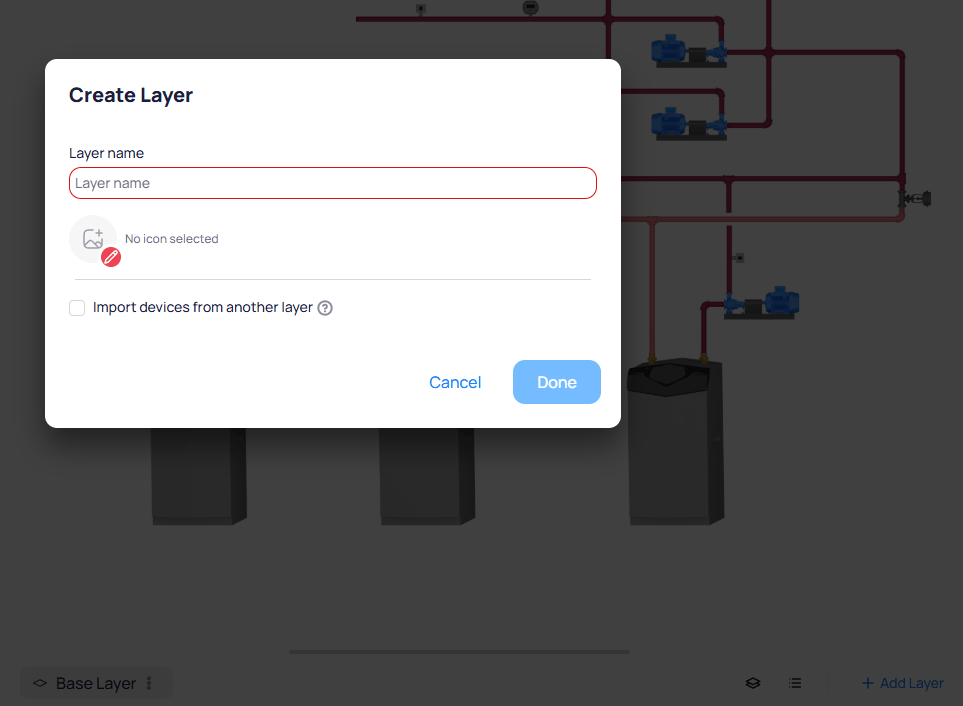
The Create Layer dialog lets you name the layer, assign an icon, and optionally import devices from another layer
- The Base Layer shows critical operating parameters
- Additional layers contain supplementary data, tables, system markers linking to related systems, and diagnostic points
Overlays
Overlays are additional visual layers that you can toggle on and off over the system graphic. Use overlays to display supplementary information such as duct routes, piping paths, or wiring diagrams without cluttering the main schematic. Click+ Add Overlay at the bottom right of the canvas to create an overlay.
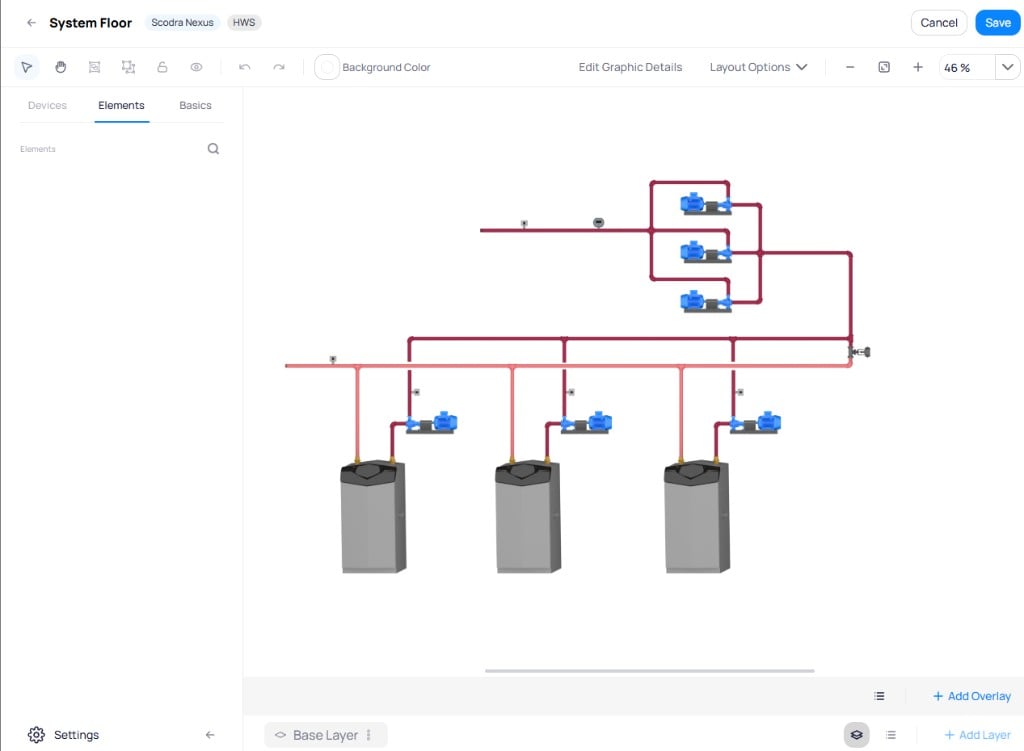
The canvas bottom bar shows the Base Layer selector alongside Add Layer and Add Overlay options
System markers
System markers act as navigation links between system graphics. They allow users to jump between related schematics or navigate from a floor plan directly to a system graphic. While editing a graphic, switch fromDevices to Systems in the left-hand elements menu. Drag and drop a system onto the canvas to create a clickable navigation marker.
Read live data on a system graphic
System graphics overlay real-time point values directly on the schematic:- Temperature readings near corresponding sensors
- Valve positions as percentage values next to valve symbols
- Fan and pump status indicators showing running, stopped, or fault states
- Pressure and flow readings at their measurement locations
Identify alarms and faults
Devices and points on the system graphic use color-coded status indicators:Command actions and priority levels
Cloud BMS uses a BACnet-inspired priority model for writable points. The same command dialog appears for BACnet and non-BACnet integrations, such as REST API thermostats. How each action maps on the device depends on the connector.BACnet points that accept commands have 16 priority levels (1 is highest, 16 is lowest). When every level is empty (null), the point uses a fallback / default value (Relinquish_Default in BACnet). That fallback is not a 17th BACnet priority. Some interfaces label it as level 17 for display only.Override and Set turn different knobs under the hood, even when the visible value looks the same.Override, Auto, and Set borrow Niagara-style action names. Release is a Cloud BMS action that clears a Set.In Niagara-style control, Set keeps a non-null fallback so sequences and logic keep a reliable baseline. Use the priority array (including Override) for programmed automation and temporary exceptions.To make Set write to priority 16 instead of the fallback or default, enable Set in Slot16 (Niagara) on the point. Configure that option from device details, device templates, or points batch update.Delete a system graphic
To remove a system graphic, click the three-dot menu on the graphic card in the Systems list and selectDelete.
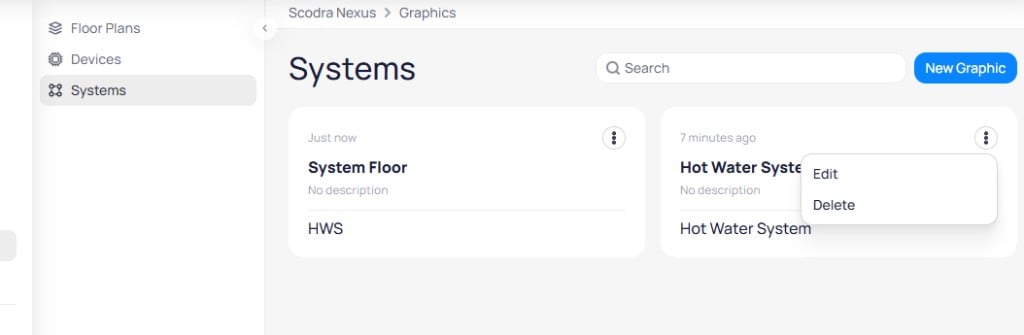
The three-dot menu on each graphic card provides Edit and Delete options
Yes, delete.
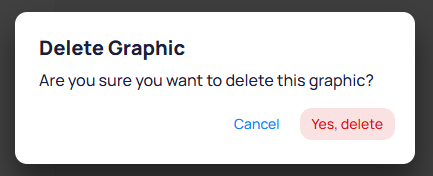
The confirmation dialog asks you to verify before deleting the graphic