

Dashboard views
The building dashboard includes four views. Select a tab at the top of the page to change the analysis:- Operations — Work order status, team and assignee workload, creation patterns, and SLA performance
- Time analysis — Logged hours, estimated versus actual time, and response and completion targets
- Forecast — Upcoming scheduled work for the building
- Historical trends — Volume, completion rate, and time-to-close trends over time
Filter the dashboard
Use the filter bar to narrow results for the selected building. Filters apply across Operations, Time analysis, Forecast, and Historical trends so KPIs and charts stay aligned. Available filters vary by view but commonly include:- Created date — Date range for work included in the charts (for example, last 30 days)
- Team — One or more teams at the building
- Assignee — Individual staff members
- Work type — Maintenance program (preventive maintenance, inspections, corrective maintenance, service requests)
- Category — Category assigned to work orders
Overdue Only
Enable Overdue Only on the Operations dashboard to recalculate every KPI and chart for overdue work only. Overdue is a work state based on the due date, not a single lifecycle status. The toggle includes overdue work that is still in progress and completed work that was overdue.Operations view
The Operations view summarizes building health with KPI cards, completion rates, and team and assignee workload. Scroll below the workload section for work order creation patterns, category breakdowns, and SLA and priority charts.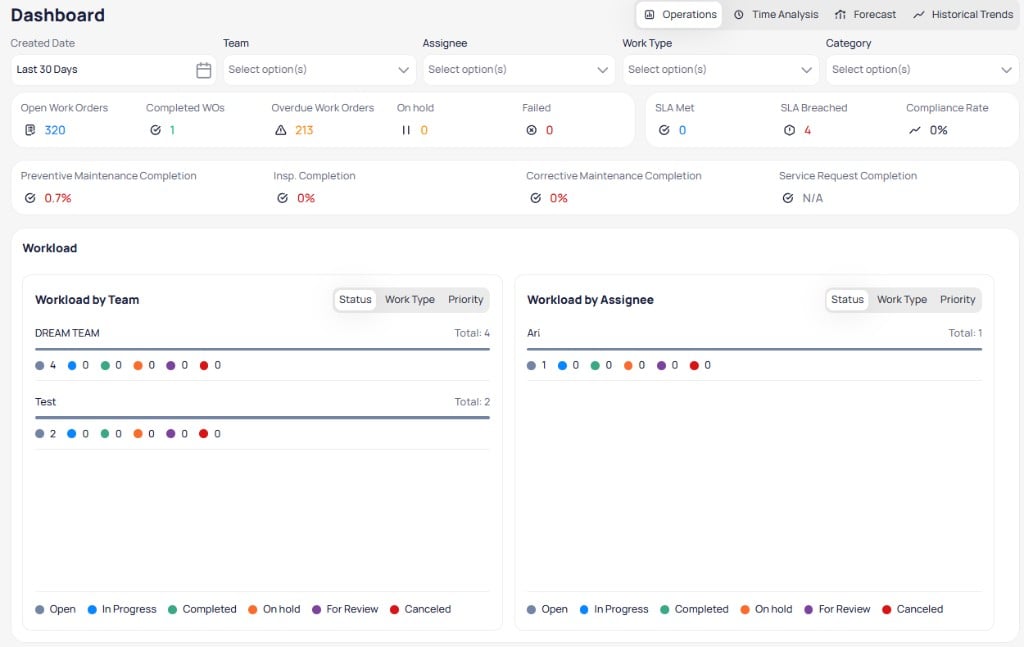
The Operations view shows KPI cards, completion rates, and workload by team and assignee
KPI summary
The top row of cards highlights current work order status and SLA outcomes for the building:Completion rates
Below the KPI row, completion rate tiles show progress by maintenance program, such as preventive maintenance, inspection completion, corrective maintenance, and service requests.Workload by team and assignee
The Workload section shows how open work is distributed. Toggle each panel to view by Status, Work type, or Priority.- Workload by team — Lists each team with total tasks and a bar chart of status distribution (open, in progress, completed, on hold, for review, canceled)
- Workload by assignee — Lists each staff member with the same status breakdown for assigned work
Work order creation patterns
The Work order creation patterns heatmap shows when work orders are created across days of the week and time of day for this building. Darker cells indicate higher volume.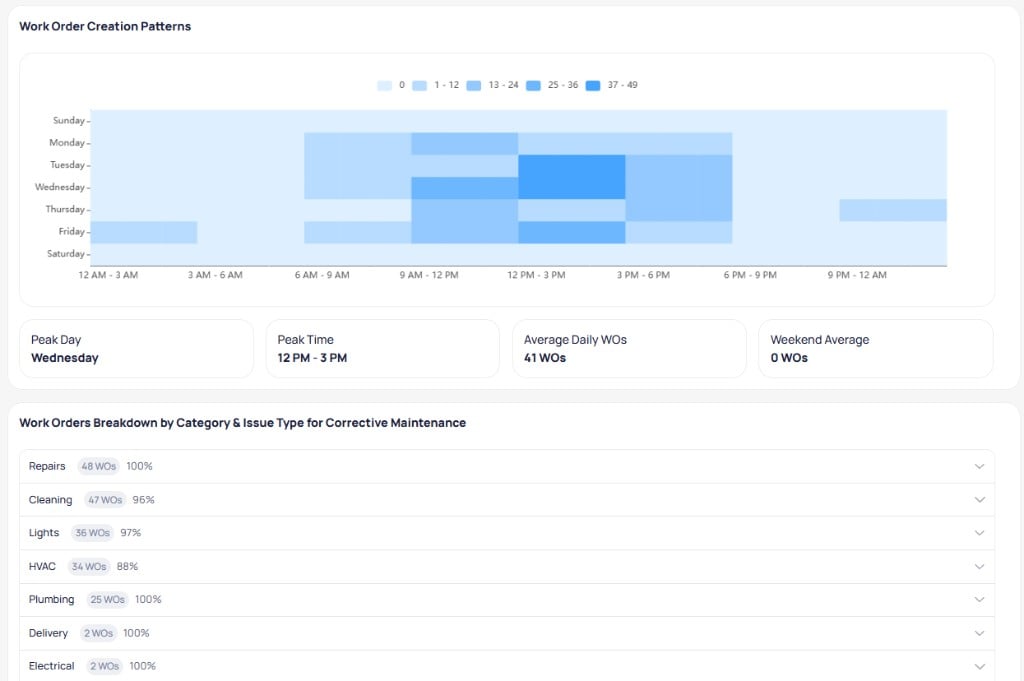
The creation patterns heatmap and corrective maintenance category breakdown for the selected building
Breakdown by category and issue type
The Work orders breakdown by category and issue type for corrective maintenance section lists corrective maintenance volume by category. Expand a category to view issue types within that category.SLA and priority
The SLA and priority section shows how work orders at this building align with SLA targets and assigned priority levels.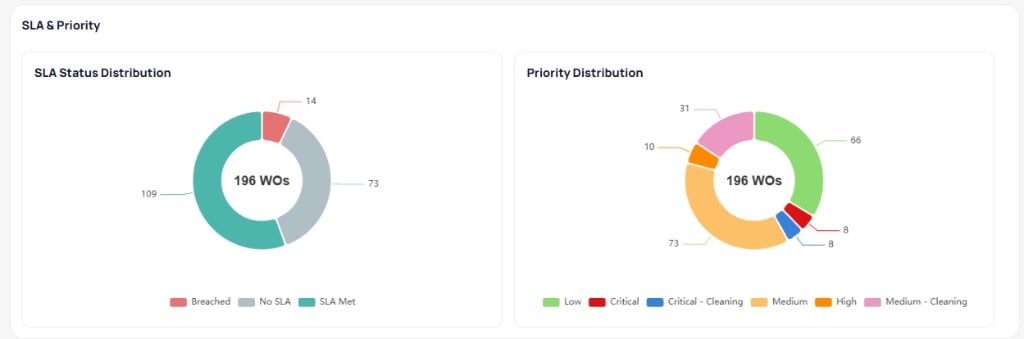
Donut charts compare SLA status and priority distribution for the building
Time analysis view
The Time analysis view tracks labor hours logged against work orders at the building.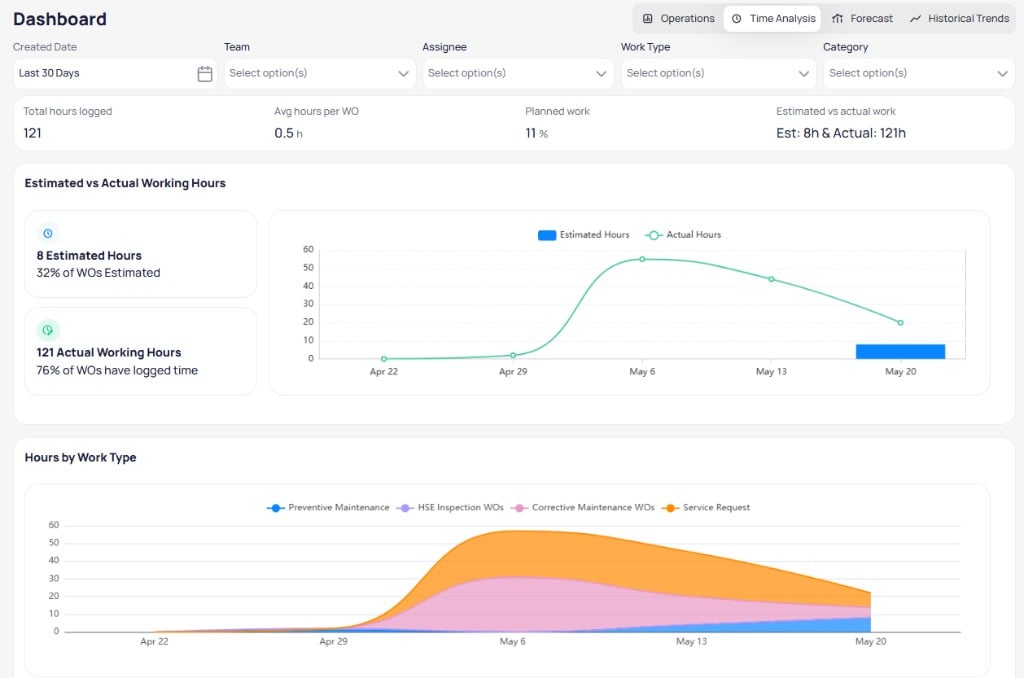
Time analysis shows logged hours, estimated versus actual time, and hours by work type
Summary metrics
The top row typically includes:- Total hours logged — Sum of time entries in the filtered period
- Average hours per work order — Mean logged time per work order
- Planned work — Share of hours tied to planned maintenance programs
- Estimated versus actual work — Comparison of estimated hours to logged hours
Estimated versus actual working hours
This section compares estimated hours on work orders to actual hours logged over time. Summary cards show how many work orders include estimates and how many have logged time.Hours by work type
The Hours by work type chart shows how logged hours distribute across preventive maintenance, inspections, corrective maintenance, and service requests over the selected period.Response, completion, and category hours
Scroll below the charts for additional time analysis tables.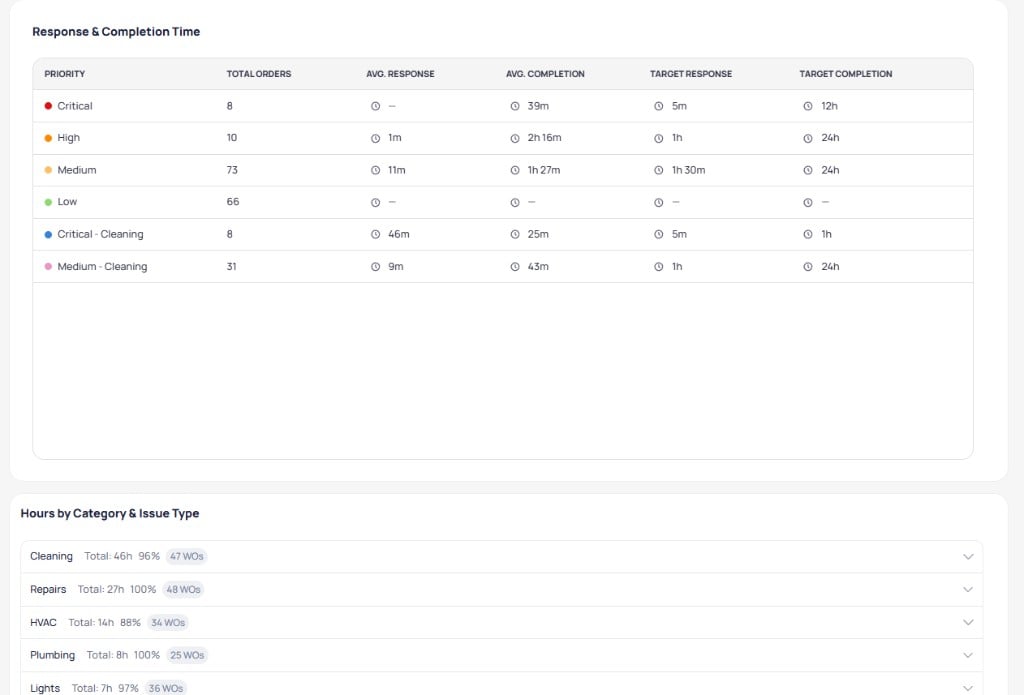
Response and completion targets by priority, with hours summarized by category
- Response and completion time — Lists each priority with total orders, average response and completion times, and target response and completion goals
- Hours by category and issue type — Summarizes logged hours, completion share, and work order count per category; expand rows for issue type detail
Forecast view
The Forecast view projects upcoming scheduled work for the building.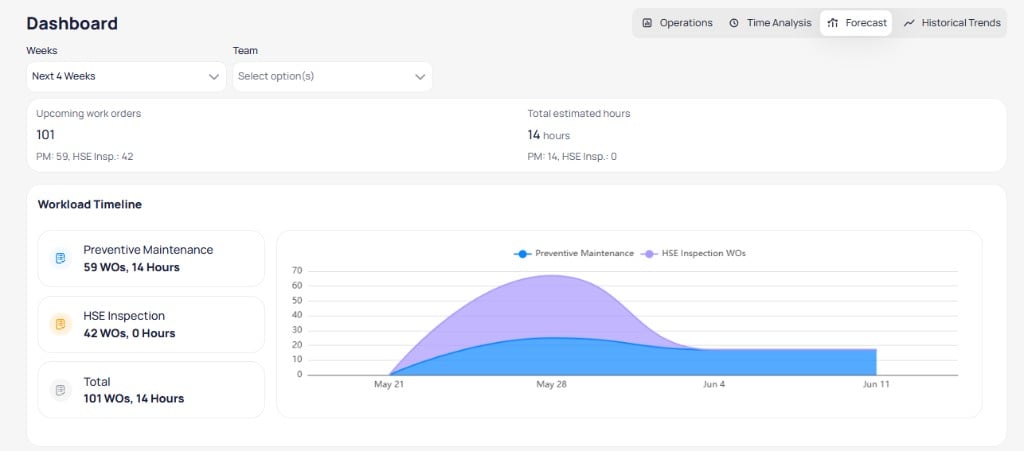
Forecast shows upcoming work orders and estimated hours over the next several weeks
- Upcoming work orders — Total scheduled work with breakdown by program (for example, preventive maintenance and inspections)
- Total estimated hours — Planned labor for upcoming work
Historical trends view
The Historical trends view shows longer-term patterns for work volume and completion at the building.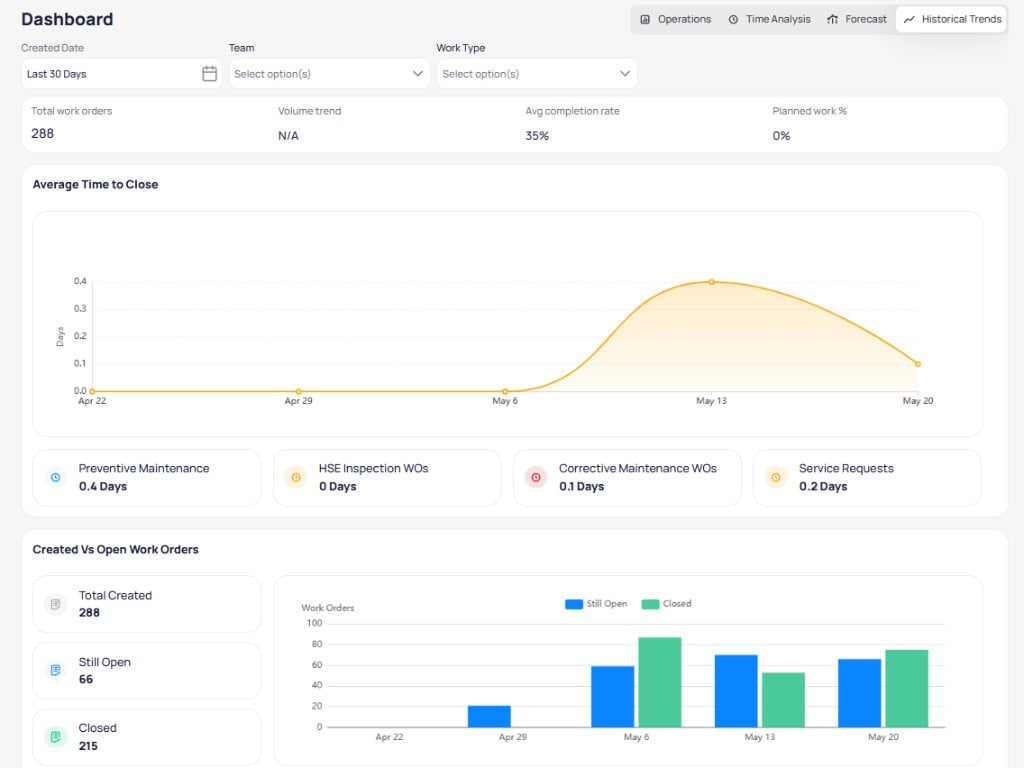
Historical trends show time to close and created versus open work orders over time
Summary metrics
The top row typically includes total work orders, volume trend, average completion rate, and planned work percentage for the filtered period.Average time to close
The Average time to close chart tracks how long work takes to close over time. Summary cards below break out average days to close by work type, such as preventive maintenance, inspections, corrective maintenance, and service requests.Created versus open work orders
The Created versus open work orders section compares work created in the period to work still open versus closed. Summary cards list total created, still open, and closed counts. The chart shows open and closed volumes over time.When to use the building dashboard
Use the building dashboard for day-to-day operations at a single site. Return to the portfolio level when you need comparisons across buildings or portfolio-wide configuration such as vendors or priority & SLA.Related modules
Work orders
Create and manage corrective maintenance for this building.
Assets
View and manage equipment, systems, and locations for this building.
Schedules
Plan preventive maintenance and inspections for this building.
Teams
Organize assignees whose workload appears on the dashboard.