

Access settings
Navigate toBuilding BI and click Settings at the bottom of the page.
Shared links
TheShared Links tab displays all generated links for your dashboards. Use the search bar and Active/Expired filters to find specific links. Select one or more links using the checkboxes to delete them in bulk.
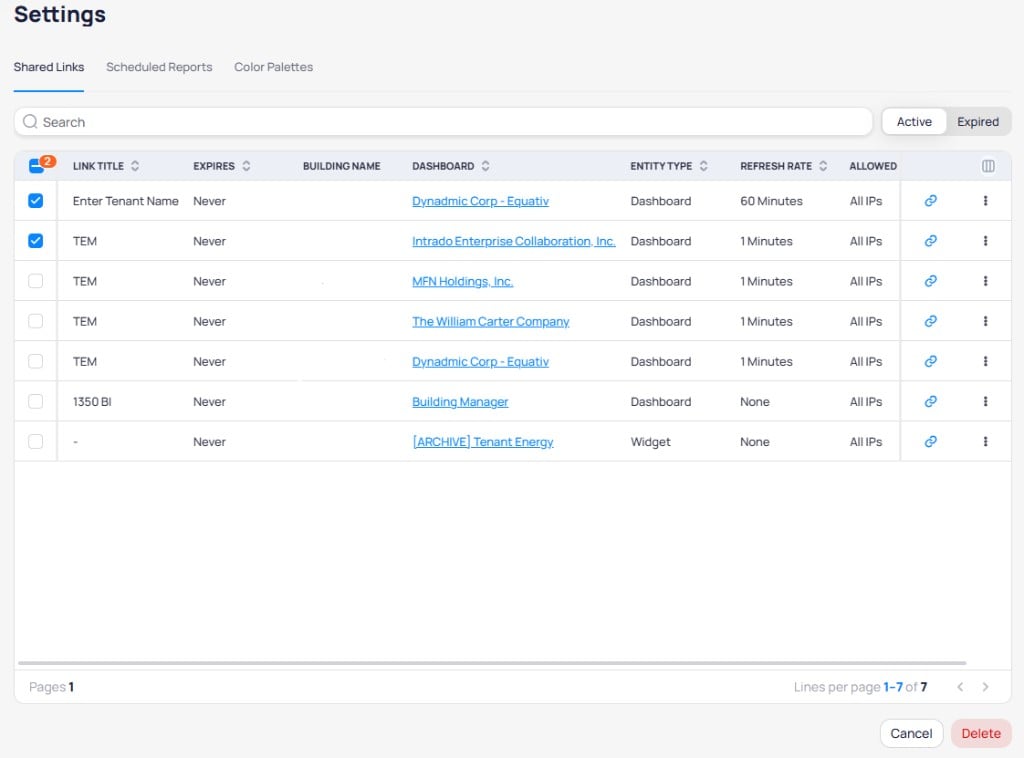
The Shared Links tab showing active links with expiration, dashboard, refresh rate, and IP access details
Edit a shared link
1
Open the edit dialog
Click the three-dot menu on the shared link and select
Edit.2
Modify link settings
Update any of the following fields:
- Pages to share — Select which dashboard pages are included in the link.
- Link Title — Update the display name for the shared link.
- Refresh Rate — Change how frequently the shared view refreshes.
- Allowed IPs — Restrict access to specific IP addresses.
3
Save your changes
Click
Save to apply the updated settings.Changing the
Allowed IPs field requires dashboard ownership. Contact the dashboard owner if you need to modify IP restrictions.Delete a shared link
Click the three-dot menu on the shared link and selectDelete. This revokes access for anyone using the link.
Scheduled reports
TheScheduled Reports tab lists all active and paused report schedules across your dashboards. Use the search bar and Enabled/Disabled filters to find specific reports.
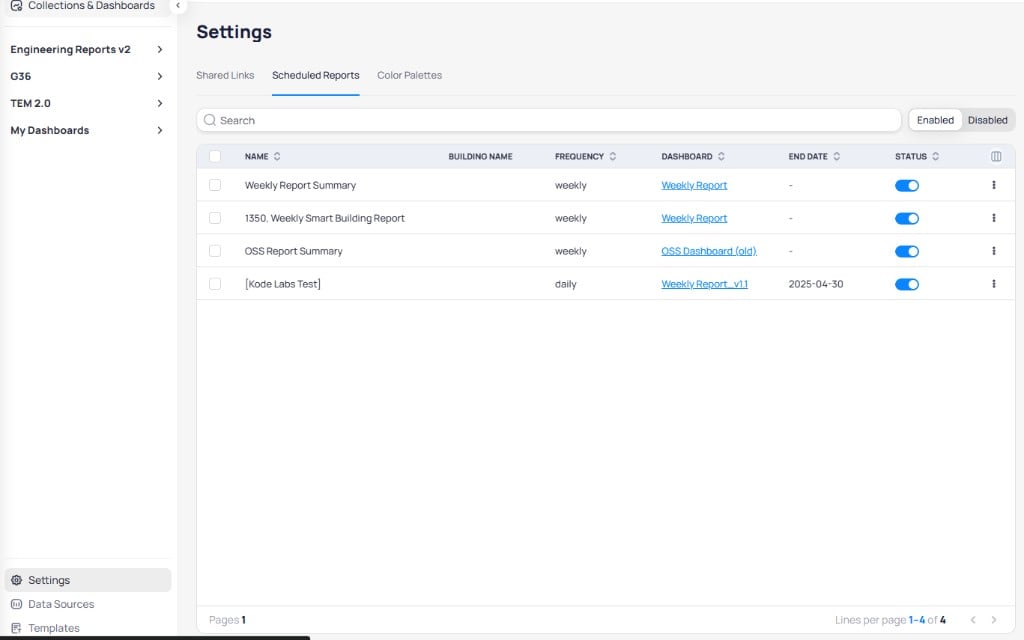
The Scheduled Reports tab showing report schedules with frequency, dashboard, and status columns
Delete to remove the selected schedules.
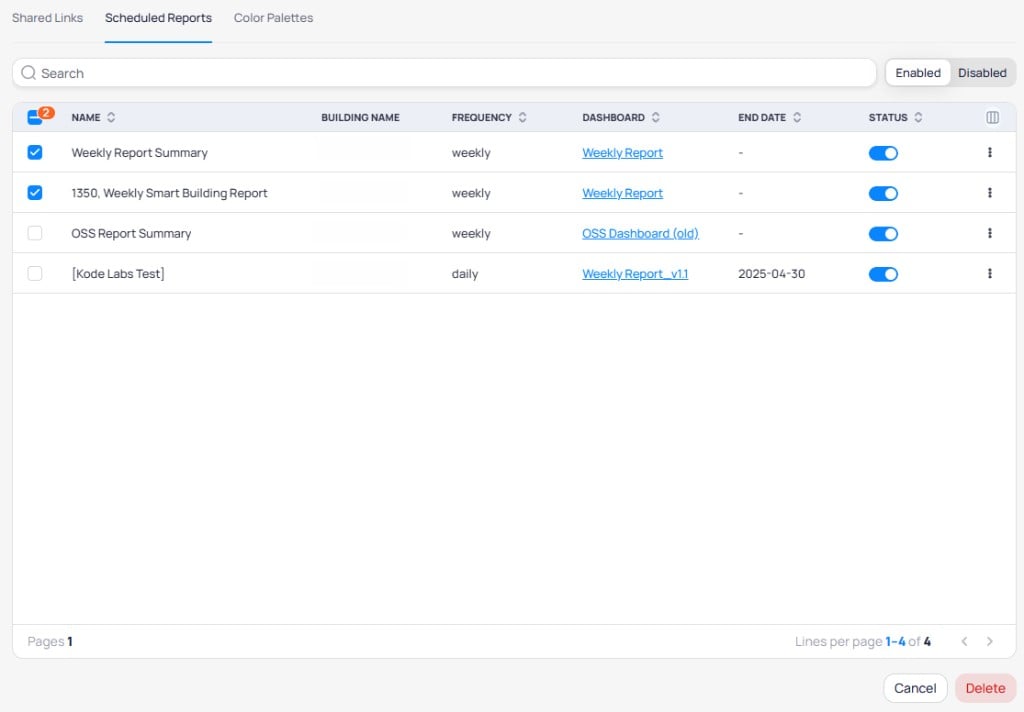
Selecting multiple scheduled reports for bulk deletion
Edit a scheduled report
Select the three-dot menu on any report and selectEdit. You can modify the report name, included pages, frequency, repeat interval, recipients, and other schedule settings.
Delete a scheduled report
Select the three-dot menu on the report and selectDelete. This permanently removes the schedule and stops all future deliveries.
Custom color palettes
Organization-level color palettes are managed from theColor Palettes tab. Create reusable palettes for branding, themes, or visualization contexts and apply them across all Building BI dashboards in your portfolio. See color tools and dashboard styling principles for selection and usage guidance.
Centralized palettes reduce ad-hoc color choices and help teams maintain a consistent visual identity across charts, backgrounds, markers, and other widget elements.
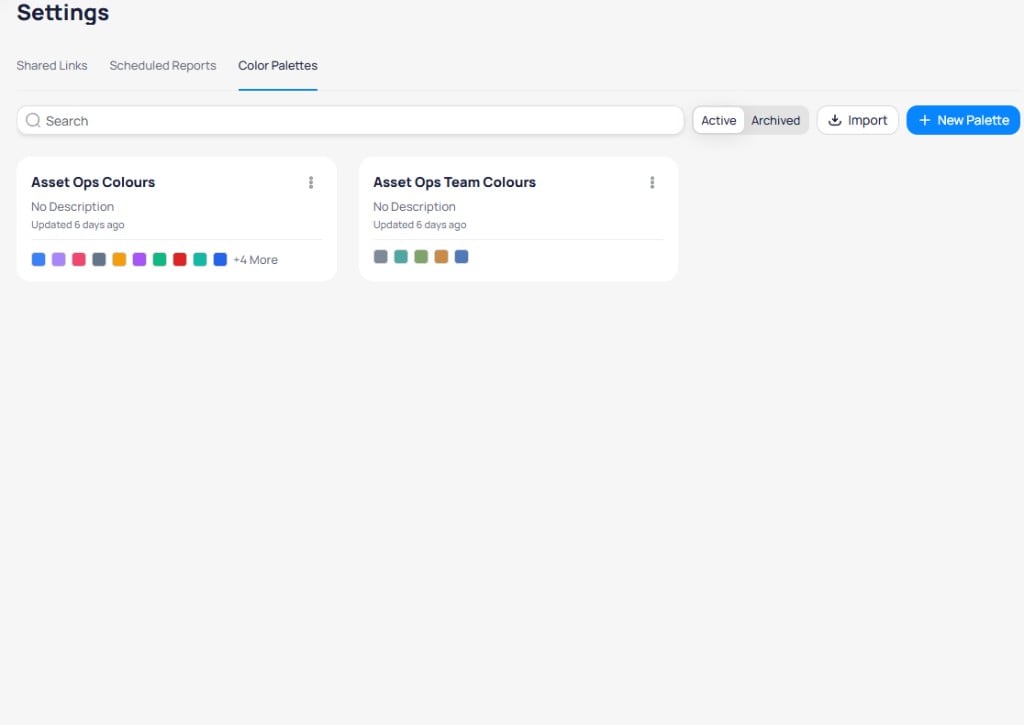
The Color Palettes tab showing custom organization palettes with color swatches
Active/Archived toggle to filter palettes by status. Select Import to upload a previously exported palette, or select + New Palette to create one.
Create a palette
Select+ New Palette and configure the palette details.
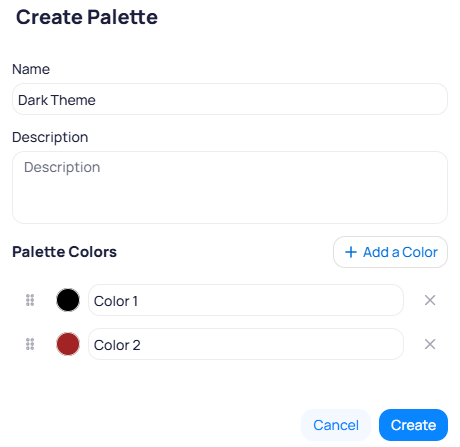
The Create Palette dialog with name, description, and color entries
Select
Create to save the palette.
Manage a palette
Select the three-dot menu on a palette card to access management actions.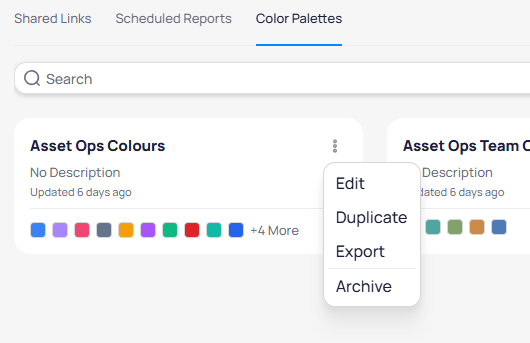
Palette card three-dot menu with Edit, Duplicate, Export, and Archive options
Color palettes created here appear as options in the
Colors section of any widget style configuration. Unlike the predefined color schemes provided by KODE Labs, custom palettes are designed and maintained by your organization.
Templates
TheTemplates page is accessible from the bottom of the left navigation panel. See Templates for full documentation on saving, importing, exporting, and applying templates.
Related reading
For export and schedule workflows, see PDF exports and scheduled reports. For field-level details, see Shared Links and Scheduled Reports. For who can share or schedule, see How Building BI permissions work.
Widget customization
Style widgets, apply defaults, manage palettes, and add graphics.
Choosing visualizations
Match chart types to the question you need to answer.
Chart types
Look up Setup requirements for every widget type.
Color tools
Configure series colors, gradients, and palettes.
Next steps
Dashboards
Create and configure interactive dashboards with charts, tables, and widgets.
PDF exports
Export dashboards as PDF files and schedule automated reports.