The test results page displays the output from all functional tests run across your building. Each test result contains the step-by-step sequence, sensor readings, pass or fail scores, and device test history.
Navigate to FTT from the left sidebar to open the test results dashboard. Select View all at the top right to access the full test results list.
If you have not run a test yet, start with What is Functional Testing?. That walkthrough uses an FCU heating example and shows how each sequence feeds the final score.

How to read a score

The score is the share of sequences that passed on that run. Two of three passed is 66.67%. Archived precondition failures do not count as a normal failed sequence score — the run stops before the mechanical steps complete. When you open a report, read it in this order:
  1. Final score — overall pass rate for the run
  2. Failed sequence — which step missed its threshold
  3. Sensor reading — measured value versus required value
  4. History — prior scores for the same device
A low score is not always a mechanical failure. Slow actuators, tight thresholds, or plant conditions can fail a sequence on healthy equipment. Use the failed sequence text to decide whether to retune parameters or investigate the unit.

Test results dashboard

The dashboard provides an at-a-glance summary of test performance across your building.
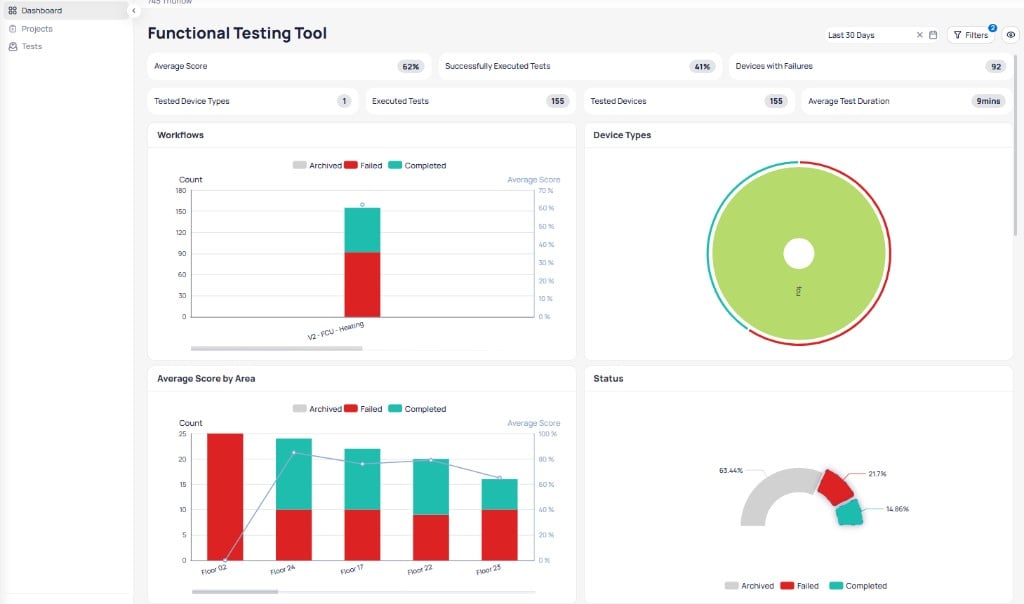
FTT dashboard showing Average Score 62 percent, Successfully Executed Tests 41 percent, Devices with Failures 92, Tested Device Types 1, Executed Tests 155, Tested Devices 155, Average Test Duration 9 mins, with Workflows bar chart, Device Types donut chart, Average Score by Area bar chart, and Status gauge

The FTT dashboard showing key metrics, workflow scores, device types, area breakdown, and status

Summary metrics

The top row displays key performance indicators:

Dashboard widgets

Sequence success scores and score trend
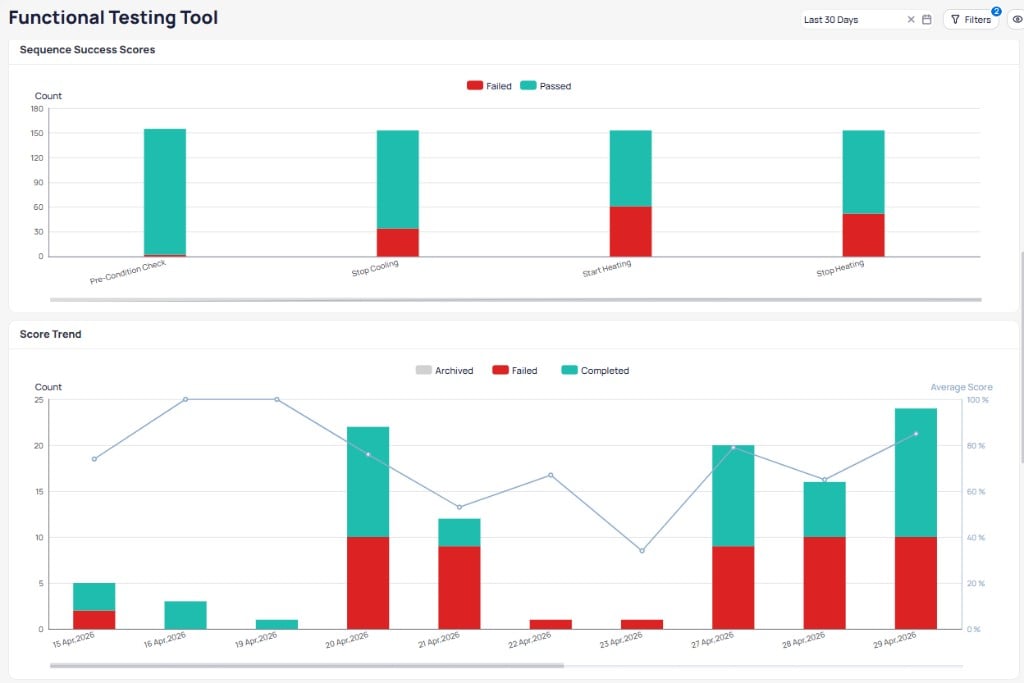
Sequence Success Scores stacked bar chart showing Failed and Passed counts for Pre-Condition Check, Stop Cooling, Start Heating, and Stop Heating steps, and Score Trend chart showing daily test counts with Average Score line from April 15 to April 29 2026

Sequence Success Scores per test step and Score Trend over time

Test times and all tests
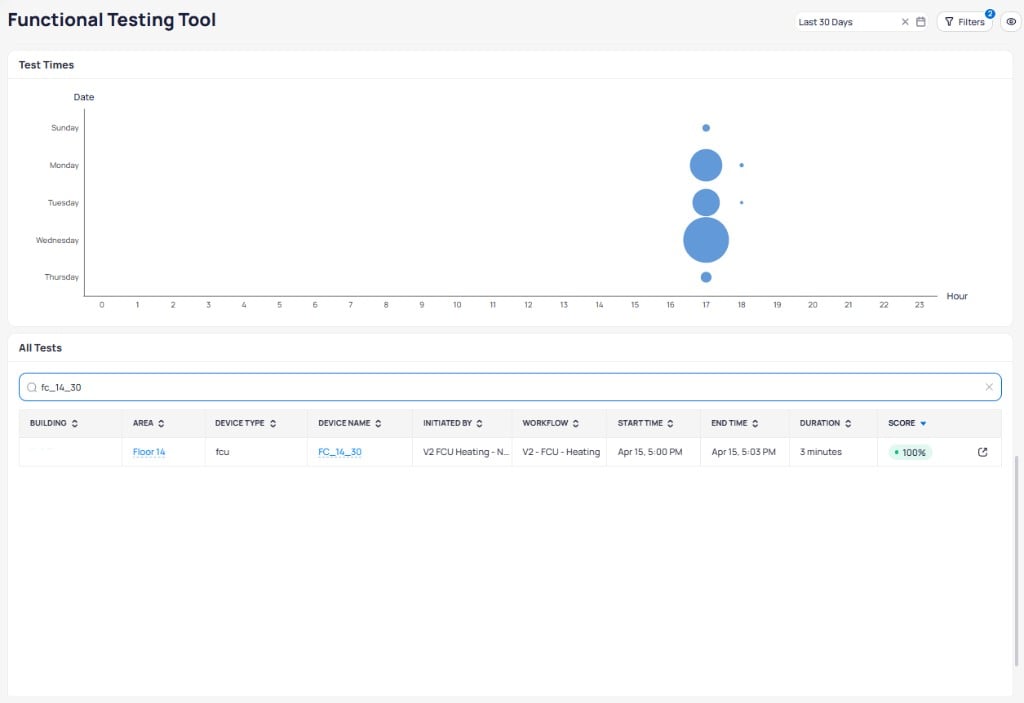
Test Times bubble chart showing test execution by day of week and hour, and All Tests table with Building, Area, Device Type, Device Name, Initiated By, Workflow, Start Time, End Time, Duration, and Score columns

Test Times bubble chart and the All Tests table with search

Dashboard filters

Use the filter toolbar to narrow dashboard data to specific criteria.

FTT dashboard filter toolbar showing Areas, Workflows, Device Types, Statuses with 2 selected, Choose Users dropdowns, and Save and Clear All buttons

The dashboard filters toolbar with Areas, Workflows, Device Types, Statuses, and Users filters

Select Save to persist your filter configuration. Select Clear All to reset all filters.

Test results list

The test results list displays all test results in a sortable, filterable table. Use the search bar, date picker, and filters to narrow results to specific devices or time ranges.
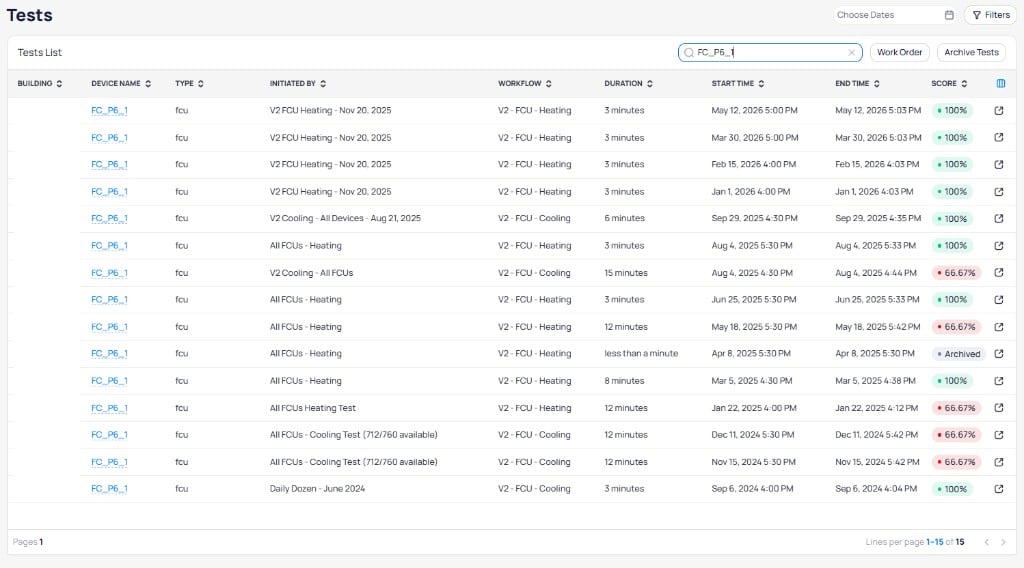
Tests list page showing 15 test results for device FC_P6_1 with columns for Building, Device Name, Type, Initiated By, Workflow, Duration, Start Time, End Time, and Score, with results ranging from 66.67 percent to 100 percent and one Archived test

Tests list showing all test results for a specific device with scores, durations, and workflows

Table features

  • Sort columns: select column headers with arrows to sort ascending or descending
  • Customize columns: select the column icon at the top right to show, hide, or reorder columns
  • Pagination: adjust the number of rows per page at the bottom of the table
  • Search: enter text in the search box to find matches across building, device name, device type, area, and workflow fields
  • Choose Dates: filter results to a specific date range
  • Work Order: create a work order from selected test results
  • Archive Tests: archive selected tests to exclude them from score calculations
Archived tests are often hidden by default. Include Archived in the Statuses filter when you need to find them.

Test result report

Select any row in the results list to open the detailed report for that test.

Test information

The top section displays metadata about the test, including building, device name, device type, area, initiating project, workflow, start and end times, status, and duration. The right panel shows a Work Order section and a History panel with past test scores for the same device.
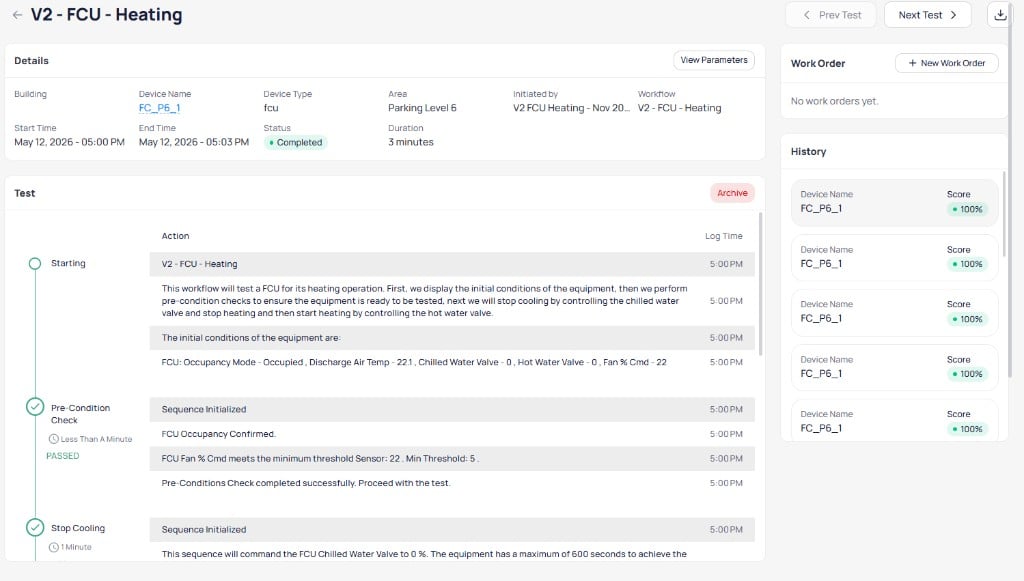
V2 FCU Heating test result for device FC_P6_1 showing Building, Device Name, Device Type fcu, Area Parking Level 6, Initiated by V2 FCU Heating Nov 20, Workflow V2 FCU Heating, Status Completed, Duration 3 minutes, with test sequence showing Starting step with workflow description and initial conditions, Pre-Condition Check PASSED with FCU Occupancy Confirmed and Fan percent Cmd threshold check, and Work Order panel with New Work Order button and History panel showing five previous 100 percent scores

Test result report showing device details, test sequence steps, work order panel, and score history

Select View Parameters to see the parameter values configured for the test. Use Prev Test and Next Test to navigate between test results, or select the download icon to export the report.

Test results detail

The main section presents a step-by-step report of the testing sequence. Each sequence shows its name, duration, and pass/fail status on the left, with detailed log entries and timestamps on the right.
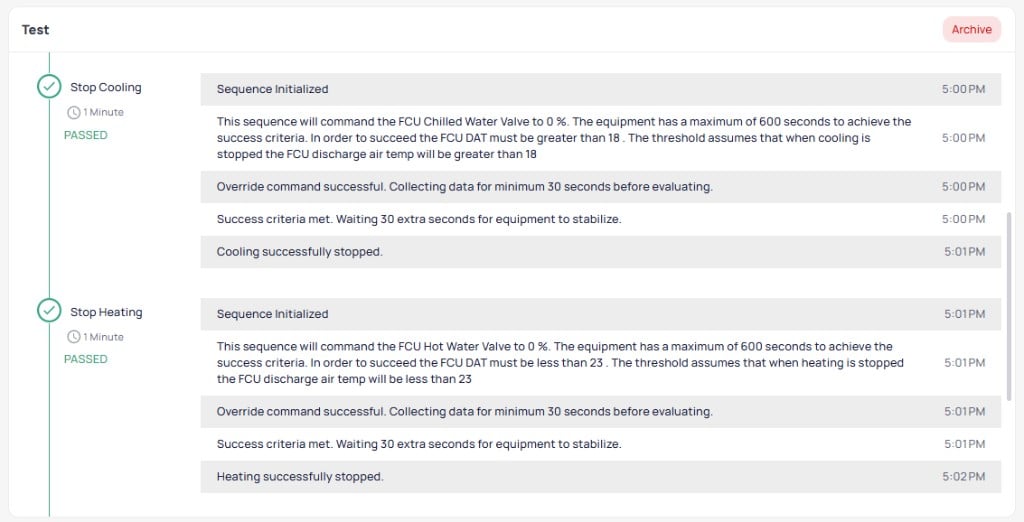
Test sequence showing Stop Cooling step PASSED in 1 minute with Sequence Initialized, command to set FCU Chilled Water Valve to 0 percent with 600 second maximum and DAT must be greater than 18 success criteria, Override command successful, Collecting data for minimum 30 seconds, Success criteria met with 30 second stabilization, Cooling successfully stopped, followed by Stop Heating step PASSED in 1 minute with similar sequence commanding FCU Hot Water Valve to 0 percent with DAT must be less than 23 criteria

Test sequence steps showing Stop Cooling and Stop Heating both passed
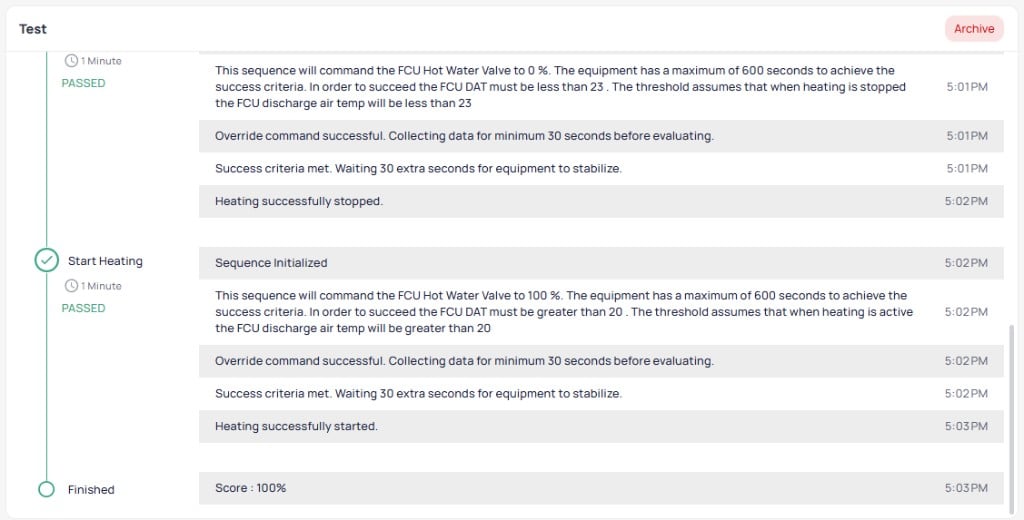
Test sequence continuation showing Stop Heating completion with Heating successfully stopped, then Start Heating step PASSED in 1 minute with Sequence Initialized, command to set FCU Hot Water Valve to 100 percent with DAT must be greater than 20 success criteria, Override command successful, data collection, Success criteria met, Heating successfully started, and Finished step showing final Score 100 percent

Start Heating sequence passed and test finished with a final score of 100 percent

Each sequence displays:
  • Sequence description: what the test commanded and the success criteria
  • Override status: whether the write command succeeded
  • Minimum duration: the wait time before evaluating results
  • Sensor readings: real-time point values compared against thresholds
  • Stabilization period: buffer time between sequences
  • Sequence result: pass or fail with an explanation

Failed test example

When a sequence fails, it displays a red X icon and a FAILED label. The log entries show the sensor reading that did not meet the threshold, along with the time the test waited before determining the failure.
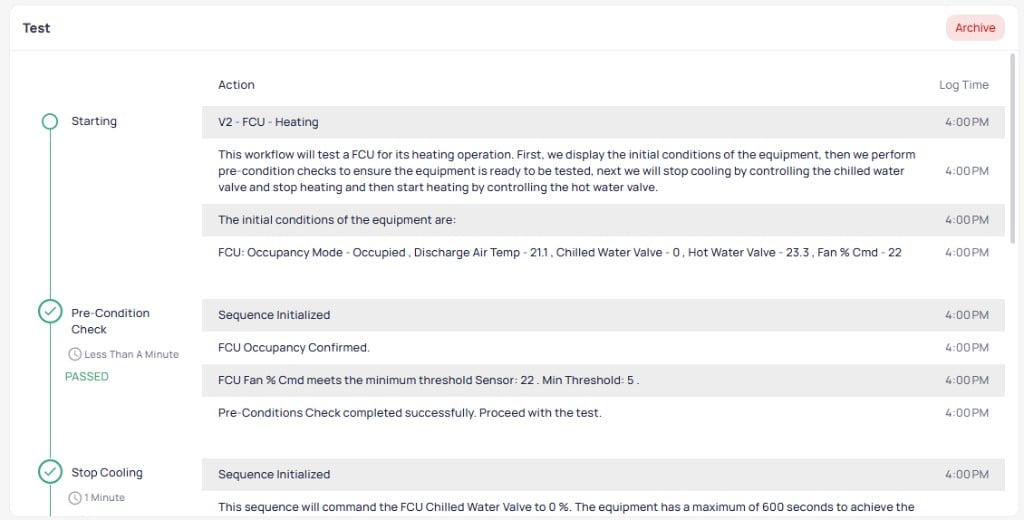
V2 FCU Heating test showing Starting step with workflow description and initial conditions including Occupancy Mode Occupied, Discharge Air Temp 21.1, Chilled Water Valve 0, Hot Water Valve 23.3, Fan percent Cmd 22, followed by Pre-Condition Check PASSED in less than a minute with FCU Occupancy Confirmed and Fan percent Cmd meets minimum threshold of 5, and beginning of Stop Cooling sequence

Failed test starting sequence with initial conditions and Pre-Condition Check passed
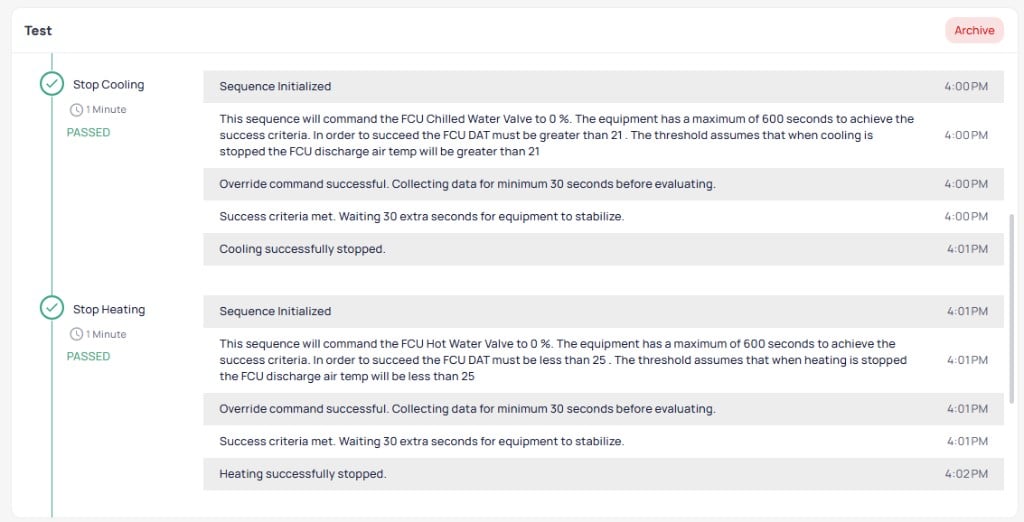
Stop Cooling sequence PASSED in 1 minute with FCU Chilled Water Valve commanded to 0 percent and DAT greater than 21 success criteria met, followed by Stop Heating sequence PASSED in 1 minute with FCU Hot Water Valve commanded to 0 percent and DAT less than 25 criteria met

Stop Cooling and Stop Heating sequences both passed
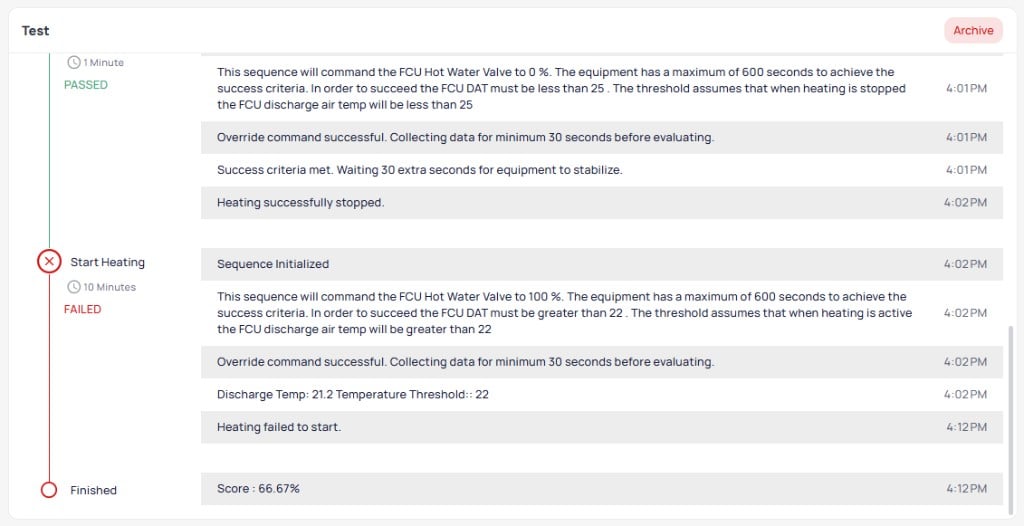
Stop Heating continuation showing Heating successfully stopped, then Start Heating step FAILED after 10 minutes with FCU Hot Water Valve commanded to 100 percent, DAT must be greater than 22 criteria not met, Discharge Temp 21.2 versus Temperature Threshold 22, Heating failed to start, and Finished step showing final Score 66.67 percent with red indicators

Start Heating sequence failed with Discharge Temp 21.2 below the threshold of 22, resulting in a final score of 66.67 percent

In this example, Stop Cooling and Stop Heating passed, but the Start Heating sequence failed because the discharge air temperature (21.2) did not reach the required threshold (22) within the 600-second maximum duration. The final score reflects the ratio of passed scored sequences: 66.67% (two of three). The Pre-Condition Check passed earlier and does not change that ratio. That pattern is how FTT decides whether heating worked: command the valve, wait within the time limits, compare discharge air temperature to the threshold, then score. See How to read a score.

Quick navigation

The quick navigation panel on the right provides shortcuts to related test results. The History section shows past scores for the same device, with color-coded badges indicating pass (green) or fail (red). Select any entry in the quick navigation panel to jump to that report.

Device test history

The bottom section shows historical performance for the tested device and workflow.
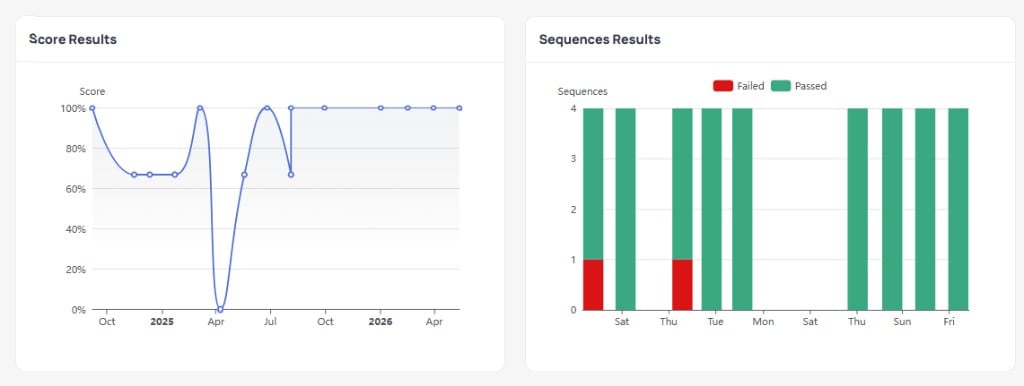
Score Results line chart showing test scores over time from October 2024 to April 2026 with scores ranging from 0 to 100 percent, and Sequences Results stacked bar chart showing Failed in red and Passed in green counts per test day

Score Results trend line and Sequences Results breakdown for a device

  • Score Results: line chart tracking test scores across multiple test runs, showing performance trends over time
  • Sequences Results: stacked bar chart showing passed (green) and failed (red) sequence counts per test execution to identify recurring failure patterns
Use the Sequences Results chart to spot persistent issues. A device that consistently fails the same sequence likely has a specific mechanical or control problem worth investigating.

Archive a test result

Select Archive on any test result to remove it from downstream success calculations. Archived results remain accessible but do not affect average scores or pass rates.

Run a test on a single device

You can run an FTT test immediately on a single device from the device details page without creating a project.
1

Navigate to the device

Go to Devices and select the device you want to test. Open the FTT tab on the device details page.
2

Select a workflow and reason

Select Run New Test. Choose a workflow from the Workflow dropdown and select a Reason for the test. Optionally add details in the Specify field.
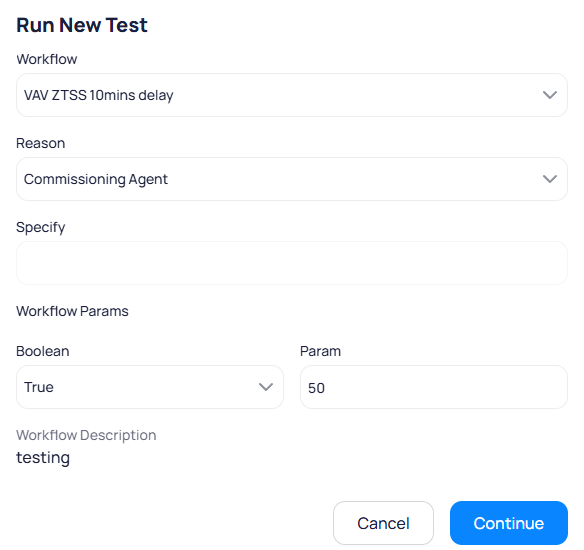
Run New Test dialog showing Workflow dropdown set to VAV ZTSS 10mins delay, Reason dropdown set to Commissioning Agent, Specify text field, Workflow Params section with Boolean set to True and Param set to 50, and Workflow Description showing testing

Select a workflow and reason for the on-demand test

3

Review and adjust parameters

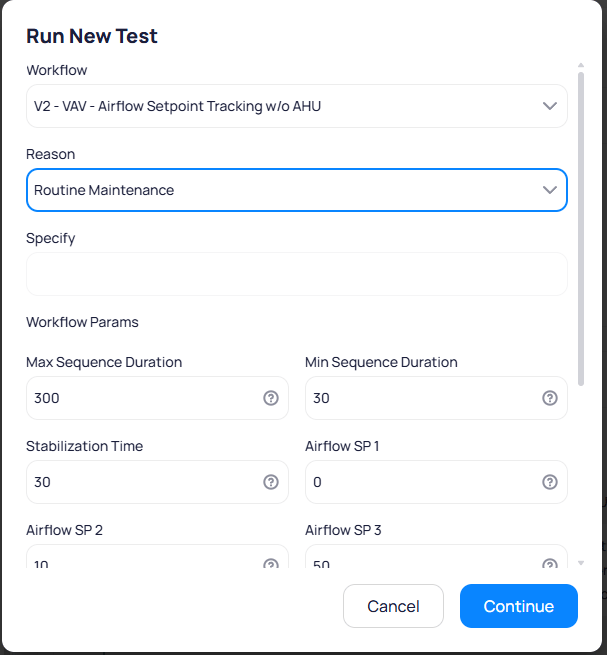
Review the workflow parameters and adjust values as needed for this specific test run. Parameters vary by workflow and control success criteria, time limits, and command values.
Run New Test dialog showing Workflow set to V2 VAV Airflow Setpoint Tracking without AHU, Reason set to Routine Maintenance, and Workflow Params including Max Sequence Duration 300, Min Sequence Duration 30, Stabilization Time 30, Airflow SP 1 set to 0, Airflow SP 2 set to 10, and Airflow SP 3 set to 50

Workflow parameters for a V2 VAV Airflow Setpoint Tracking test

4

Confirm and run

Select Continue to review the confirmation dialog. This shows the workflow name, the device being tested, and the maximum test duration. The device is locked during the test and cannot be used until the test completes.
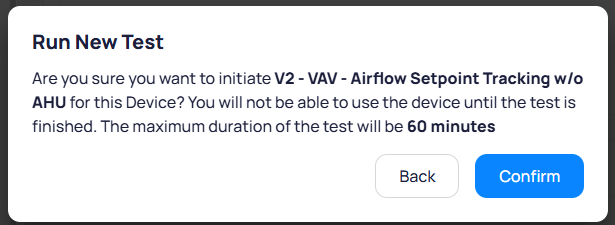
Run New Test confirmation dialog asking Are you sure you want to initiate V2 VAV Airflow Setpoint Tracking without AHU for this Device with note that the device cannot be used until test is finished and maximum duration of 60 minutes, with Back and Confirm buttons

Confirmation dialog showing the workflow, device, and maximum test duration

Select Confirm to start the test. The test result page opens immediately and shows live progress.
5

Monitor the test

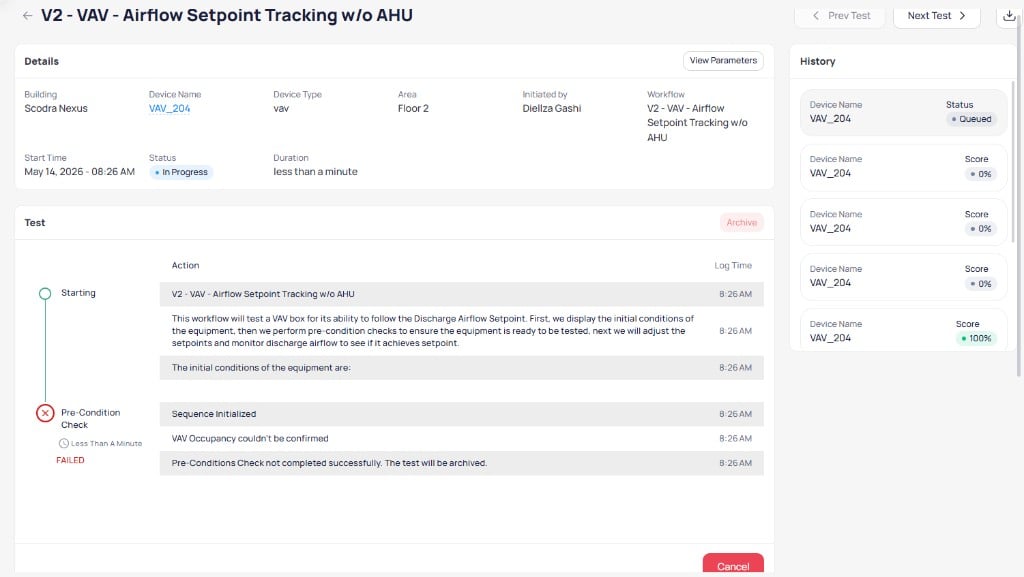
The test result page displays the test status, sequence progress, and live log entries as the test runs. The History panel on the right shows previous test scores for the same device.
V2 VAV Airflow Setpoint Tracking without AHU test result for device VAV_204 showing Status In Progress, Duration less than a minute, Starting step with workflow description and initial conditions, Pre-Condition Check FAILED because VAV Occupancy could not be confirmed with test archived, and History panel showing previous scores of 0 percent and 100 percent

Live test result showing an in-progress test with a failed pre-condition check

If a pre-condition check fails, the test is automatically archived. Address the pre-condition issue (such as confirming the device is in Occupied mode) before running the test again.

Next steps

Run your first test

Run an on-demand FCU heating test and practice reading the score.

FTT projects

Create automated testing projects to schedule tests across your building.

FTT introduction

Review how FTT decides pass or fail, then how workflows and projects fit together.

Deployment guide

Calibrate parameters and roll out recurring testing across the building.
Last modified on August 18, 2026