> ## Documentation Index
> Fetch the complete documentation index at: https://documentation.kodelabs.com/llms.txt
> Use this file to discover all available pages before exploring further.

# Event dashboards on mobile

> Use Active and Historical FDD analytics cards to review open load and period trends on the KODE OS mobile app.

Event dashboards show KPI cards and charts for FDD. They match [FDD dashboards](/products/fdd/dashboards) on the web. Open them from the `FDD Events` header when you need a summary view instead of only the event table.

## When to use Active vs Historical

| Mode         | Use for                                | Typical question                                                |
| ------------ | -------------------------------------- | --------------------------------------------------------------- |
| `Active`     | Open events and incidents right now    | “What is open, how urgent is it, and who owns it?”              |
| `Historical` | Closed or past items over a date range | “How busy was last week, and is acknowledgment getting slower?” |

Both modes share the same chart types. The numbers change with the time window and whether items are still open.

## Open dashboards

<Steps>
  <Step title="Open FDD Events">
    Launch `FDD Events` from the building app launcher.
  </Step>

  <Step title="Select Active or Historical">
    Use the header dropdown. `Active` shows open-event KPIs. `Historical` shows period averages and trends.
  </Step>

  <Step title="Align filters">
    Use the `filter` icon so cards match the same area, priority, and date chips as the list.
  </Step>

  <Step title="Return to triage">
    Switch back to `Events` or `Incidents` in the header dropdown when you need to acknowledge or open a record. See [Events on mobile](/products/mobile-app/events/work-with-events).
  </Step>
</Steps>

<Tabs>
  <Tab title="Active">
    <span id="active-dashboard" />

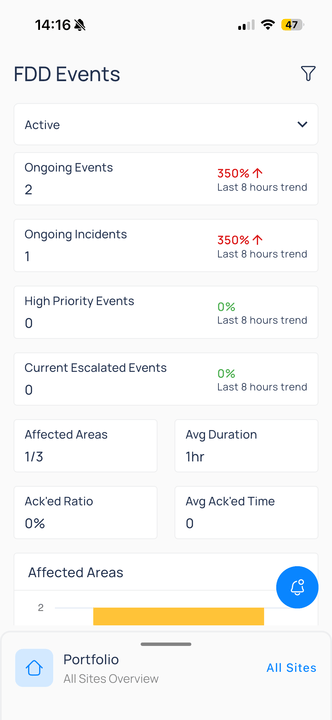
    `Active` puts summary cards at the top of `FDD Events`.

    <div className="flex justify-center w-full my-4">
      <Frame className="w-fit mx-auto" caption="Summary KPI cards with 8-hour trends">
        <img className="mx-auto block h-auto max-w-[400px] w-full" src="https://mintcdn.com/kodelabs/IXjGUtCN1G_ZdIHf/images/mobile-app/kode-os-mobile-fdd-active-dashboard.png?fit=max&auto=format&n=IXjGUtCN1G_ZdIHf&q=85&s=3623200d15eadfd5961e0956ad4fab62" alt="Active FDD dashboard with Ongoing Events 2, Ongoing Incidents 1, High Priority Events 0, and secondary metrics for affected areas and acknowledgment" width="332" height="720" data-path="images/mobile-app/kode-os-mobile-fdd-active-dashboard.png" />
      </Frame>
    </div>

    | Card                                   | What it tells you                                         |
    | -------------------------------------- | --------------------------------------------------------- |
    | `Ongoing Events` / `Ongoing Incidents` | Current open count with an 8-hour trend                   |
    | `High Priority` / `Escalated`          | Critical load that needs attention first                  |
    | `Affected Areas` / `Avg Duration`      | Where impact is concentrated and how long items stay open |
    | `Ack'ed Ratio` / `Avg Ack'ed Time`     | How quickly the team acknowledges work                    |

    Scroll for charts that break down open events by area, routine, priority, device type, resolution, and assignee.

    <div className="flex justify-center w-full my-4">
      <Frame className="w-fit mx-auto" caption="Assignees and floor filter">
        <img className="mx-auto block h-auto max-w-[400px] w-full" src="https://mintcdn.com/kodelabs/IXjGUtCN1G_ZdIHf/images/mobile-app/kode-os-mobile-fdd-active-assignees.png?fit=max&auto=format&n=IXjGUtCN1G_ZdIHf&q=85&s=8c4a1dcbda05ed9c8aa790c27c501051" alt="Active assignees table with 2 events and 1 hour duration plus Floor 2 range control" width="332" height="720" data-path="images/mobile-app/kode-os-mobile-fdd-active-assignees.png" />
      </Frame>
    </div>

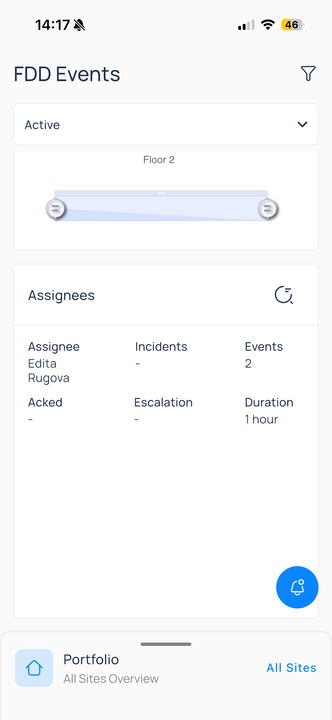
    The `Assignees` table lists open events by owner. Use the floor range control to focus charts on a specific area.

    <AccordionGroup>
      <Accordion title="Active chart reference">
        | Chart                         | Shows                                                           |
        | ----------------------------- | --------------------------------------------------------------- |
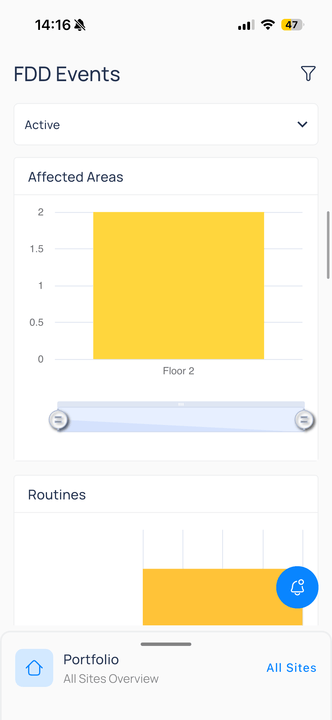
        | `Affected Areas`              | Open events by floor or zone                                    |
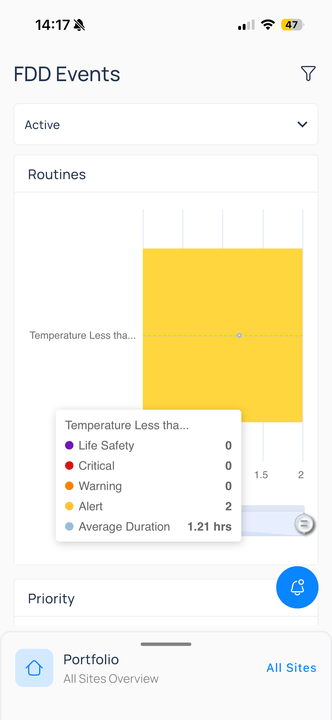
        | `Routines`                    | Active events by fault name, with priority and average duration |
        | `Priority`                    | Share of events at each severity                                |
        | `Domains`                     | Fault category such as cooling or heating                       |
        | `Affected Device Types`       | Equipment types involved (for example, FCU or VAV)              |
        | `Relative Impact`             | Event load across areas or systems                              |
        | `Resolution`                  | Acknowledged versus unacknowledged                              |
        | `Duration and Count Overview` | Event count compared with time open                             |

        <div className="flex justify-center w-full my-4">
          <Frame className="w-fit mx-auto" caption="Affected areas by floor">
            <img className="mx-auto block h-auto max-w-[400px] w-full" src="https://mintcdn.com/kodelabs/IXjGUtCN1G_ZdIHf/images/mobile-app/kode-os-mobile-fdd-active-affected-areas.png?fit=max&auto=format&n=IXjGUtCN1G_ZdIHf&q=85&s=6beae5e7ef0983ea666803f1840b5862" alt="Active Affected Areas bar chart showing Floor 2 with 2 events" width="332" height="720" data-path="images/mobile-app/kode-os-mobile-fdd-active-affected-areas.png" />
          </Frame>
        </div>

        <div className="flex justify-center w-full my-4">
          <Frame className="w-fit mx-auto" caption="Routines with severity breakdown">
            <img className="mx-auto block h-auto max-w-[400px] w-full" src="https://mintcdn.com/kodelabs/IXjGUtCN1G_ZdIHf/images/mobile-app/kode-os-mobile-fdd-active-routines.png?fit=max&auto=format&n=IXjGUtCN1G_ZdIHf&q=85&s=3118083a14c4cd8380d8c8522a5772d9" alt="Active Routines chart for Temperature Less than Setpoint with Alert count 2 and average duration 1.21 hours" width="332" height="720" data-path="images/mobile-app/kode-os-mobile-fdd-active-routines.png" />
          </Frame>
        </div>
      </Accordion>
    </AccordionGroup>
  </Tab>

  <Tab title="Historical">
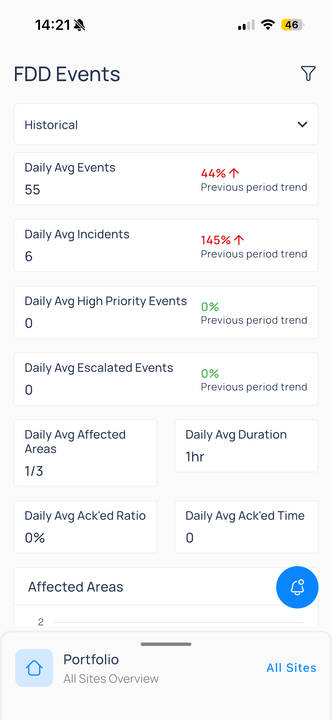
    `Historical` shows closed-period analytics at the top of `FDD Events`.

    <div className="flex justify-center w-full my-4">
      <Frame className="w-fit mx-auto" caption="Daily average KPI cards with previous-period trends">
        <img className="mx-auto block h-auto max-w-[400px] w-full" src="https://mintcdn.com/kodelabs/IXjGUtCN1G_ZdIHf/images/mobile-app/kode-os-mobile-fdd-historical-dashboard.png?fit=max&auto=format&n=IXjGUtCN1G_ZdIHf&q=85&s=f6ce00ff3e8f54226fe17c90ffe07ad2" alt="Historical FDD dashboard with Daily Avg Events 55, Daily Avg Incidents 6, and acknowledgment metrics" width="332" height="720" data-path="images/mobile-app/kode-os-mobile-fdd-historical-dashboard.png" />
      </Frame>
    </div>

    | Card                                       | What it tells you                    |
    | ------------------------------------------ | ------------------------------------ |
    | `Daily Avg Events` / `Daily Avg Incidents` | Volume versus the prior period       |
    | `Daily Avg High Priority` / `Escalated`    | Severity trends                      |
    | `Daily Avg Affected Areas` / `Duration`    | Scope and time to close              |
    | Daily average acknowledgment metrics       | Acknowledgment performance over time |

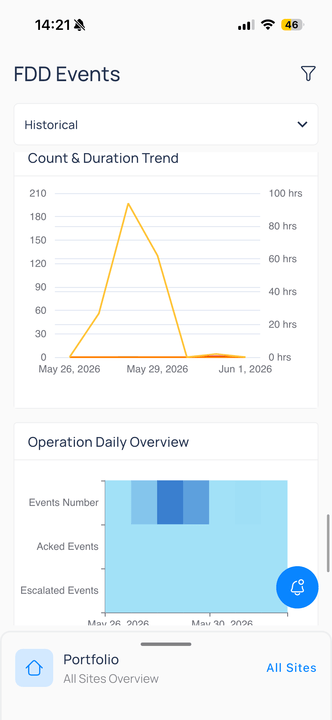
    Scroll for charts that summarize closed events by area, routine, priority, device type, resolution, trends, and assignee.

    <div className="flex justify-center w-full my-4">
      <Frame className="w-fit mx-auto" caption="Count trend and daily operation heatmap">
        <img className="mx-auto block h-auto max-w-[400px] w-full" src="https://mintcdn.com/kodelabs/IXjGUtCN1G_ZdIHf/images/mobile-app/kode-os-mobile-fdd-historical-count-trend.png?fit=max&auto=format&n=IXjGUtCN1G_ZdIHf&q=85&s=80c73b7ce3b10770a1ad3989b38b219e" alt="Historical Count and Duration Trend line chart peaking May 27 to 29 and Operation Daily Overview heatmap" width="332" height="720" data-path="images/mobile-app/kode-os-mobile-fdd-historical-count-trend.png" />
      </Frame>
    </div>

    `Count & Duration Trend` plots volume and time open across the selected date range. `Operation Daily Overview` compares events, acknowledgments, and escalations by day.

    <AccordionGroup>
      <Accordion title="Historical chart reference">
        | Chart                         | Shows                                           |
        | ----------------------------- | ----------------------------------------------- |
        | `Affected Areas`              | Closed events by floor or zone                  |
        | `Routines`                    | Closed events by fault name                     |
        | `Priority`                    | Share of events at each severity                |
        | `Domains`                     | Fault category such as cooling or heating       |
        | `Affected Device Types`       | Equipment types involved                        |
        | `Relative Impact`             | Event load across areas or systems              |
        | `Resolution`                  | Acknowledged versus unacknowledged              |
        | `Duration and Count Overview` | Event count compared with time open             |
        | `Count & Duration Trend`      | Volume and duration over the date range         |
        | `Operation Daily Overview`    | Events, acknowledgments, and escalations by day |
        | `Escalated Events`            | When events escalated during the period         |
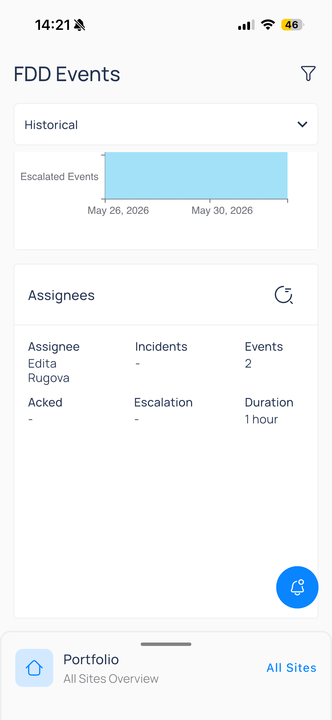
        | `Assignees`                   | Closed events by owner with counts and duration |

        <div className="flex justify-center w-full my-4">
          <Frame className="w-fit mx-auto" caption="Escalated events and assignees">
            <img className="mx-auto block h-auto max-w-[400px] w-full" src="https://mintcdn.com/kodelabs/IXjGUtCN1G_ZdIHf/images/mobile-app/kode-os-mobile-fdd-historical-escalated-assignees.png?fit=max&auto=format&n=IXjGUtCN1G_ZdIHf&q=85&s=230790537844e7d1e9709c3a0edaf36a" alt="Historical Escalated Events timeline and assignees table with 2 events" width="332" height="720" data-path="images/mobile-app/kode-os-mobile-fdd-historical-escalated-assignees.png" />
          </Frame>
        </div>
      </Accordion>
    </AccordionGroup>
  </Tab>
</Tabs>

## Customize layouts on web

Dashboard composition, card types, and building-wide defaults are configured on the web. Mobile shows the published definitions for your role.

## Next steps

<CardGroup cols={2}>
  <Card title="Events on mobile" icon="bell" href="/products/mobile-app/events/work-with-events" arrow={true}>
    Filter, acknowledge, and investigate events.
  </Card>

  <Card title="FDD overview" icon="stethoscope" href="/products/mobile-app/diagnostics/fdd-overview" arrow={true}>
    Choose the right FDD screen for the job.
  </Card>
</CardGroup>