> ## Documentation Index
> Fetch the complete documentation index at: https://documentation.kodelabs.com/llms.txt
> Use this file to discover all available pages before exploring further.

# Manage FDD faults on mobile

> Browse, filter, and investigate FDD faults by fault, device, or routine on the KODE OS mobile app.

Review which equipment has a recurring fault, how long it has been open, and what to do next. `FDD Faults` groups faults by equipment or routine, shows occurrence metrics, and links to point trends for diagnosis. This page follows [Faults](/products/fdd/faults) on the web.

## Events vs Faults

FDD surfaces two related but distinct views of equipment problems:

| Screen                                                                   | Shows                                      | Use for                                        |
| ------------------------------------------------------------------------ | ------------------------------------------ | ---------------------------------------------- |
| [Events list](/products/mobile-app/events/work-with-events)              | Individual findings as they happen         | Live triage and acknowledgment                 |
| `FDD Faults` (this page)                                                 | A routine on a device summarized over time | Lifecycle metrics and root-cause investigation |
| [Incidents](/products/mobile-app/events/work-with-events#incidents-list) | Many related events grouped together       | Portfolio-level analytics                      |

Open fault detail from `FDD Events` when you follow a device link, from [FDD Reports from a device](/products/mobile-app/events/work-with-events#fdd-reports-from-a-device), or from the `FDD Faults` app launcher.

## Open FDD Faults

Select `FDD Faults` from the building app launcher. Use the header filter icon for area and date chips such as `Last 7 Days`. Use the history icon to refresh when streaming is enabled.

## Group faults by view

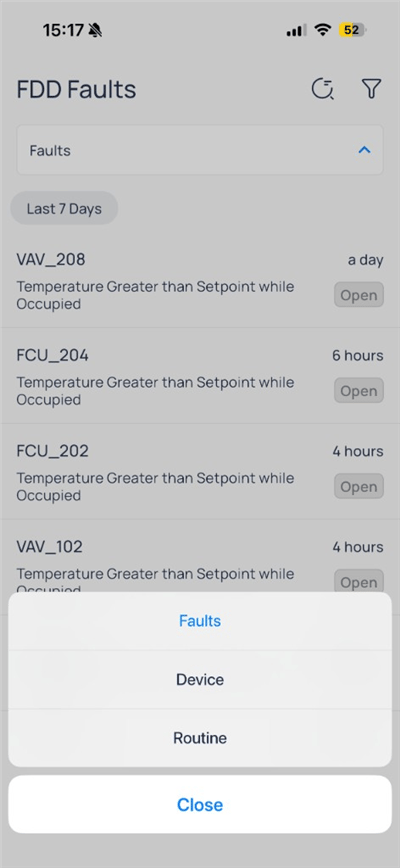
The header dropdown switches how the list is organized:

<div className="flex justify-center w-full my-4">
  <Frame className="w-fit mx-auto" caption="Faults, Device, and Routine">
    <img className="mx-auto block h-auto max-w-[400px] w-full" src="https://mintcdn.com/kodelabs/IXjGUtCN1G_ZdIHf/images/mobile-app/kode-os-mobile-fdd-faults-view-menu.png?fit=max&auto=format&n=IXjGUtCN1G_ZdIHf&q=85&s=7109a2c86b600a6091c622e8cee30fb1" alt="FDD Faults view menu with Faults, Device, and Routine options" width="400" height="868" data-path="images/mobile-app/kode-os-mobile-fdd-faults-view-menu.png" />
  </Frame>
</div>

| View      | List shows                                   |
| --------- | -------------------------------------------- |
| `Faults`  | One row per open fault on a device           |
| `Device`  | Equipment with fault counts and floor        |
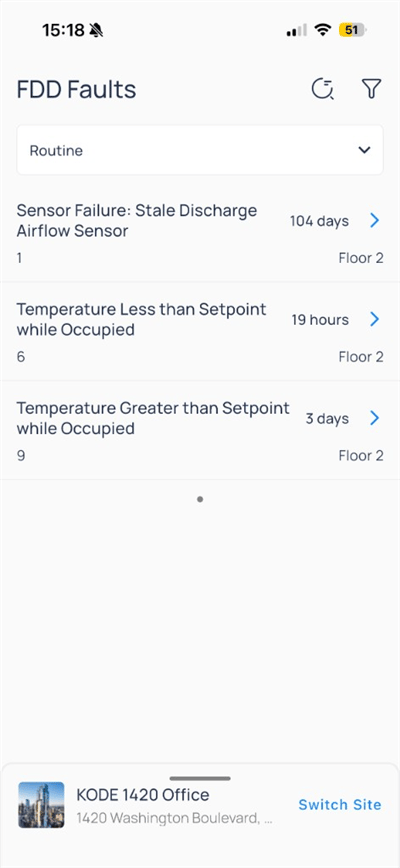
| `Routine` | Diagnostic routines with counts and duration |

<Tabs>
  <Tab title="Faults">
    <div className="flex justify-center w-full my-4">
      <Frame className="w-fit mx-auto">
        <img className="mx-auto block h-auto max-w-[400px] w-full" src="https://mintcdn.com/kodelabs/IXjGUtCN1G_ZdIHf/images/mobile-app/kode-os-mobile-fdd-faults-list.png?fit=max&auto=format&n=IXjGUtCN1G_ZdIHf&q=85&s=fd1759bdb44690e51ba9a4f7392be36c" alt="FDD Faults list with VAV and FCU devices and Open status" width="400" height="868" data-path="images/mobile-app/kode-os-mobile-fdd-faults-list.png" />
      </Frame>
    </div>

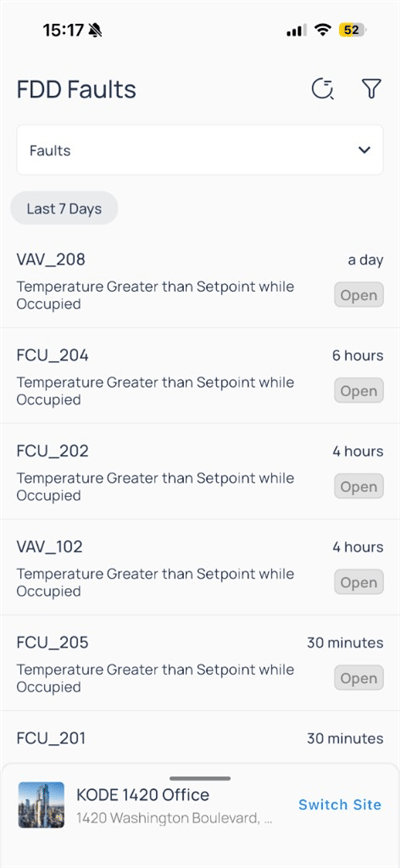
    Each row includes:

    | Element       | Description                                                                  |
    | ------------- | ---------------------------------------------------------------------------- |
    | Device ID     | Equipment such as `VAV_208` or `FCU_204`                                     |
    | Routine title | Fault name (for example, `Temperature Greater than Setpoint while Occupied`) |
    | Age           | Relative time (for example, a day, 6 hours)                                  |
    | Status        | `Open` or other workflow state                                               |

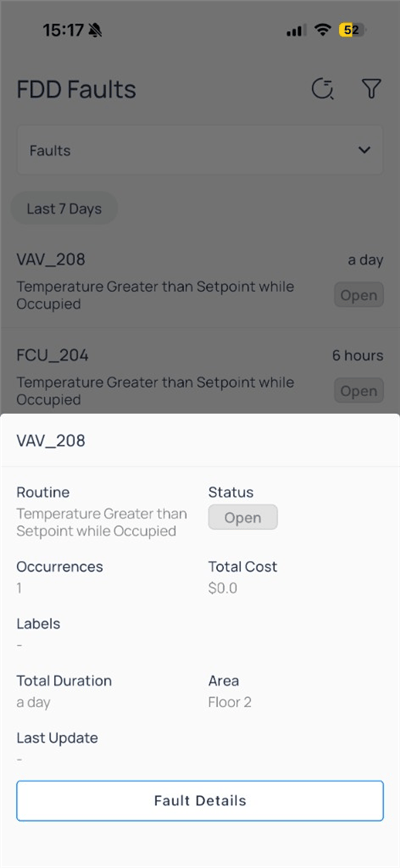
    Tap a row for a summary sheet, then `Fault Details` for the full page.

    <div className="flex justify-center w-full my-4">
      <Frame className="w-fit mx-auto" caption="Fault summary before full details">
        <img className="mx-auto block h-auto max-w-[400px] w-full" src="https://mintcdn.com/kodelabs/IXjGUtCN1G_ZdIHf/images/mobile-app/kode-os-mobile-fdd-fault-detail-sheet.png?fit=max&auto=format&n=IXjGUtCN1G_ZdIHf&q=85&s=04f993b6eaa52ad1d711bf6d01b1e08b" alt="Fault sheet for VAV_208 with routine, occurrences, and area Floor 2" width="400" height="868" data-path="images/mobile-app/kode-os-mobile-fdd-fault-detail-sheet.png" />
      </Frame>
    </div>
  </Tab>

  <Tab title="Device">
    <div className="flex justify-center w-full my-4">
      <Frame className="w-fit mx-auto">
        <img className="mx-auto block h-auto max-w-[400px] w-full" src="https://mintcdn.com/kodelabs/IXjGUtCN1G_ZdIHf/images/mobile-app/kode-os-mobile-fdd-faults-device-list.png?fit=max&auto=format&n=IXjGUtCN1G_ZdIHf&q=85&s=6b57690cabd73567e106fd266fca5c1d" alt="FDD Faults Device view with VAV and FCU fault counts by floor" width="400" height="868" data-path="images/mobile-app/kode-os-mobile-fdd-faults-device-list.png" />
      </Frame>
    </div>

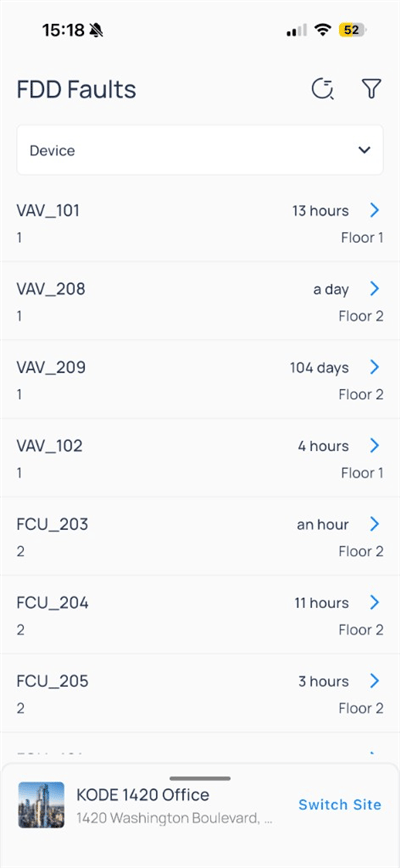
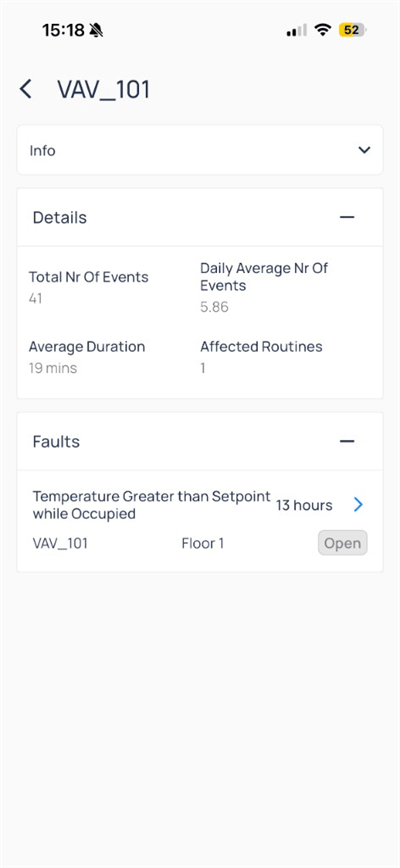
    Rows show device ID, fault count, floor, and duration. Tap a device to see aggregate metrics and its fault list.

    <div className="flex justify-center w-full my-4">
      <Frame className="w-fit mx-auto" caption="Device metrics and faults">
        <img className="mx-auto block h-auto max-w-[400px] w-full" src="https://mintcdn.com/kodelabs/IXjGUtCN1G_ZdIHf/images/mobile-app/kode-os-mobile-fdd-fault-device-faults.png?fit=max&auto=format&n=IXjGUtCN1G_ZdIHf&q=85&s=a0449d3005eccb89f1bba9cd90fd492e" alt="VAV_101 device view with event totals and Temperature Greater than Setpoint fault" width="400" height="868" data-path="images/mobile-app/kode-os-mobile-fdd-fault-device-faults.png" />
      </Frame>
    </div>
  </Tab>

  <Tab title="Routine">
    <div className="flex justify-center w-full my-4">
      <Frame className="w-fit mx-auto">
        <img className="mx-auto block h-auto max-w-[400px] w-full" src="https://mintcdn.com/kodelabs/IXjGUtCN1G_ZdIHf/images/mobile-app/kode-os-mobile-fdd-faults-routine-list.png?fit=max&auto=format&n=IXjGUtCN1G_ZdIHf&q=85&s=c80bea8afc68aff28a4e45aaaad5dbbf" alt="FDD Faults Routine view with sensor failure and temperature routines on Floor 2" width="400" height="868" data-path="images/mobile-app/kode-os-mobile-fdd-faults-routine-list.png" />
      </Frame>
    </div>

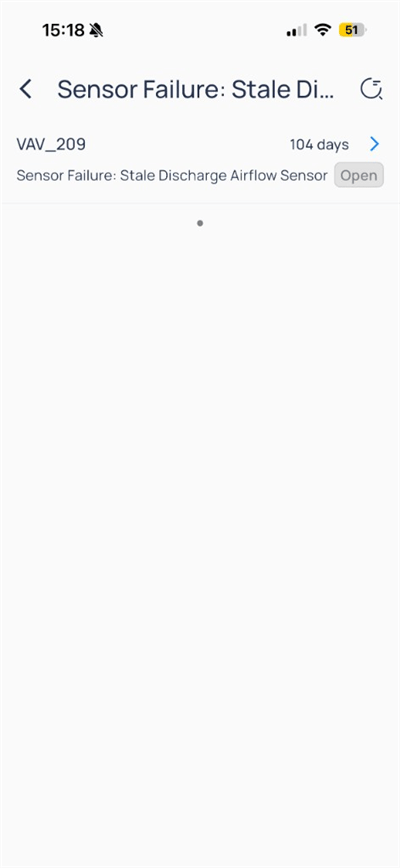
    Tap a routine to see affected devices. Select a device row to open fault detail for that routine.

    <div className="flex justify-center w-full my-4">
      <Frame className="w-fit mx-auto">
        <img className="mx-auto block h-auto max-w-[400px] w-full" src="https://mintcdn.com/kodelabs/IXjGUtCN1G_ZdIHf/images/mobile-app/kode-os-mobile-fdd-fault-routine-entry.png?fit=max&auto=format&n=IXjGUtCN1G_ZdIHf&q=85&s=32ed947a91737f889f3dc8b7492c8314" alt="Routine fault list entry for VAV_209 stale discharge airflow sensor" width="400" height="868" data-path="images/mobile-app/kode-os-mobile-fdd-fault-routine-entry.png" />
      </Frame>
    </div>
  </Tab>
</Tabs>

## Fault detail

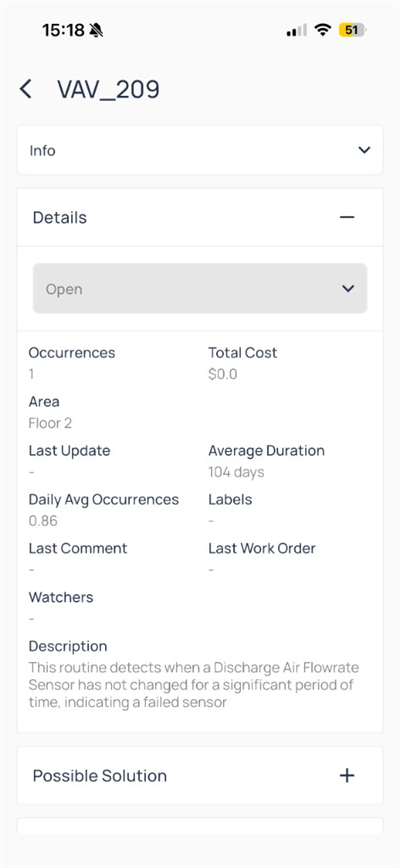
The fault detail page shows status, metrics, and routine logic.
<div className="flex justify-center w-full my-4">
  <Frame className="w-fit mx-auto" caption="Long-running sensor fault">
    <img className="mx-auto block h-auto max-w-[400px] w-full" src="https://mintcdn.com/kodelabs/IXjGUtCN1G_ZdIHf/images/mobile-app/kode-os-mobile-fdd-fault-routine-detail.png?fit=max&auto=format&n=IXjGUtCN1G_ZdIHf&q=85&s=7616ef2c613dd0a77a4904297cffa555" alt="Sensor Failure stale discharge airflow fault for VAV_209 with 104 day duration" width="400" height="868" data-path="images/mobile-app/kode-os-mobile-fdd-fault-routine-detail.png" />
  </Frame>
</div>

| Field                                              | Description                           |
| -------------------------------------------------- | ------------------------------------- |
| `Status`                                           | Open, closed, or other workflow state |
| `Occurrences`                                      | How many times the rule fired         |
| `Total Cost`                                       | Cost rollup when configured           |
| `Area`                                             | Spatial assignment                    |
| `Last Update`                                      | Latest activity timestamp             |
| `Average Duration`                                 | Mean time in fault                    |
| `Daily Avg Occurrences`                            | Trend density                         |
| `Labels` / `Comments` / `Work Orders` / `Watchers` | Collaboration metadata                |
| `Description`                                      | Full routine logic (`Show more`)      |

Expand `Possible Solution` for recommended actions. Change status from the dropdown when your role allows.

### Investigate with trends

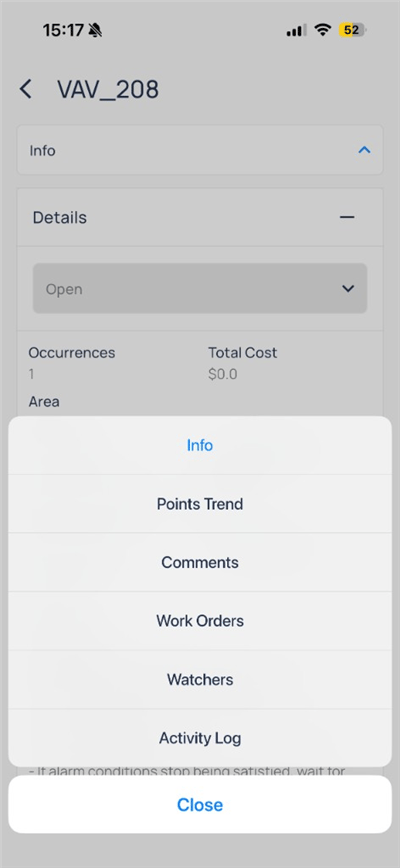
Open the more menu on the fault page:
<div className="flex justify-center w-full my-4">
  <Frame className="w-fit mx-auto">
    <img className="mx-auto block h-auto max-w-[400px] w-full" src="https://mintcdn.com/kodelabs/IXjGUtCN1G_ZdIHf/images/mobile-app/kode-os-mobile-fdd-fault-detail-menu.png?fit=max&auto=format&n=IXjGUtCN1G_ZdIHf&q=85&s=2ed15adc6a8d22c94e97701c46371fc0" alt="Fault menu with Info, Points Trend, Comments, Work Orders, Watchers, and Activity Log" width="400" height="868" data-path="images/mobile-app/kode-os-mobile-fdd-fault-detail-menu.png" />
  </Frame>
</div>

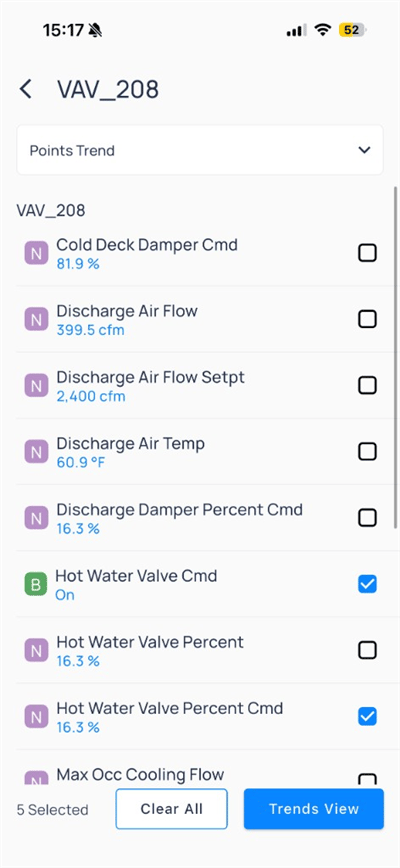
Select `Points Trend`, choose points on the device, then open `Trends View`.
<div className="flex justify-center w-full my-4">
  <Frame className="w-fit mx-auto">
    <img className="mx-auto block h-auto max-w-[400px] w-full" src="https://mintcdn.com/kodelabs/IXjGUtCN1G_ZdIHf/images/mobile-app/kode-os-mobile-fdd-fault-points-trend.png?fit=max&auto=format&n=IXjGUtCN1G_ZdIHf&q=85&s=7e7fda007a96cfd356dab6799f3c5f44" alt="Points Trend for VAV_208 with hot water valve points selected" width="400" height="868" data-path="images/mobile-app/kode-os-mobile-fdd-fault-points-trend.png" />
  </Frame>
</div>

<div className="flex justify-center w-full my-4">
  <Frame className="w-fit mx-auto" caption="Zone temperature and valve command over time">
    <img className="mx-auto block h-auto max-w-[400px] w-full" src="https://mintcdn.com/kodelabs/IXjGUtCN1G_ZdIHf/images/mobile-app/kode-os-mobile-fdd-fault-trends-view.png?fit=max&auto=format&n=IXjGUtCN1G_ZdIHf&q=85&s=3a91c4160cadbb8c98936140b70ce9f5" alt="Trends View for VAV_208 zone temp and hot water valve percent with fault shading" width="400" height="868" data-path="images/mobile-app/kode-os-mobile-fdd-fault-trends-view.png" />
  </Frame>
</div>

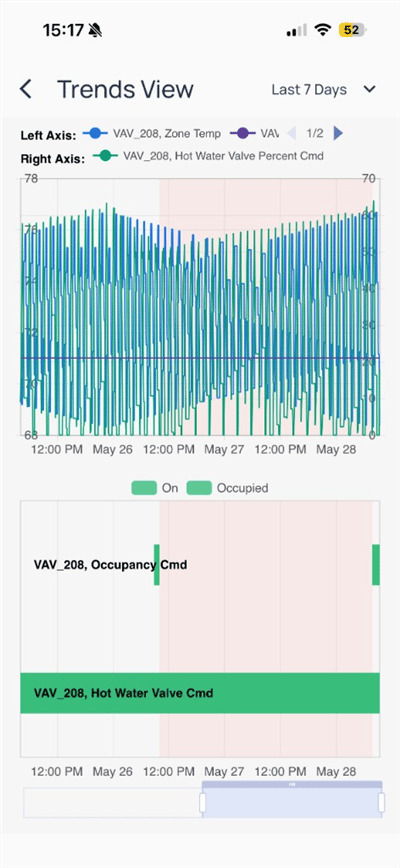
Red shading on the chart marks the fault period. Correlate numeric trends with occupancy and valve state rows at the bottom.

### Collaboration and history

Use the section dropdown below the fault title to switch between `Comments`, `Work Orders`, `Watchers`, and `Activity Log`.

<AccordionGroup>
  <Accordion title="Comments">
    <div className="flex justify-center w-full my-4">
      <Frame className="w-fit mx-auto">
        <img className="mx-auto block h-auto max-w-[400px] w-full" src="https://mintcdn.com/kodelabs/IXjGUtCN1G_ZdIHf/images/mobile-app/kode-os-mobile-fdd-fault-comments.png?fit=max&auto=format&n=IXjGUtCN1G_ZdIHf&q=85&s=9a63905b9d95b52bf1947b5ac6dfe014" alt="Fault Comments for VAV_101 with a sample comment Checking and Enter comment here field" width="332" height="720" data-path="images/mobile-app/kode-os-mobile-fdd-fault-comments.png" />
      </Frame>
    </div>

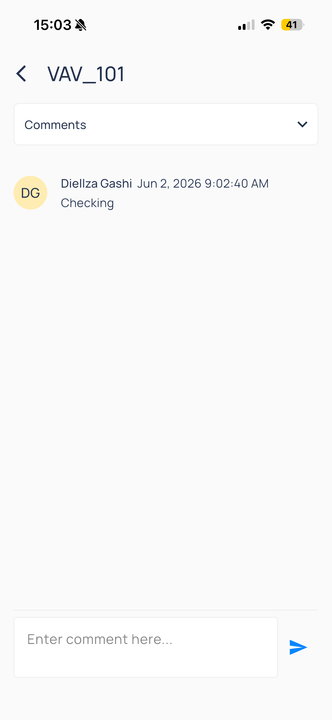
    Add notes for your team in the comment thread. Each entry shows the author, timestamp, and message text.
  </Accordion>

  <Accordion title="Work Orders">
    <div className="flex justify-center w-full my-4">
      <Frame className="w-fit mx-auto" caption="Create Work Order from fault">
        <img className="mx-auto block h-auto max-w-[400px] w-full" src="https://mintcdn.com/kodelabs/IXjGUtCN1G_ZdIHf/images/mobile-app/kode-os-mobile-fdd-fault-work-orders.png?fit=max&auto=format&n=IXjGUtCN1G_ZdIHf&q=85&s=0335cb98387af04fdb9be09eeb056b4b" alt="Fault Work Orders empty state for VAV_101 with Create Work Order button" width="332" height="720" data-path="images/mobile-app/kode-os-mobile-fdd-fault-work-orders.png" />
      </Frame>
    </div>

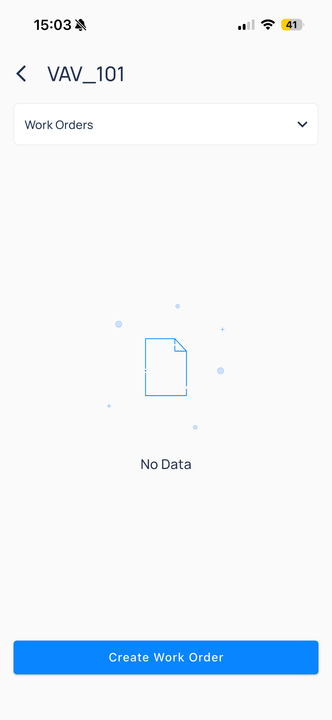
    `Work Orders` lists work orders linked to the fault. Tap `Create Work Order` when no record exists yet.
  </Accordion>

  <Accordion title="Watchers">
    <div className="flex justify-center w-full my-4">
      <Frame className="w-fit mx-auto">
        <img className="mx-auto block h-auto max-w-[400px] w-full" src="https://mintcdn.com/kodelabs/IXjGUtCN1G_ZdIHf/images/mobile-app/kode-os-mobile-fdd-fault-watchers.png?fit=max&auto=format&n=IXjGUtCN1G_ZdIHf&q=85&s=7fabe8729a06cb4ecc062a7d7206c98d" alt="Fault Watchers list for VAV_101 with user checkboxes to subscribe to updates" width="472" height="1024" data-path="images/mobile-app/kode-os-mobile-fdd-fault-watchers.png" />
      </Frame>
    </div>

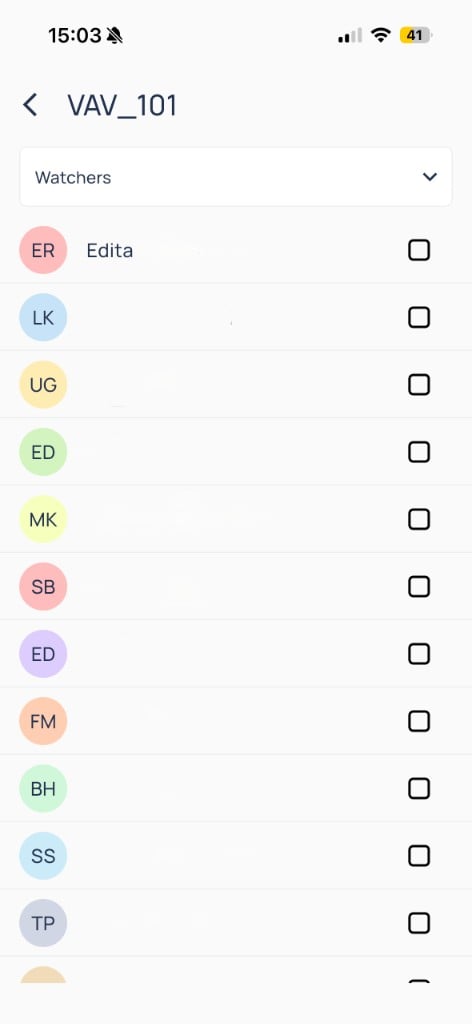
    Select users to watch the fault. Watchers receive notifications when status or activity changes.
  </Accordion>

  <Accordion title="Activity Log">
    <div className="flex justify-center w-full my-4">
      <Frame className="w-fit mx-auto" caption="Comments and status changes">
        <img className="mx-auto block h-auto max-w-[400px] w-full" src="https://mintcdn.com/kodelabs/IXjGUtCN1G_ZdIHf/images/mobile-app/kode-os-mobile-fdd-fault-activity-log.png?fit=max&auto=format&n=IXjGUtCN1G_ZdIHf&q=85&s=11fca527207f8c5427cd6796a9c1c335" alt="Fault Activity Log for VAV_101 showing comment Checking and status updated to IN_PROGRESS" width="332" height="720" data-path="images/mobile-app/kode-os-mobile-fdd-fault-activity-log.png" />
      </Frame>
    </div>

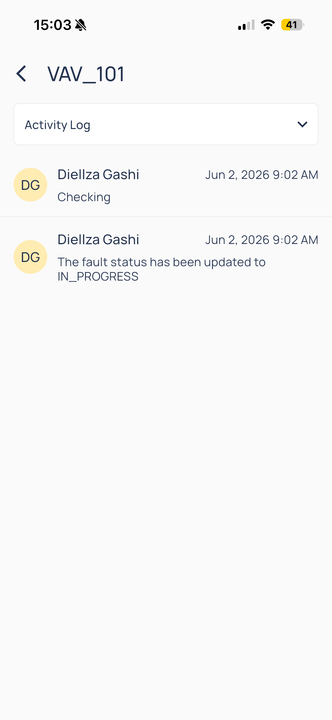
    The log records comments, status updates, and other system actions with author and timestamp.
  </Accordion>
</AccordionGroup>

## Compare to web

| Web capability                    | Mobile               |
| --------------------------------- | -------------------- |
| Faults, device, and routine lists | Yes                  |
| Fault metrics and description     | Yes                  |
| Points trend from fault           | Yes                  |
| Status updates                    | Yes (role-dependent) |
| Bulk export                       | Use web              |
| Routine authoring                 | Use web              |

## Next steps

<CardGroup cols={2}>
  <Card title="FDD overview" icon="stethoscope" href="/products/mobile-app/diagnostics/fdd-overview" arrow={true}>
    Choose the right FDD screen for the job.
  </Card>

  <Card title="Events on mobile" icon="bell" href="/products/mobile-app/events/work-with-events" arrow={true}>
    Filter, acknowledge, and investigate events.
  </Card>

  <Card title="Devices on mobile" icon="hard-drive" href="/products/mobile-app/building/devices" arrow={true}>
    Open equipment, trends, and device actions.
  </Card>
</CardGroup>