> ## Documentation Index
> Fetch the complete documentation index at: https://documentation.kodelabs.com/llms.txt
> Use this file to discover all available pages before exploring further.
# Trends on mobile
> Select source forms, chart points in Trends View, apply filters, and save views on the KODE OS mobile app.
Chart a point's recent history to spot a drift before it becomes a fault. Pick one or more points, then open `Trends View` for synchronized charts. Adjust the time range and interpolation, and save the view for yourself or your building team. This page follows [Trends](/products/kode-os/trends) on the web.
## Open Trends
Reach `Trends` from the building app launcher, equipment menus, system points, or search when enabled.
## Select points to chart
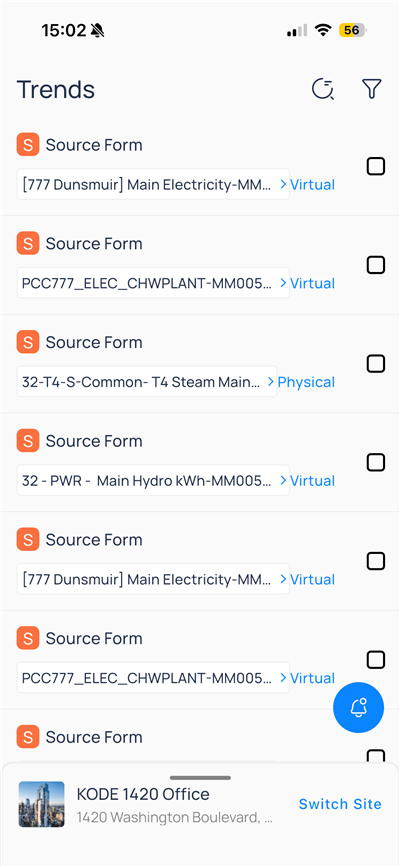
The `Trends` home screen lists point entries. Each row shows the point name with the device name below and a label for the device origin—virtual or original.
| Element | Description |
| ------------------- | ------------------------------------------------ |
| Point row | Point name with device name on the line below |
| Virtual / Original | Whether the device origin is virtual or original |
| Checkbox | Include the series in the next chart |
| Filter icon | Open [Trend filters](#apply-trend-filters) |
| Search/history icon | Find recent or saved selections |
| Footer control | Action |
| -------------- | ------------------------------------ |
| `Cancel` | Clear selection and stay on the list |
| `Trends View` | Open charts for selected series |
## Apply trend filters
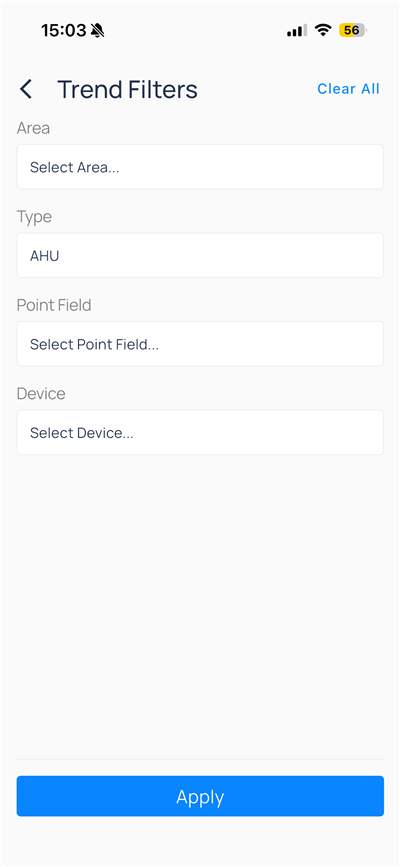
Tap the filter icon on the Trends list to narrow which points appear before you select them.
| Field | Description |
| ------------- | ----------------------------------------------------------- |
| `Area` | Floor or zone |
| `Type` | Equipment ontology (for example, `AHU`) |
| `Point Field` | Signal template (discharge air temp, fan status, and so on) |
| `Device` | Specific equipment instance |
Use `Clear All`, then `Apply` to refresh the list.
## Trends View
Select the points you want to trend from the [Trends home screen](#select-points-to-chart), then tap `Trends View` on the bottom bar.
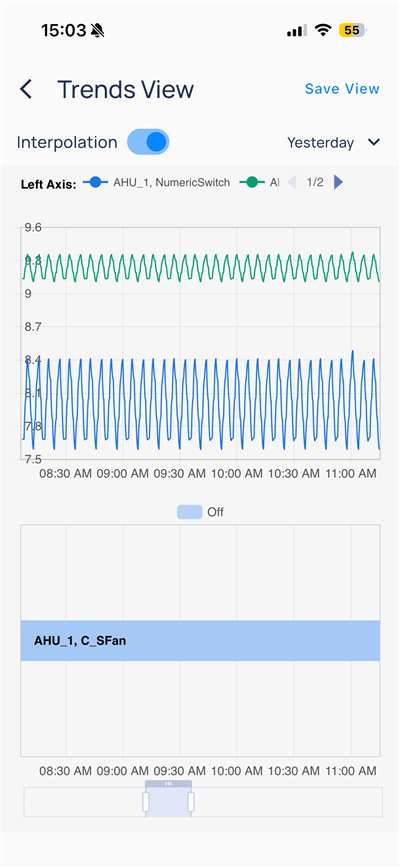
`Trends View` shows stacked charts that share one time axis. Numeric series appear on the top chart; boolean or state series appear on the lower chart.
### Header controls
| Control | Purpose |
| ------------- | --------------------------------------------------- |
| Back | Return to source selection |
| `Save View` | Name and optionally publish the current chart setup |
| Interpolation | Smooth between samples when `On` |
| Time range | Preset or custom window (dropdown) |
### Legend and pagination
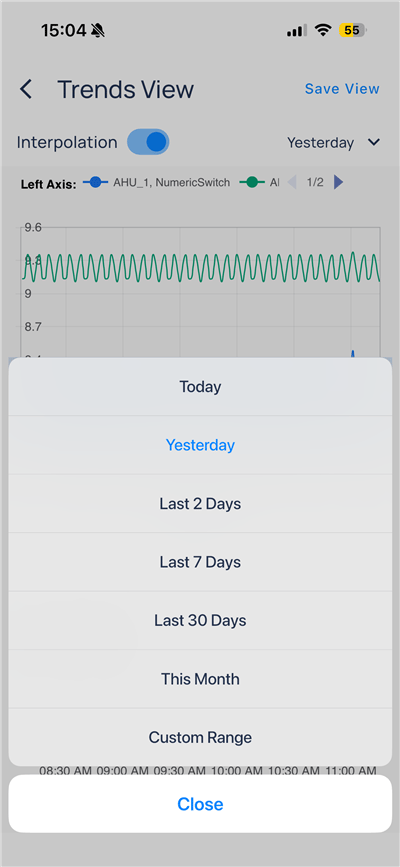
Below the controls, `Left Axis` lists active series (for example, `AHU_1, NumericSwitch` and `AI`). Use `1/2` arrows when more series exist than fit on screen.
### Numeric chart
* Y-axis shows engineering values (for example, 7.5–9.6)
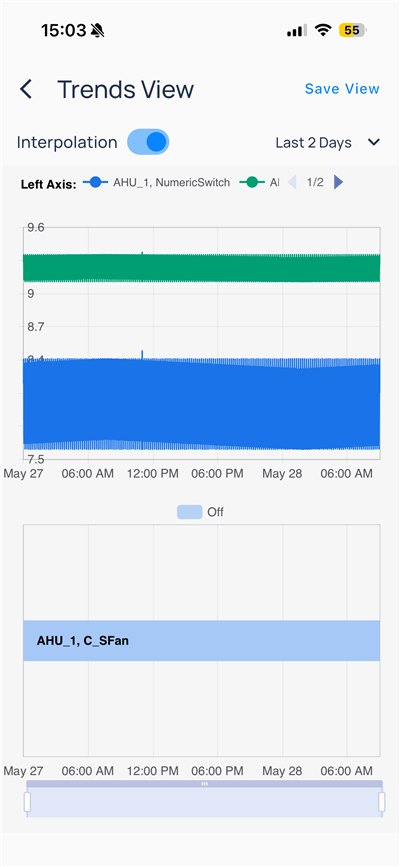
* Multiple series may render as dense bands when sampling is fast
* Pinch or use the bottom range slider to pan and zoom time
### State / boolean chart
The lower chart shows boolean or enum-style points (for example, an AHU fan status) as horizontal bars. A toggle above the chart may label the current state (`Off` in the screenshot).
### Time range presets
Tap the time dropdown to change the window.
| Preset | Typical use |
| ----------------------------- | ---------------------------------------- |
| `Today` / `Yesterday` | Same-day or prior-day troubleshooting |
| `Last 2 Days` / `Last 7 Days` | Recent drift after an alarm |
| `Last 30 Days` / `This Month` | Weekly reviews |
| `Custom Range` | Exact start and end for an investigation |
Select `Close` to return to the chart.
## Save a view
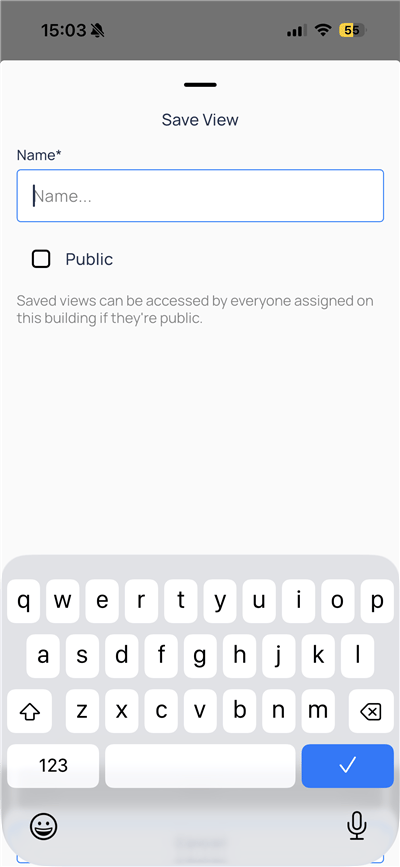
Tap `Save View` to store the current points, range, and interpolation settings.
| Field | Description |
| -------- | ---------------------------------------------------------------- |
| `Name` | Label for the saved view (required) |
| `Public` | When checked, others assigned to the building can open this view |
Saved views complement [Bookmarks](/products/mobile-app/get-started/bookmarks) for personal shortcuts; public views behave like lightweight shared templates on mobile.
## Compare to web
| Capability | Web | Mobile |
| -------------------------------- | ---- | --------------------------- |
| Multi-axis layout and table view | Full | Chart-focused `Trends View` |
| Advanced point configuration | Full | Filter + multi-select |
| Save view (public/private) | Yes | Yes |
| Export CSV | Yes | Not shown on mobile |
## Next steps
Browse status, filters, and point writes.
Switch dashboard, graphic, and widget views.
Browse floors, layers, and spatial triage.