> ## Documentation Index
> Fetch the complete documentation index at: https://documentation.kodelabs.com/llms.txt
> Use this file to discover all available pages before exploring further.
# Data sources
> Connect external building systems to Cloud BMS and monitor the health of your data integrations.
Data sources is a building-level module. Select a building from the [sites list](/products/kode-os/sites-and-map) to access its data sources.
Data sources are the connection points between Cloud BMS and external building systems. Each data source represents a configured integration with a building automation system (BAS), meter, IoT platform, access control system, or other external service. Data sources collect device and point data from these systems into Cloud BMS for monitoring, control, and analytics.
```mermaid actions={false} theme={"theme":{"light":"github-dark","dark":"github-dark"}}
---
config:
theme: neutral
---
flowchart LR
EXT["External System
(BAS, Meter, IoT)"]
DS[Data Source / Connector]
DEV[Devices]
PTS[Points]
EXT -- "protocol
(BACnet, REST, MQTT)" --> DS
DS -- "discovers" --> DEV
DEV -- "contains" --> PTS
classDef sky stroke:#374D7C,fill:#E2EBFF,color:#374D7C
classDef peach stroke:#FBB35A,fill:#FFEFDB,color:#8F632D
classDef rose stroke:#FF5978,fill:#FFDFE5,color:#8E2236
class EXT sky
class DS peach
class DEV,PTS rose
```
## Navigate to data sources
Click `Sites` in the left navigation bar and select the building you want to manage.
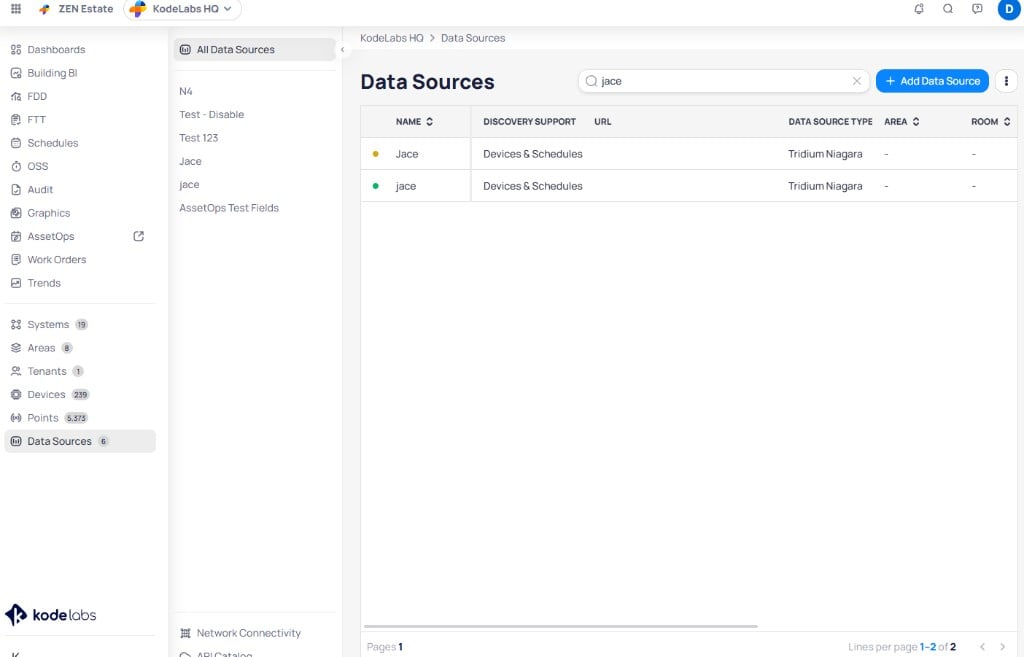
From the left sidebar menu, click `Data Sources`. The data sources list displays all configured connections for the selected site.
 ## Add a new data source
You add data sources by selecting from the API catalog, which organizes available integrations by system type. Cloud BMS supports 200+ integrations across BACnet, Modbus, REST API, MQTT, and other protocols.
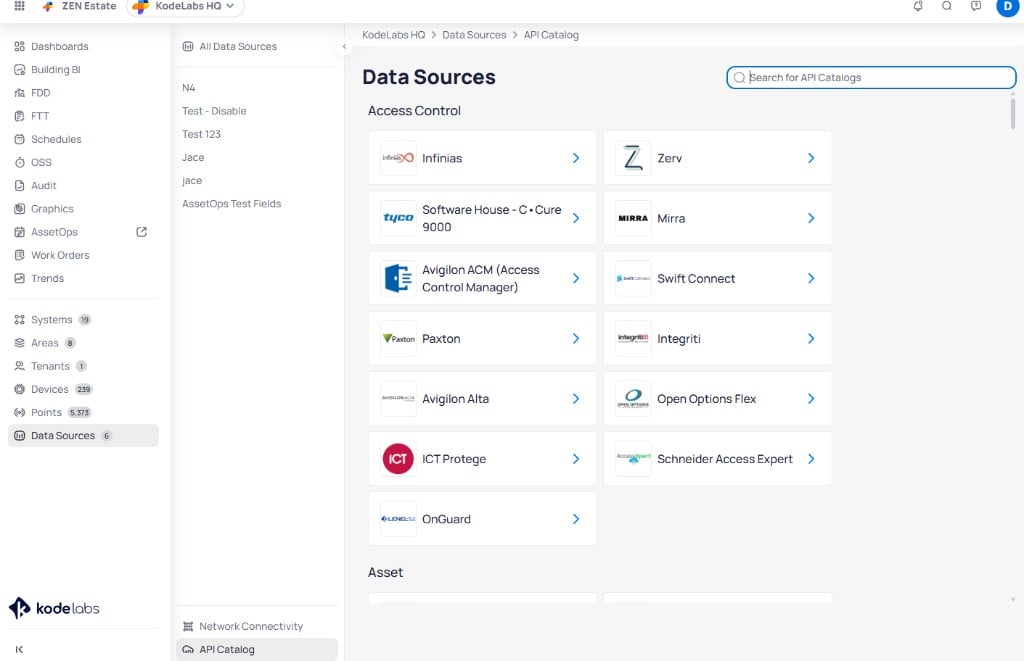
On the `Data Sources` page, click `API Catalog` in the left panel. The catalog displays available integrations organized by category (Access Control, Asset, BAS, Meter, and others). Use the search bar to find a specific integration.
## Add a new data source
You add data sources by selecting from the API catalog, which organizes available integrations by system type. Cloud BMS supports 200+ integrations across BACnet, Modbus, REST API, MQTT, and other protocols.
On the `Data Sources` page, click `API Catalog` in the left panel. The catalog displays available integrations organized by category (Access Control, Asset, BAS, Meter, and others). Use the search bar to find a specific integration.
 Click the integration you want to configure. The integration detail page displays supported entities, data collection schedules, and available fields.
Click `+Add Data Source` in the upper right corner. A three-step wizard opens starting with the `Authentication` step.
Fill in the connection fields specific to the selected integration type.
Click the integration you want to configure. The integration detail page displays supported entities, data collection schedules, and available fields.
Click `+Add Data Source` in the upper right corner. A three-step wizard opens starting with the `Authentication` step.
Fill in the connection fields specific to the selected integration type.
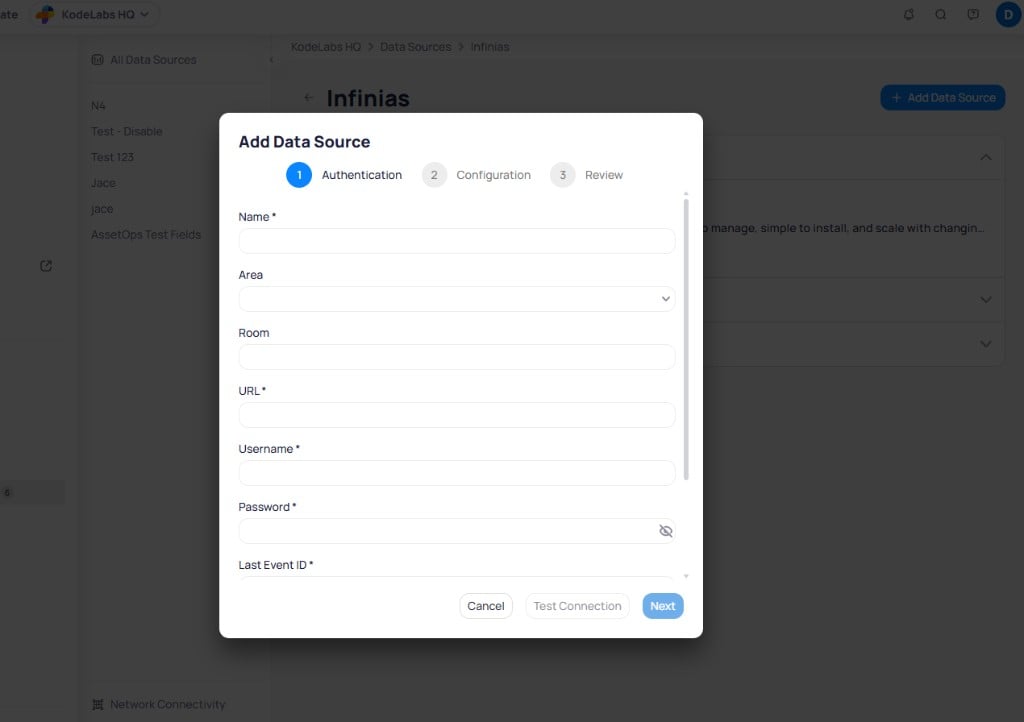 | Field | Description |
| ---------- | -------------------------------------------------------------------------------- |
| `Name` | A descriptive name for this data source (for example, `Lobby BACnet Controller`) |
| `Area` | The building area this data source serves |
| `Room` | The specific room associated with this data source |
| `URL` | The endpoint address for the external system |
| `Username` | Authentication credential for the external system |
| `Password` | Authentication credential for the external system |
For Niagara integrations, install the [Cloud BMS Niagara driver](/products/kode-os/niagara-driver-installation) on the station before you add the connector. Optional scope fields can then narrow discovery:
| Field | Description |
| ------------------- | ------------------------------------------------------------------------------------------------- |
| `Folder` | Limits discovery to devices inside a specific folder in the Niagara station |
| `Devices Root Slot` | Niagara slot path where Cloud BMS begins searching for devices (for example, `slot:/Drivers/...`) |
Use these fields when a station has a large device tree or when multiple buildings share one Supervisor. Narrowing the scope reduces discovery time and makes results easier to review.
Click `Test Connection` to verify your credentials before proceeding. If authentication succeeds, click `Next`.
For APIs that support dynamic ID discovery, Cloud BMS retrieves available Site IDs and Building IDs directly from the API after you verify your credentials. Instead of manually requesting these identifiers from the vendor or client, you can select them from a dynamically loaded list. This capability depends on the external API. Not all integrations support it.
In the `Configuration` step, select which data streams to collect. Toggle individual streams on or off, and set the collection frequency for each.
| Field | Description |
| ---------- | -------------------------------------------------------------------------------- |
| `Name` | A descriptive name for this data source (for example, `Lobby BACnet Controller`) |
| `Area` | The building area this data source serves |
| `Room` | The specific room associated with this data source |
| `URL` | The endpoint address for the external system |
| `Username` | Authentication credential for the external system |
| `Password` | Authentication credential for the external system |
For Niagara integrations, install the [Cloud BMS Niagara driver](/products/kode-os/niagara-driver-installation) on the station before you add the connector. Optional scope fields can then narrow discovery:
| Field | Description |
| ------------------- | ------------------------------------------------------------------------------------------------- |
| `Folder` | Limits discovery to devices inside a specific folder in the Niagara station |
| `Devices Root Slot` | Niagara slot path where Cloud BMS begins searching for devices (for example, `slot:/Drivers/...`) |
Use these fields when a station has a large device tree or when multiple buildings share one Supervisor. Narrowing the scope reduces discovery time and makes results easier to review.
Click `Test Connection` to verify your credentials before proceeding. If authentication succeeds, click `Next`.
For APIs that support dynamic ID discovery, Cloud BMS retrieves available Site IDs and Building IDs directly from the API after you verify your credentials. Instead of manually requesting these identifiers from the vendor or client, you can select them from a dynamically loaded list. This capability depends on the external API. Not all integrations support it.
In the `Configuration` step, select which data streams to collect. Toggle individual streams on or off, and set the collection frequency for each.
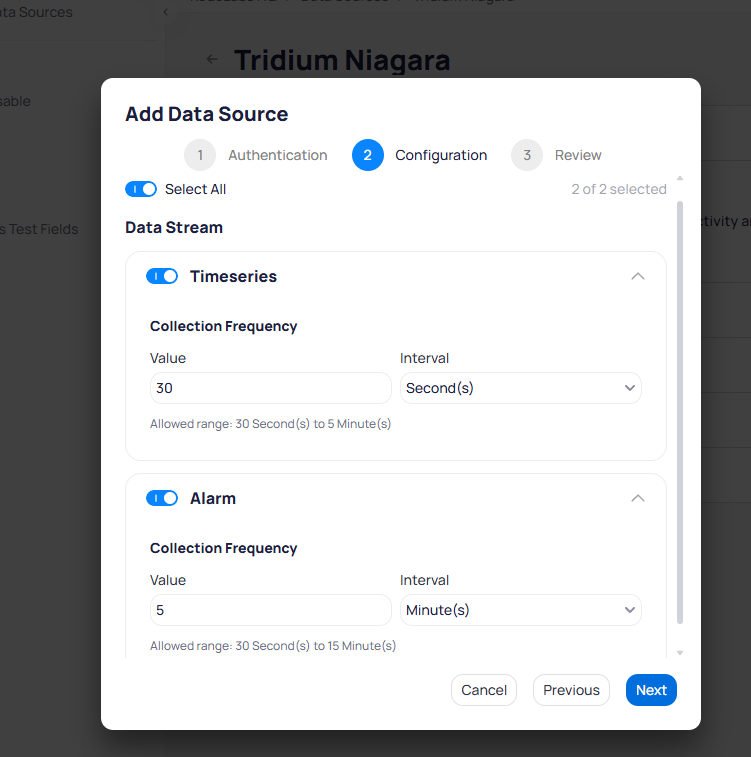 Each data stream displays an allowed frequency range. Set the `Value` and `Interval` (seconds or minutes) within that range. Click `Next` when finished.
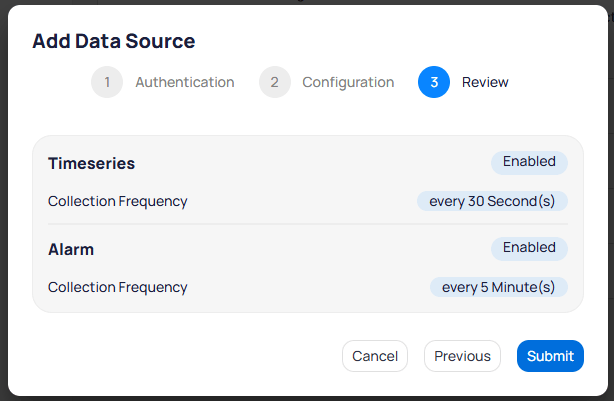
The `Review` step displays a summary of your selected data streams and their collection frequencies. Verify the configuration and click `Submit` to create the data source.
Each data stream displays an allowed frequency range. Set the `Value` and `Interval` (seconds or minutes) within that range. Click `Next` when finished.
The `Review` step displays a summary of your selected data streams and their collection frequencies. Verify the configuration and click `Submit` to create the data source.
 ## Subsystem alarm ingestion
Connectors can ingest native **alarms** from external building systems into the KODE alarm engine. Ingested alarms appear on the [FDD Events](/products/fdd/events) page alongside routine-generated faults. Use this when operators need a single console for BMS alarms instead of switching between KODE and the subsystem interface.
Niagara is the first supported integration. Additional subsystems will follow the same normalized alarm framework.
### Enable alarm collection
When you add or edit a data source, enable the **Alarm** data stream in the **Configuration** step. Set the collection **Value** and **Interval** within the allowed range, then complete the wizard.
Add a new data source from the [API catalog](#add-a-new-data-source), or open an existing connector and select **Edit** from the three-dot menu.
In the **Configuration** step, toggle **Alarm** on and set the collection frequency.
Complete the wizard, then open the connector **Analytics** tab to confirm alarm collection activity. Alarms enabled in the source system should appear on [FDD Events](/products/fdd/events).
Each building requires its own connector configuration. Alarm enablement and disablement remain in the source system. KODE ingests alarms that are active in the source.
### Bi-directional acknowledgment
When ack writeback is supported for the connector, acknowledging an alarm in KODE updates the source system. Acknowledgments made in the source also sync to KODE.
**Ack writeback** prevents unacknowledged alarms from accumulating in the BMS queue, which can exhaust subsystem resources. Operators can acknowledge from KODE without opening the Niagara or BMS console.
### V1 scope
| Included | Not included in V1 |
| ------------------------------------------------------------------------------------------- | --------------------------------------------------------------------------------------- |
| Full visualization of enabled source alarms | Selective ingestion filters (priority, category, name, domain) |
| Bi-directional ack sync (Niagara) | [Notification policy](/products/fdd/notification-policies) routing for subsystem alarms |
| Normalized alarm fields (name, description, category, priority, status, device, timestamps) | Inline UI confirmation of writeback success or failure |
Alarm filtering and notification routing for subsystem alarms are planned for future releases.
Subsystem alarm ingestion does not replace FDD routines. Both can run in parallel while operators transition to KODE as the primary alarm console.
## Connector view
After you add a data source, the connector view provides real-time visibility and control over the integration. Select any data source from the list to open its connector view.
## Subsystem alarm ingestion
Connectors can ingest native **alarms** from external building systems into the KODE alarm engine. Ingested alarms appear on the [FDD Events](/products/fdd/events) page alongside routine-generated faults. Use this when operators need a single console for BMS alarms instead of switching between KODE and the subsystem interface.
Niagara is the first supported integration. Additional subsystems will follow the same normalized alarm framework.
### Enable alarm collection
When you add or edit a data source, enable the **Alarm** data stream in the **Configuration** step. Set the collection **Value** and **Interval** within the allowed range, then complete the wizard.
Add a new data source from the [API catalog](#add-a-new-data-source), or open an existing connector and select **Edit** from the three-dot menu.
In the **Configuration** step, toggle **Alarm** on and set the collection frequency.
Complete the wizard, then open the connector **Analytics** tab to confirm alarm collection activity. Alarms enabled in the source system should appear on [FDD Events](/products/fdd/events).
Each building requires its own connector configuration. Alarm enablement and disablement remain in the source system. KODE ingests alarms that are active in the source.
### Bi-directional acknowledgment
When ack writeback is supported for the connector, acknowledging an alarm in KODE updates the source system. Acknowledgments made in the source also sync to KODE.
**Ack writeback** prevents unacknowledged alarms from accumulating in the BMS queue, which can exhaust subsystem resources. Operators can acknowledge from KODE without opening the Niagara or BMS console.
### V1 scope
| Included | Not included in V1 |
| ------------------------------------------------------------------------------------------- | --------------------------------------------------------------------------------------- |
| Full visualization of enabled source alarms | Selective ingestion filters (priority, category, name, domain) |
| Bi-directional ack sync (Niagara) | [Notification policy](/products/fdd/notification-policies) routing for subsystem alarms |
| Normalized alarm fields (name, description, category, priority, status, device, timestamps) | Inline UI confirmation of writeback success or failure |
Alarm filtering and notification routing for subsystem alarms are planned for future releases.
Subsystem alarm ingestion does not replace FDD routines. Both can run in parallel while operators transition to KODE as the primary alarm console.
## Connector view
After you add a data source, the connector view provides real-time visibility and control over the integration. Select any data source from the list to open its connector view.
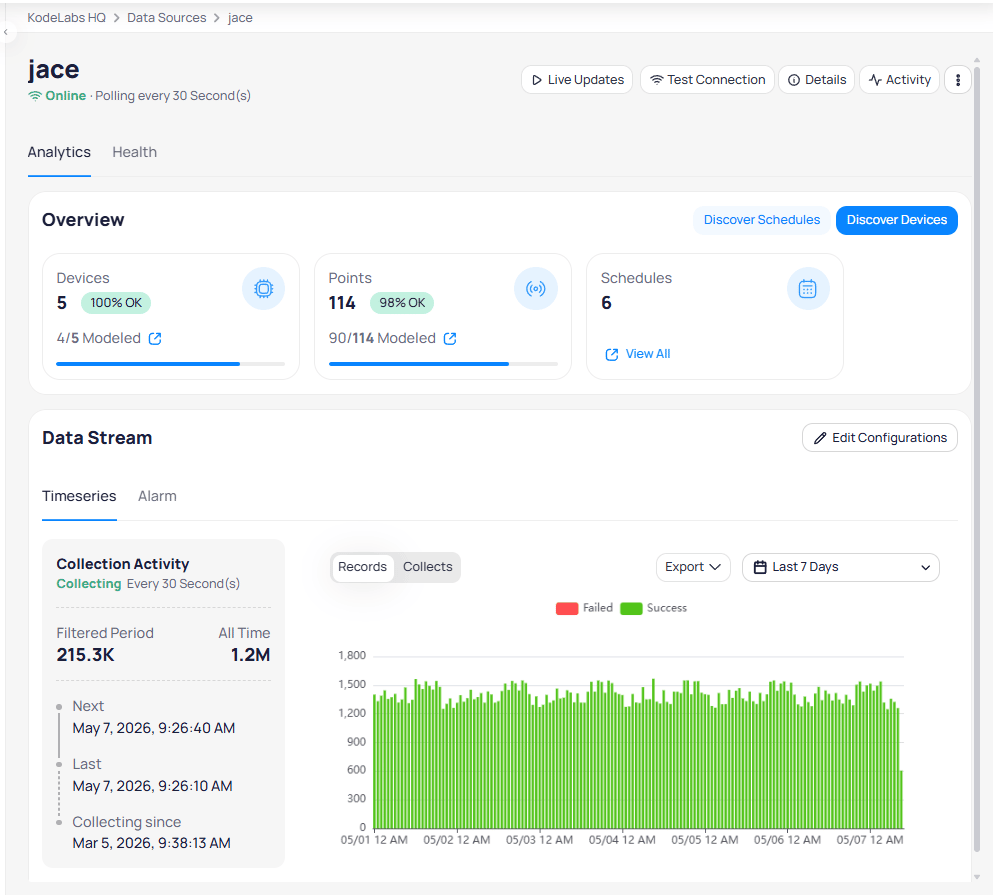 The upper-right corner of the connector view provides these controls:
* **Live Updates** enables real-time monitoring of API requests
* **Test Connection** verifies the data source is reachable and credentials are valid
* **Details** displays the connection configuration
* **Activity** opens a panel showing a log of recent actions and credential changes
The status badge in the upper-left of the connector view reflects successful data collection. It is not the same as connectivity. A connector can pass `Test Connection` and still show collection problems.
The upper-right corner of the connector view provides these controls:
* **Live Updates** enables real-time monitoring of API requests
* **Test Connection** verifies the data source is reachable and credentials are valid
* **Details** displays the connection configuration
* **Activity** opens a panel showing a log of recent actions and credential changes
The status badge in the upper-left of the connector view reflects successful data collection. It is not the same as connectivity. A connector can pass `Test Connection` and still show collection problems.
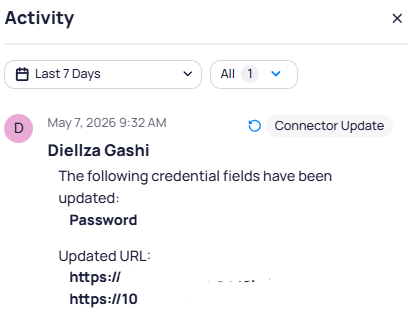 The three-dot menu in the connector view provides additional options:
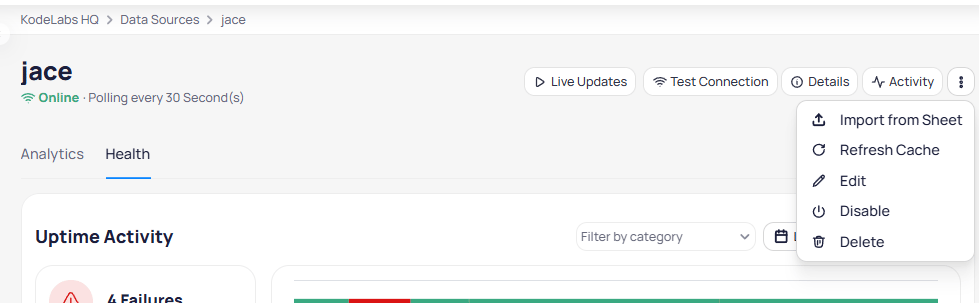 * **Import from Sheet** imports devices and points from a spreadsheet before or after connectivity is established (see [Import devices and points from a sheet](#import-devices-and-points-from-a-sheet))
* **Refresh Cache** reloads cached data from the external system
* **Edit** opens the data source configuration for modification
* **Disable** temporarily pauses data collection without deleting the data source
* **Delete** permanently removes the data source
### Analytics tab
The `Analytics` tab displays data collection metrics and discovery statistics.
Use the **Overview** section to see:
* **Devices** discovered, with a health status badge and modeled-versus-total count
* **Points** discovered, with modeled-versus-total breakdown
* **Schedules** discovered from the external system
Use the **Data Stream** section to monitor collection activity:
* **Collection Activity** shows total items collected in the filtered period and all time, with timestamps for the next collection, last collection, and collecting-since date
* **Data Stream Graph** displays collection activity over time with green bars for successful collections and red bars for failures
The data stream chart supports two views. Use the `Records` and `Collects` tabs to switch between them.
* **Records** shows how many data records were gathered from the API during each time period. Use this to verify that the external system is sending data as expected.
* **Collects** shows how many times Cloud BMS attempted to collect data. Use this to verify that collection is running on schedule.
* **Import from Sheet** imports devices and points from a spreadsheet before or after connectivity is established (see [Import devices and points from a sheet](#import-devices-and-points-from-a-sheet))
* **Refresh Cache** reloads cached data from the external system
* **Edit** opens the data source configuration for modification
* **Disable** temporarily pauses data collection without deleting the data source
* **Delete** permanently removes the data source
### Analytics tab
The `Analytics` tab displays data collection metrics and discovery statistics.
Use the **Overview** section to see:
* **Devices** discovered, with a health status badge and modeled-versus-total count
* **Points** discovered, with modeled-versus-total breakdown
* **Schedules** discovered from the external system
Use the **Data Stream** section to monitor collection activity:
* **Collection Activity** shows total items collected in the filtered period and all time, with timestamps for the next collection, last collection, and collecting-since date
* **Data Stream Graph** displays collection activity over time with green bars for successful collections and red bars for failures
The data stream chart supports two views. Use the `Records` and `Collects` tabs to switch between them.
* **Records** shows how many data records were gathered from the API during each time period. Use this to verify that the external system is sending data as expected.
* **Collects** shows how many times Cloud BMS attempted to collect data. Use this to verify that collection is running on schedule.
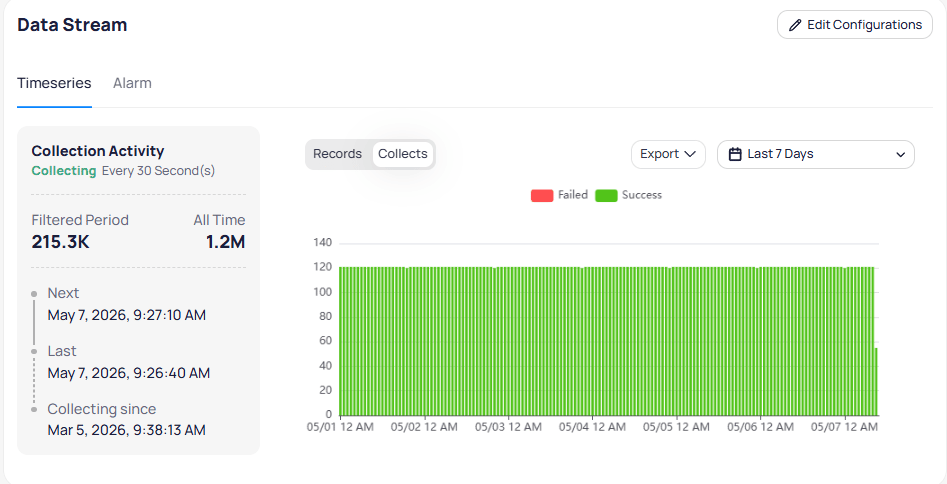 If the `Collects` chart shows consistent activity but `Records` shows zero, the collection is running correctly but the external system has no new data to send. If `Collects` drops below the expected count (for example, fewer than 12 per hour for a five-minute collection frequency), investigate whether the connection or the collection process is experiencing issues.
For Niagara timeseries streams, Cloud BMS polls point values every 30 seconds and stores a new record when the value changes. If the value stays unchanged, Cloud BMS records it again after one hour to confirm continuity.
Use **Pause Collection** on an individual data stream to stop collection without disabling the full connector. Resume collection from the same controls when you are ready.
Use the `Export` button to download collection data, and the date range selector to filter the chart to specific time periods.
Click `Live Updates` to enable real-time monitoring of API requests. Every time Cloud BMS makes a request to the external system, the screen refreshes with the latest data. This is useful for debugging or real-time monitoring of a specific data source.
### Modify data collection frequency
On the `Analytics` tab, go to the `Data Stream` section and click `Edit Configurations`. The `Edit Data Source` dialog opens with data stream settings.
Toggle individual data streams on or off using the `Select All` toggle or individual stream toggles. For each enabled stream, set the `Value` and `Interval` within the allowed range.
If the `Collects` chart shows consistent activity but `Records` shows zero, the collection is running correctly but the external system has no new data to send. If `Collects` drops below the expected count (for example, fewer than 12 per hour for a five-minute collection frequency), investigate whether the connection or the collection process is experiencing issues.
For Niagara timeseries streams, Cloud BMS polls point values every 30 seconds and stores a new record when the value changes. If the value stays unchanged, Cloud BMS records it again after one hour to confirm continuity.
Use **Pause Collection** on an individual data stream to stop collection without disabling the full connector. Resume collection from the same controls when you are ready.
Use the `Export` button to download collection data, and the date range selector to filter the chart to specific time periods.
Click `Live Updates` to enable real-time monitoring of API requests. Every time Cloud BMS makes a request to the external system, the screen refreshes with the latest data. This is useful for debugging or real-time monitoring of a specific data source.
### Modify data collection frequency
On the `Analytics` tab, go to the `Data Stream` section and click `Edit Configurations`. The `Edit Data Source` dialog opens with data stream settings.
Toggle individual data streams on or off using the `Select All` toggle or individual stream toggles. For each enabled stream, set the `Value` and `Interval` within the allowed range.
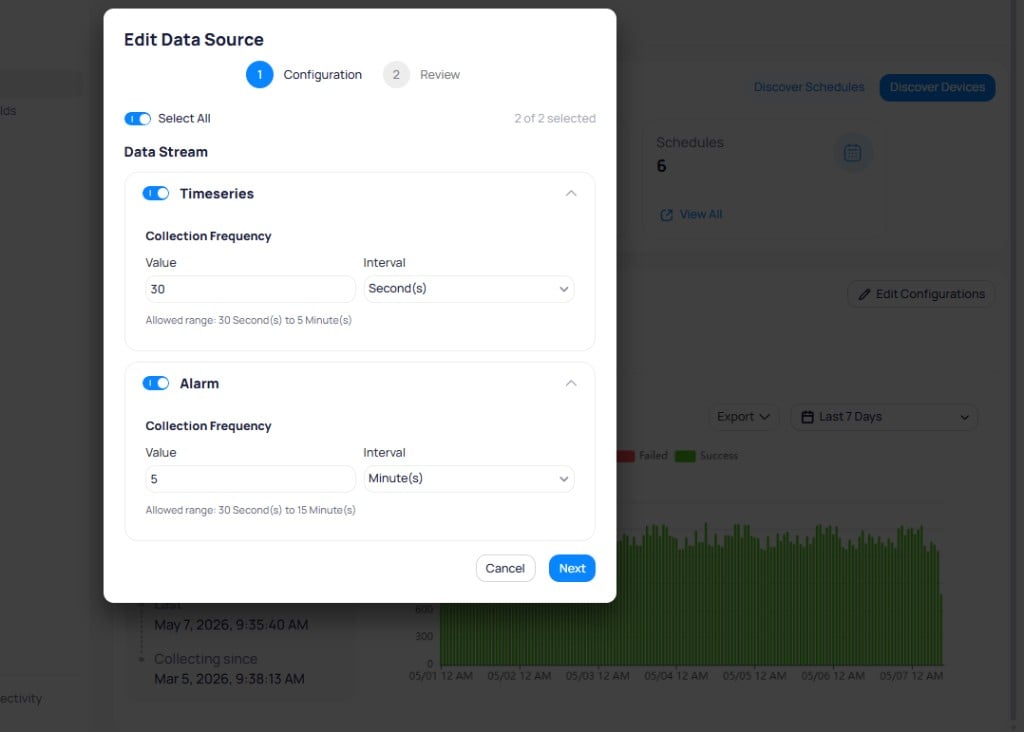 Click `Next` to review your changes, then click `Submit` to apply the updated configuration.
### Health tab
The `Health` tab provides a real-time overview of the connector's operational status.
If a data source is offline, open the connector `Health` tab and note the error category. Follow the suggested actions in the [error category reference](#error-category-reference).
Click `Next` to review your changes, then click `Submit` to apply the updated configuration.
### Health tab
The `Health` tab provides a real-time overview of the connector's operational status.
If a data source is offline, open the connector `Health` tab and note the error category. Follow the suggested actions in the [error category reference](#error-category-reference).
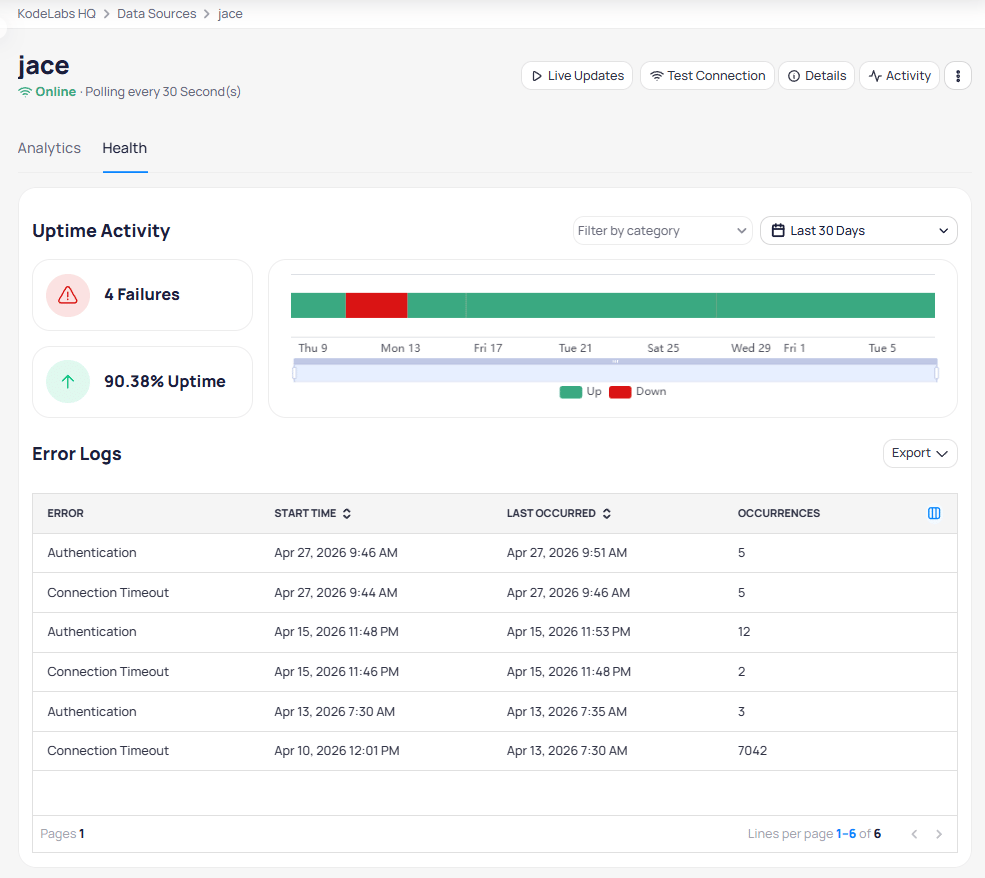 Use the **Uptime Activity** section to monitor:
* **Failures** count in the selected date range
* **Uptime** percentage over the selected period
* **Uptime Graph** with color-coded bars showing periods of uptime (green) and downtime (red)
Use the `Filter by category` dropdown and the date range selector to narrow results to specific error types or time periods.
Use the **Error Logs** section to diagnose issues:
* Each error entry displays the error type, start time, last occurred timestamp, and occurrence count
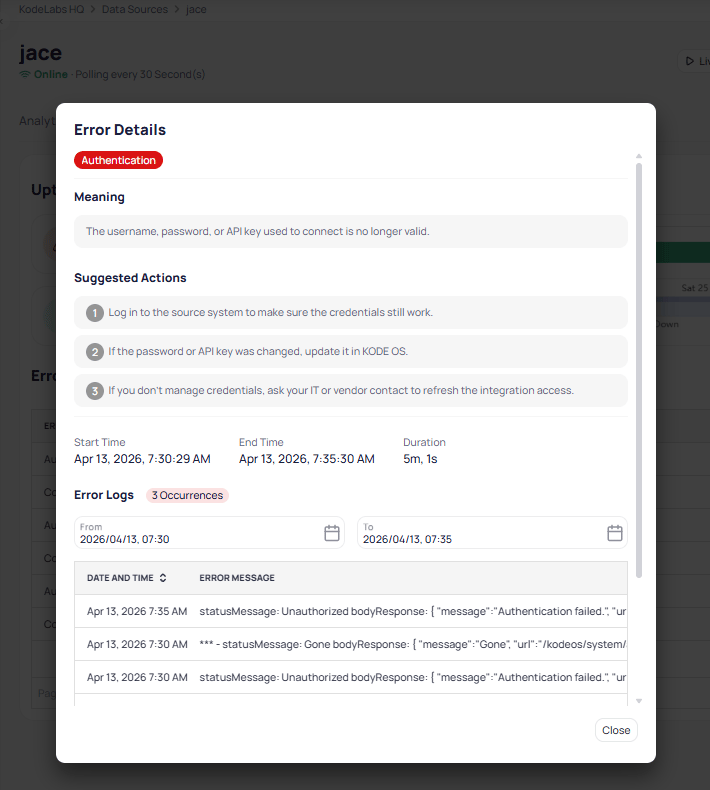
* Click an error entry to open the `Error Details` dialog with the error meaning, suggested actions, start and end times, duration, and individual error log messages with their timestamps
* If a data source goes up and down repeatedly, all distinct error occurrences appear in the log
* Use the `Export` button to download the raw error list for further assessment or to share with external parties
Use the **Uptime Activity** section to monitor:
* **Failures** count in the selected date range
* **Uptime** percentage over the selected period
* **Uptime Graph** with color-coded bars showing periods of uptime (green) and downtime (red)
Use the `Filter by category` dropdown and the date range selector to narrow results to specific error types or time periods.
Use the **Error Logs** section to diagnose issues:
* Each error entry displays the error type, start time, last occurred timestamp, and occurrence count
* Click an error entry to open the `Error Details` dialog with the error meaning, suggested actions, start and end times, duration, and individual error log messages with their timestamps
* If a data source goes up and down repeatedly, all distinct error occurrences appear in the log
* Use the `Export` button to download the raw error list for further assessment or to share with external parties
 ### Error category reference
Each error in the Health tab falls into one of the following categories. Click a category to see its meaning and suggested actions.
The connector tried to reach the external system but did not get a response in time.
**Suggested actions:**
1. Make sure the external system or software is running normally.
2. Ask your IT team if there were any internet or firewall issues.
3. If the system is fine but the error continues, let your IT team or system vendor know.
The external system took too long to answer.
**Suggested actions:**
1. Wait a few minutes. The system may be busy or syncing data.
2. Check if others using the same system are noticing slowness.
3. If it happens often, let your IT team or vendor know that the system is responding slowly.
The link to the external system was cut off during communication.
**Suggested actions:**
1. Check that your internet connection is stable.
2. Ask IT if there were any brief network drops or server restarts.
3. If it happens frequently, ask IT to review the connection settings for stability.
A secure connection could not be established between systems.
**Suggested actions:**
1. Ask your IT or security team to check if the system's security certificate is still valid.
2. Make sure the system's website or address uses `https://` and loads normally.
3. If it is a vendor-managed system, inform their support team about the security link issue.
Cloud BMS cannot reach the system at all.
**Suggested actions:**
1. Check if the system can be opened or accessed from your computer.
2. If it only works when you are on VPN, make sure your VPN is active.
3. If it is still not reachable, ask your IT team to check the network or firewall.
A service that helps connect systems is currently offline.
**Suggested actions:**
1. Wait a few minutes. It may come back automatically.
2. Ask your IT team if any network services or proxies were restarted.
3. If this happens often, let IT know so they can review the network setup.
The secure tunnel between Cloud BMS and your site is disconnected.
**Suggested actions:**
1. Check that your VPN is active and connected.
2. If managed by your IT team, ask if there were any VPN restarts or outages.
3. If the VPN is managed by KODE, it should reconnect automatically. Monitor if it stays down for an extended period.
The connected system (such as your BAS, CMMS, or CCTV server) is offline.
**Suggested actions:**
1. Check if you can log in to that system directly.
2. Ask the system owner or vendor if they are performing maintenance.
3. If it is supposed to be running, ask your IT or the vendor to restart it.
The username, password, or API key used to connect is no longer valid.
**Suggested actions:**
1. Log in to the source system to make sure the credentials still work.
2. If the password or API key was changed, update it in Cloud BMS.
3. If you do not manage credentials, ask your IT or vendor contact to refresh the integration access.
The local device or gateway that connects your system to Cloud BMS is not responding.
**Suggested actions:**
1. Make sure the gateway or device is powered on and connected to the network.
2. Ask your on-site IT to confirm it is online and using the correct network cable or Wi-Fi.
3. If it keeps disconnecting, the site's IT or vendor should inspect the device.
## Monitor data source health
The data sources list shows the status of each connection at a glance. Key health indicators include:
* **Online/Offline status** reflects whether the data source is actively communicating
* **Communication score** indicates the reliability of the connection over time
* **Device count** shows how many devices are discovered through this data source
* **Last collection** timestamp shows when data was most recently gathered
## Manage data sources
### Bulk actions
Click the three-dot menu at the top of the data sources list to access bulk operations.
### Error category reference
Each error in the Health tab falls into one of the following categories. Click a category to see its meaning and suggested actions.
The connector tried to reach the external system but did not get a response in time.
**Suggested actions:**
1. Make sure the external system or software is running normally.
2. Ask your IT team if there were any internet or firewall issues.
3. If the system is fine but the error continues, let your IT team or system vendor know.
The external system took too long to answer.
**Suggested actions:**
1. Wait a few minutes. The system may be busy or syncing data.
2. Check if others using the same system are noticing slowness.
3. If it happens often, let your IT team or vendor know that the system is responding slowly.
The link to the external system was cut off during communication.
**Suggested actions:**
1. Check that your internet connection is stable.
2. Ask IT if there were any brief network drops or server restarts.
3. If it happens frequently, ask IT to review the connection settings for stability.
A secure connection could not be established between systems.
**Suggested actions:**
1. Ask your IT or security team to check if the system's security certificate is still valid.
2. Make sure the system's website or address uses `https://` and loads normally.
3. If it is a vendor-managed system, inform their support team about the security link issue.
Cloud BMS cannot reach the system at all.
**Suggested actions:**
1. Check if the system can be opened or accessed from your computer.
2. If it only works when you are on VPN, make sure your VPN is active.
3. If it is still not reachable, ask your IT team to check the network or firewall.
A service that helps connect systems is currently offline.
**Suggested actions:**
1. Wait a few minutes. It may come back automatically.
2. Ask your IT team if any network services or proxies were restarted.
3. If this happens often, let IT know so they can review the network setup.
The secure tunnel between Cloud BMS and your site is disconnected.
**Suggested actions:**
1. Check that your VPN is active and connected.
2. If managed by your IT team, ask if there were any VPN restarts or outages.
3. If the VPN is managed by KODE, it should reconnect automatically. Monitor if it stays down for an extended period.
The connected system (such as your BAS, CMMS, or CCTV server) is offline.
**Suggested actions:**
1. Check if you can log in to that system directly.
2. Ask the system owner or vendor if they are performing maintenance.
3. If it is supposed to be running, ask your IT or the vendor to restart it.
The username, password, or API key used to connect is no longer valid.
**Suggested actions:**
1. Log in to the source system to make sure the credentials still work.
2. If the password or API key was changed, update it in Cloud BMS.
3. If you do not manage credentials, ask your IT or vendor contact to refresh the integration access.
The local device or gateway that connects your system to Cloud BMS is not responding.
**Suggested actions:**
1. Make sure the gateway or device is powered on and connected to the network.
2. Ask your on-site IT to confirm it is online and using the correct network cable or Wi-Fi.
3. If it keeps disconnecting, the site's IT or vendor should inspect the device.
## Monitor data source health
The data sources list shows the status of each connection at a glance. Key health indicators include:
* **Online/Offline status** reflects whether the data source is actively communicating
* **Communication score** indicates the reliability of the connection over time
* **Device count** shows how many devices are discovered through this data source
* **Last collection** timestamp shows when data was most recently gathered
## Manage data sources
### Bulk actions
Click the three-dot menu at the top of the data sources list to access bulk operations.
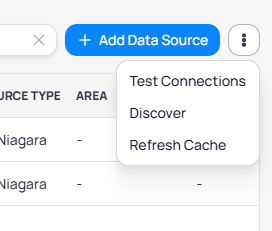 * **Test Connections** tests connectivity for all data sources at once
* **Discover** triggers [device discovery](/products/kode-os/device-discovery) across all data sources
* **Refresh Cache** clears and reloads cached data from all connected systems
### Individual data source actions
Click the three-dot menu on any data source row to access actions for that connection.
* **Test Connections** tests connectivity for all data sources at once
* **Discover** triggers [device discovery](/products/kode-os/device-discovery) across all data sources
* **Refresh Cache** clears and reloads cached data from all connected systems
### Individual data source actions
Click the three-dot menu on any data source row to access actions for that connection.
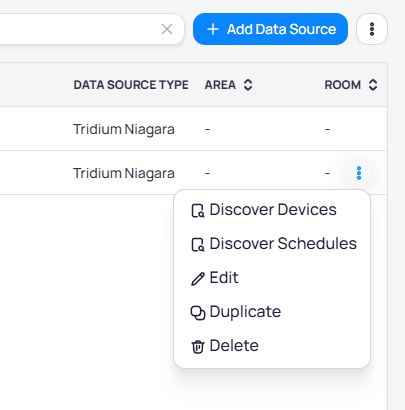 * **Discover Devices** triggers [device discovery](/products/kode-os/device-discovery) for this data source
* **Discover Schedules** discovers schedules from the external system
* **Edit** opens the data source configuration for modification
* **Duplicate** creates a copy of the data source with the same settings
* **Delete** removes the data source and its associated data
Deleting a data source removes its associated devices and points from Cloud BMS. Verify that no active dashboards, schedules, or analytics depend on this data source before deleting.
## Import devices and points from a sheet
You can import devices and points into Cloud BMS using a structured spreadsheet, even before the data source connection is established. This unblocks deployment work such as templating, ontology mapping, and graphics while site connectivity (VPN, firewall, routing) is still in progress.
Once the data source is connected and discovery runs, previously imported devices and points are treated as existing records and begin collecting data automatically.
Until the data source is connected and discovery completes, imported devices and points have no live values or history. The spreadsheet import uses the same identifiers that discovery produces, so merging happens automatically.
### Import workflow
Navigate to the data source connector view, click the three-dot menu, and select `Import from Sheet`.
* **Discover Devices** triggers [device discovery](/products/kode-os/device-discovery) for this data source
* **Discover Schedules** discovers schedules from the external system
* **Edit** opens the data source configuration for modification
* **Duplicate** creates a copy of the data source with the same settings
* **Delete** removes the data source and its associated data
Deleting a data source removes its associated devices and points from Cloud BMS. Verify that no active dashboards, schedules, or analytics depend on this data source before deleting.
## Import devices and points from a sheet
You can import devices and points into Cloud BMS using a structured spreadsheet, even before the data source connection is established. This unblocks deployment work such as templating, ontology mapping, and graphics while site connectivity (VPN, firewall, routing) is still in progress.
Once the data source is connected and discovery runs, previously imported devices and points are treated as existing records and begin collecting data automatically.
Until the data source is connected and discovery completes, imported devices and points have no live values or history. The spreadsheet import uses the same identifiers that discovery produces, so merging happens automatically.
### Import workflow
Navigate to the data source connector view, click the three-dot menu, and select `Import from Sheet`.
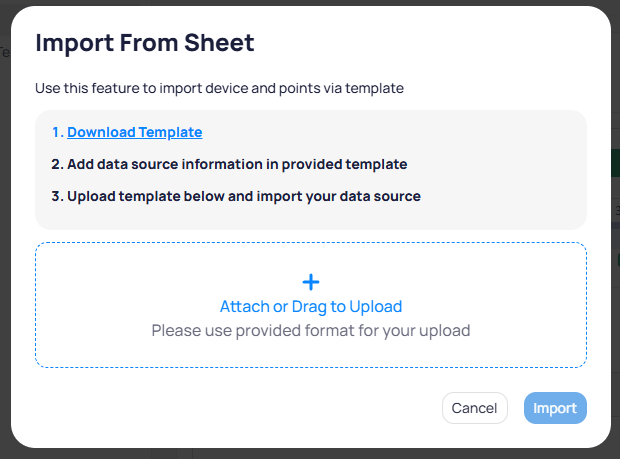 Click `Download Template` in the import dialog. The template includes columns for device identifiers, point identifiers, metadata, and ontology fields.
Populate the template with device and point data exported from the external system (commonly Niagara). The following columns are required:
| Column | Description |
| ---------------------- | ----------------------------------------------------- |
| `Device External ID` | The unique device identifier from the external system |
| `Device External Path` | The full path to the device in the external system |
| `Device Name` | A human-readable name for the device |
| `Point External ID` | The unique point identifier from the external system |
| `Point External Path` | The full path to the point in the external system |
| `Point Name` | A human-readable name for the point |
| `Point Kind` | The point data type (`Number`, `Str`, or `Bool`) |
You can also include optional columns for device metadata (`Area`, `Location`, `Zone`, `Device Type`) and point ontology fields (`Ontology Field`, `Display Name`, `Precision`, `COV Tolerance`, `Default Graph`, `Ontology Unit`).
You can complete templating and metadata assignment directly in the spreadsheet instead of using the UI. This is faster for large sites with many devices.
Upload the completed `.xlsx` file and click `Import`. The import runs as a background job with validation before any data is written.
Only one import job can run per data source at a time. Different data sources on the same building can run imports concurrently.
### Re-upload to update existing records
Re-uploading a sheet is fully supported. The system uses a smart upsert approach to decide whether to create or update records.
* New device external IDs are created as new devices
* Existing devices can only have `Area`, `Location`, and `Zone` updated through re-upload
* All other device fields remain unchanged
* New point external IDs are created and assigned to the appropriate device
* Existing points are not overwritten
* `Area`, `Location`, and `Zone` changes on the parent device cascade to all of its points
* New virtual device names are created as new virtual devices
* Existing virtual device names are reused, and their `Area`, `Location`, and `Zone` can be updated
* Points with a `Virtual Device Name` value are assigned to that virtual device; points without one remain on the base device
### Start collection after connectivity
Once site connectivity is established:
1. Run `Discover Devices` on the data source.
2. Imported devices appear as existing records during discovery.
3. After discovery completes, points begin collecting data normally.
## Troubleshoot connection failures
When a data source goes offline, use the following approach to identify the issue.
A connector can show **Online** while site VPN, gateway, or point data still fails. Treat list status, Health errors, and on-site VPN state as separate checks. Recent IP or modem changes often explain both tunnel and device issues.
Open the connector view and navigate to the `Health` tab. Review the uptime graph and error logs for recent failures.
Click individual error entries to see the category and recommended actions. See the [error category reference](#error-category-reference) for a full list of categories, meanings, and suggested actions.
Click `Test Connection` to verify that Cloud BMS can reach the external system. A failed test confirms the issue is at the connection level.
Confirm that the external controller, gateway, or server is powered on and connected to the network. Check for IP address changes, credential rotations, or firewall modifications.
Brief connectivity alerts sometimes clear within a few minutes with no data loss. If the Health tab shows a short outage that already recovered, confirm devices and points stayed online before escalating.
Cloud BMS maintains the VPN tunnel and platform uptime on its end. Connectivity failures at the device, controller, or BMS server level are typically resolved by checking the on-site infrastructure. Contact KODE Labs support at [support@kodelabs.com](mailto:support@kodelabs.com) if you need assistance with troubleshooting.
## Next steps
View, acknowledge, and investigate subsystem alarms alongside routine events.
Scan data sources to register devices and points in Cloud BMS.
View and manage the equipment discovered through your data sources.
Click `Download Template` in the import dialog. The template includes columns for device identifiers, point identifiers, metadata, and ontology fields.
Populate the template with device and point data exported from the external system (commonly Niagara). The following columns are required:
| Column | Description |
| ---------------------- | ----------------------------------------------------- |
| `Device External ID` | The unique device identifier from the external system |
| `Device External Path` | The full path to the device in the external system |
| `Device Name` | A human-readable name for the device |
| `Point External ID` | The unique point identifier from the external system |
| `Point External Path` | The full path to the point in the external system |
| `Point Name` | A human-readable name for the point |
| `Point Kind` | The point data type (`Number`, `Str`, or `Bool`) |
You can also include optional columns for device metadata (`Area`, `Location`, `Zone`, `Device Type`) and point ontology fields (`Ontology Field`, `Display Name`, `Precision`, `COV Tolerance`, `Default Graph`, `Ontology Unit`).
You can complete templating and metadata assignment directly in the spreadsheet instead of using the UI. This is faster for large sites with many devices.
Upload the completed `.xlsx` file and click `Import`. The import runs as a background job with validation before any data is written.
Only one import job can run per data source at a time. Different data sources on the same building can run imports concurrently.
### Re-upload to update existing records
Re-uploading a sheet is fully supported. The system uses a smart upsert approach to decide whether to create or update records.
* New device external IDs are created as new devices
* Existing devices can only have `Area`, `Location`, and `Zone` updated through re-upload
* All other device fields remain unchanged
* New point external IDs are created and assigned to the appropriate device
* Existing points are not overwritten
* `Area`, `Location`, and `Zone` changes on the parent device cascade to all of its points
* New virtual device names are created as new virtual devices
* Existing virtual device names are reused, and their `Area`, `Location`, and `Zone` can be updated
* Points with a `Virtual Device Name` value are assigned to that virtual device; points without one remain on the base device
### Start collection after connectivity
Once site connectivity is established:
1. Run `Discover Devices` on the data source.
2. Imported devices appear as existing records during discovery.
3. After discovery completes, points begin collecting data normally.
## Troubleshoot connection failures
When a data source goes offline, use the following approach to identify the issue.
A connector can show **Online** while site VPN, gateway, or point data still fails. Treat list status, Health errors, and on-site VPN state as separate checks. Recent IP or modem changes often explain both tunnel and device issues.
Open the connector view and navigate to the `Health` tab. Review the uptime graph and error logs for recent failures.
Click individual error entries to see the category and recommended actions. See the [error category reference](#error-category-reference) for a full list of categories, meanings, and suggested actions.
Click `Test Connection` to verify that Cloud BMS can reach the external system. A failed test confirms the issue is at the connection level.
Confirm that the external controller, gateway, or server is powered on and connected to the network. Check for IP address changes, credential rotations, or firewall modifications.
Brief connectivity alerts sometimes clear within a few minutes with no data loss. If the Health tab shows a short outage that already recovered, confirm devices and points stayed online before escalating.
Cloud BMS maintains the VPN tunnel and platform uptime on its end. Connectivity failures at the device, controller, or BMS server level are typically resolved by checking the on-site infrastructure. Contact KODE Labs support at [support@kodelabs.com](mailto:support@kodelabs.com) if you need assistance with troubleshooting.
## Next steps
View, acknowledge, and investigate subsystem alarms alongside routine events.
Scan data sources to register devices and points in Cloud BMS.
View and manage the equipment discovered through your data sources.