> ## Documentation Index
> Fetch the complete documentation index at: https://documentation.kodelabs.com/llms.txt
> Use this file to discover all available pages before exploring further.
# What is Fault Detection and Diagnostics?
> Understand how FDD uses events, incidents, and faults to monitor building equipment and detect operational issues in real time.
FDD monitors building equipment in real time to detect operational faults, track events, and group related issues into incidents. The module organizes fault data across three levels so you can respond to immediate problems and analyze long-term patterns.
Open FDD from the Cloud BMS portfolio or building sidebar.
## Core concepts
A fault is a period of time in which a specified condition is true on a specific device. Each fault has a start time, an affected device, a condition, and a duration.
 FDD structures fault information into three levels: events, incidents, and faults. Each level serves a different purpose, from real-time response to long-term trend analysis.
### Events
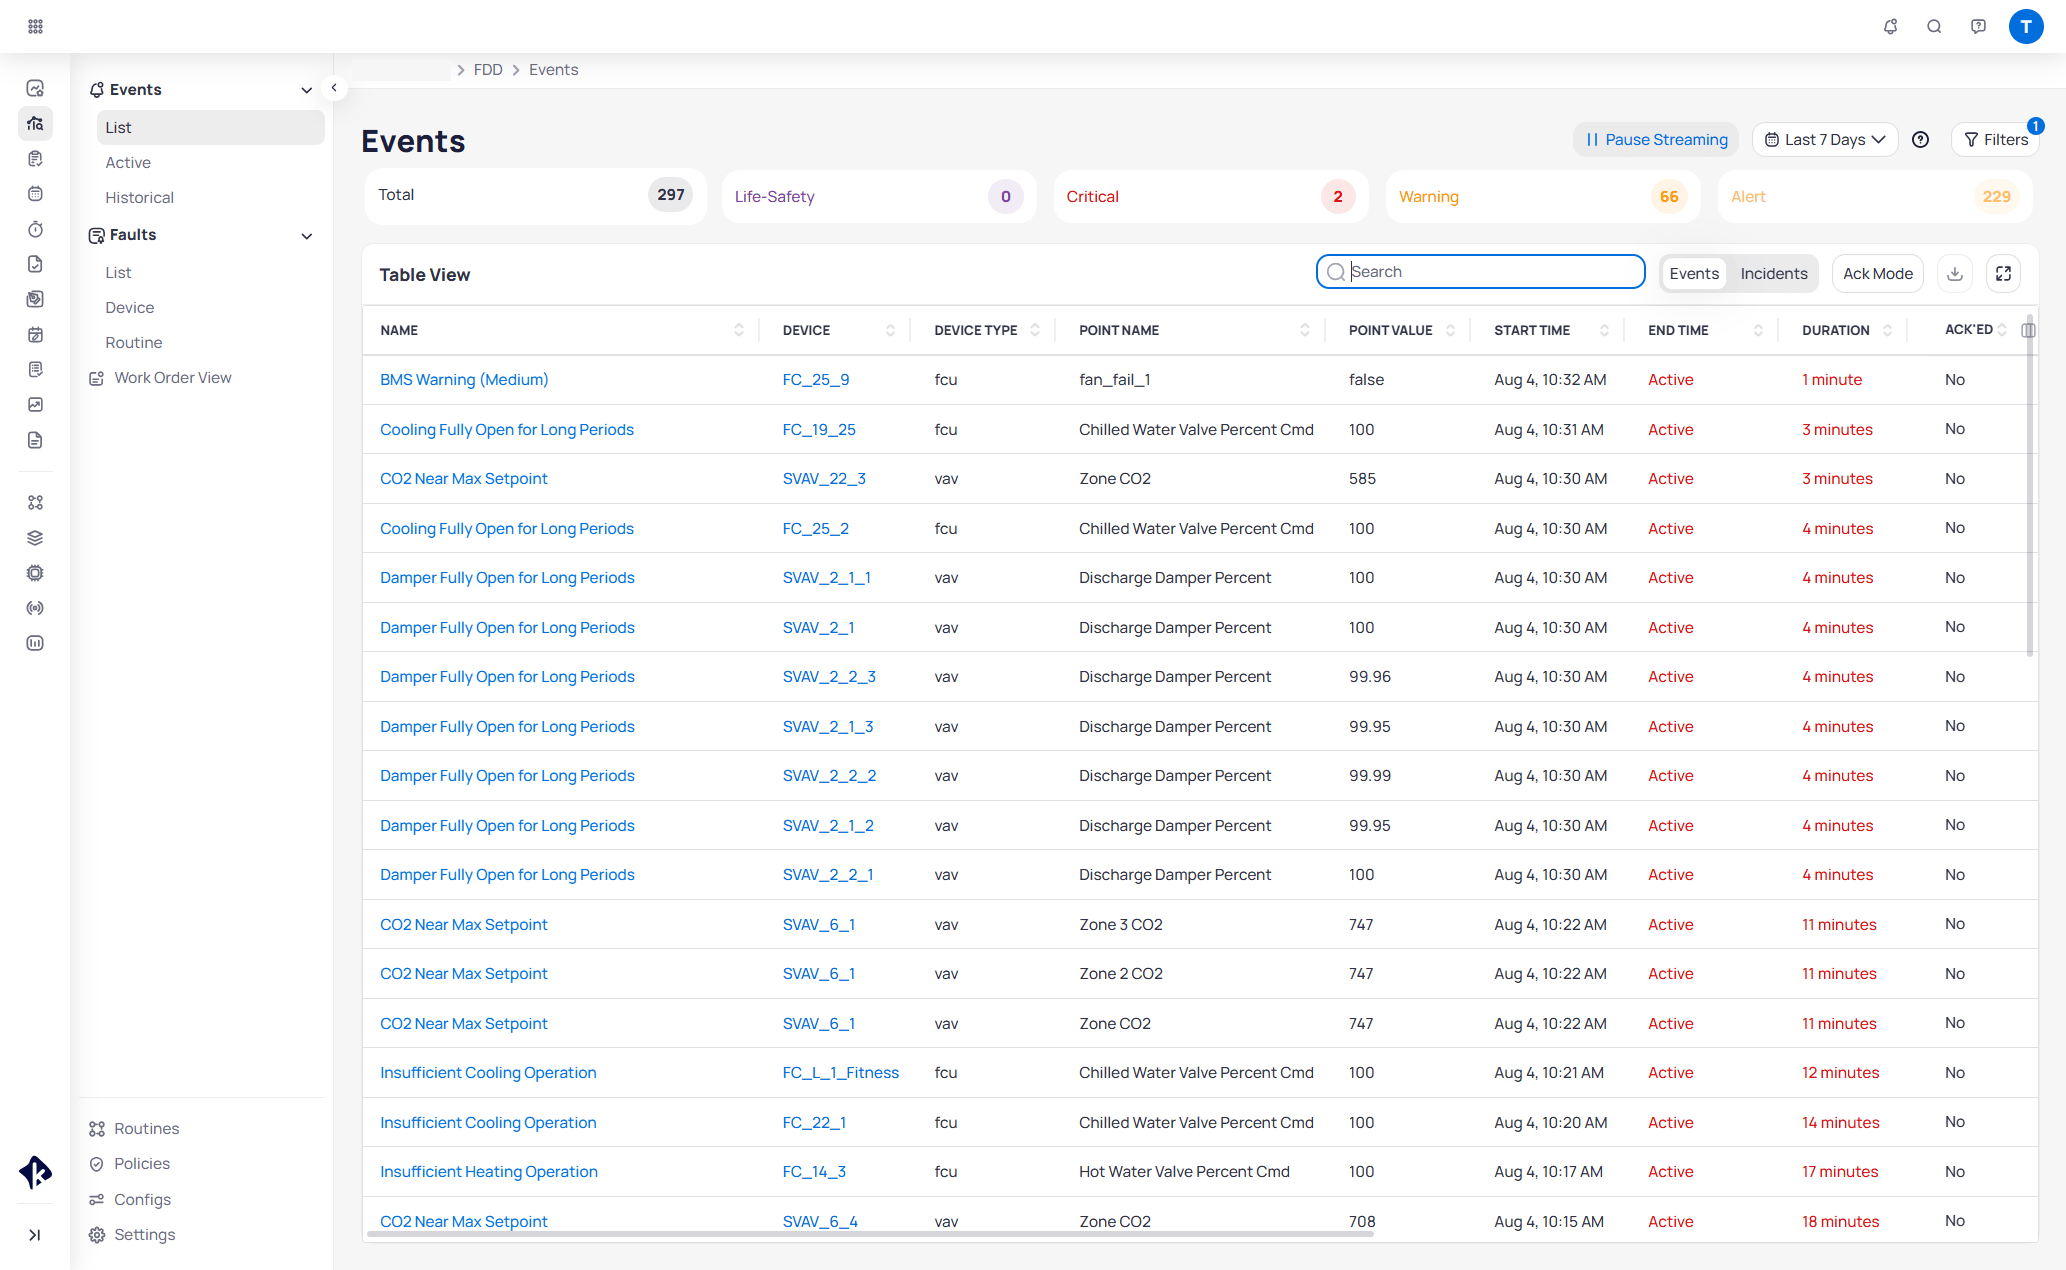
Events check multiple inputs across one or more devices. Each event carries an importance level and can serve as both an instantaneous indicator and a data point for analysis over time.
Events alone can produce excessive output. Combine events with incidents and faults for actionable insight.
FDD structures fault information into three levels: events, incidents, and faults. Each level serves a different purpose, from real-time response to long-term trend analysis.
### Events
Events check multiple inputs across one or more devices. Each event carries an importance level and can serve as both an instantaneous indicator and a data point for analysis over time.
Events alone can produce excessive output. Combine events with incidents and faults for actionable insight.
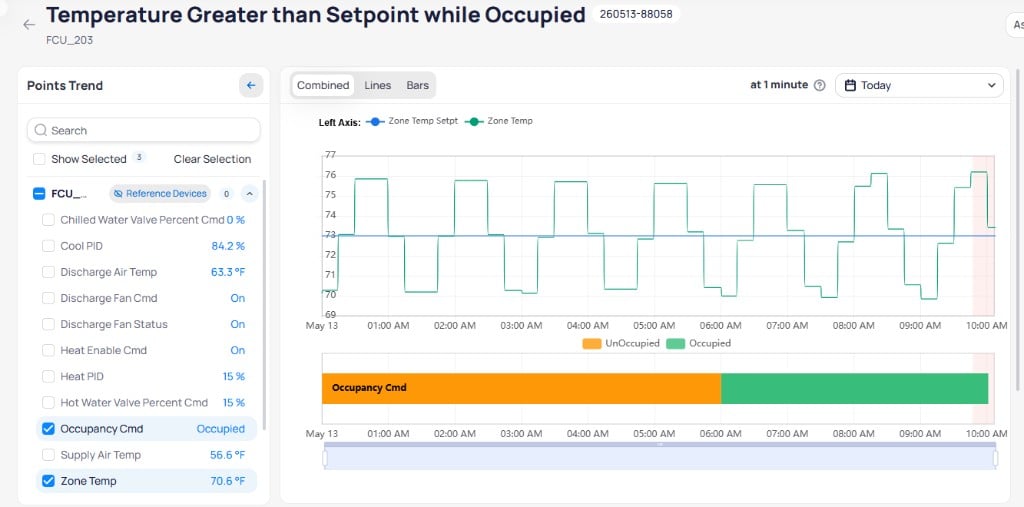
 Selecting an event opens the event report with automated device trend charts and a details sidebar for investigation.
 | Example event | Description |
| ---------------------------------------- | ---------------------------------------------------------------------- |
| Heating Not Active when Heating Required | The heating system is not running despite a heating demand signal |
| Discharge Air Flow Lower than Expected | Measured airflow falls below the expected value for current conditions |
| Simultaneous Heating and Cooling | Both heating and cooling systems are active at the same time |
### Incidents
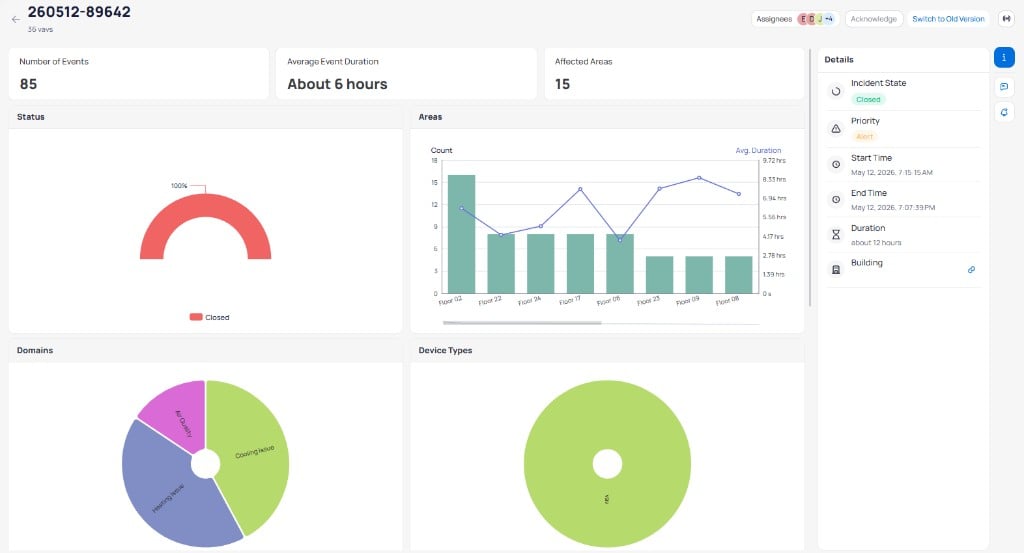
Incidents sit at the highest level. FDD creates incidents by finding commonalities between event groups using Reference Based Grouping. This method looks along ontology relationships to identify related equipment.
For example, if a VAV cannot meet its setpoint, FDD checks the upstream AHU and sibling VAVs to determine whether the issue is isolated or systemic. Grouping related events under a single incident reduces the number of individual issues you need to investigate.
| Example event | Description |
| ---------------------------------------- | ---------------------------------------------------------------------- |
| Heating Not Active when Heating Required | The heating system is not running despite a heating demand signal |
| Discharge Air Flow Lower than Expected | Measured airflow falls below the expected value for current conditions |
| Simultaneous Heating and Cooling | Both heating and cooling systems are active at the same time |
### Incidents
Incidents sit at the highest level. FDD creates incidents by finding commonalities between event groups using Reference Based Grouping. This method looks along ontology relationships to identify related equipment.
For example, if a VAV cannot meet its setpoint, FDD checks the upstream AHU and sibling VAVs to determine whether the issue is isolated or systemic. Grouping related events under a single incident reduces the number of individual issues you need to investigate.
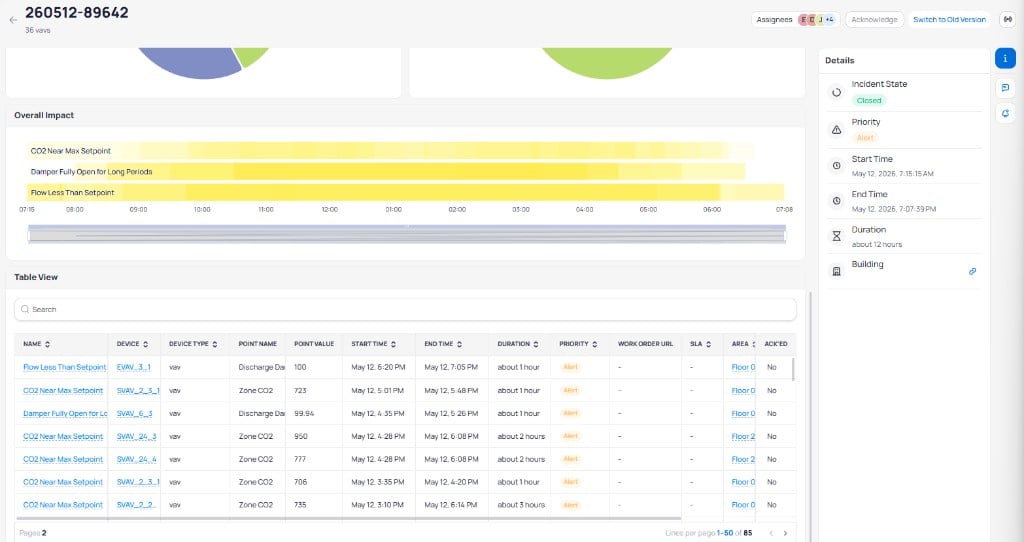
 The Overall Impact timeline shows which routines triggered events over the incident period. The table below lists all contributing events with their device, point data, duration, and priority.
 Reference Based Grouping does not achieve a 100% catch rate. Some fault patterns may not group into incidents automatically.
### Faults
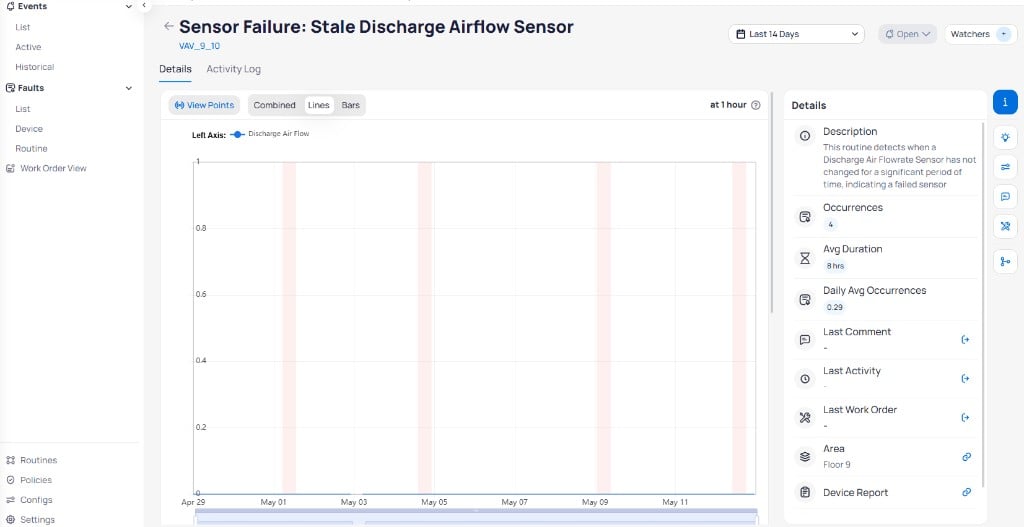
Faults capture long-term or recurring issues across your equipment. Use faults to monitor trends, triage recurring problems, and prioritize maintenance over time.
Faults are not designed for instant alerts or root-cause analysis. They complement events and incidents by providing a broader view of equipment health across days, weeks, or months.
Reference Based Grouping does not achieve a 100% catch rate. Some fault patterns may not group into incidents automatically.
### Faults
Faults capture long-term or recurring issues across your equipment. Use faults to monitor trends, triage recurring problems, and prioritize maintenance over time.
Faults are not designed for instant alerts or root-cause analysis. They complement events and incidents by providing a broader view of equipment health across days, weeks, or months.
 ## Priority levels
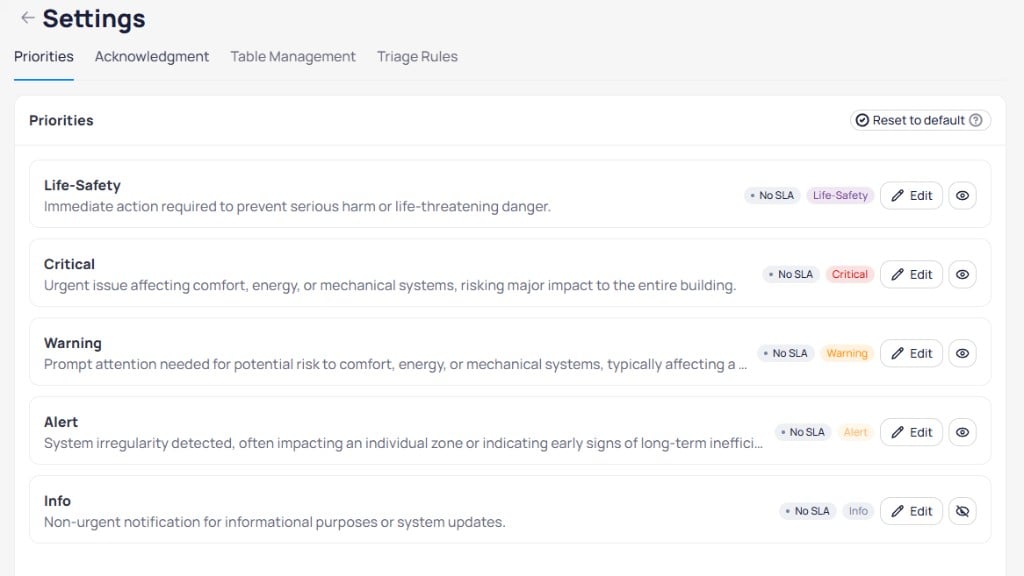
FDD assigns a priority level to each event, incident, and fault. The default configuration includes five levels:
| Priority | Purpose |
| --------------- | ---------------------------------------------------------- |
| **Life Safety** | Conditions that pose an immediate safety risk |
| **Critical** | Severe operational failures requiring urgent attention |
| **Warning** | Conditions that may lead to equipment damage or discomfort |
| **Alert** | Minor deviations from expected operation |
| **Info** | Informational conditions for awareness only |
Admins can customize priorities through the `Settings` page in the FDD module. You can configure between three and five priority levels with custom names, descriptions, colors, and SLA settings to match your organization's triage workflow.
## Priority levels
FDD assigns a priority level to each event, incident, and fault. The default configuration includes five levels:
| Priority | Purpose |
| --------------- | ---------------------------------------------------------- |
| **Life Safety** | Conditions that pose an immediate safety risk |
| **Critical** | Severe operational failures requiring urgent attention |
| **Warning** | Conditions that may lead to equipment damage or discomfort |
| **Alert** | Minor deviations from expected operation |
| **Info** | Informational conditions for awareness only |
Admins can customize priorities through the `Settings` page in the FDD module. You can configure between three and five priority levels with custom names, descriptions, colors, and SLA settings to match your organization's triage workflow.
 ## Next steps
Monitor and investigate real-time fault events across your building equipment.
Set up monitoring rules and thresholds for your equipment.
View building health at a glance with FDD dashboards.
## Next steps
Monitor and investigate real-time fault events across your building equipment.
Set up monitoring rules and thresholds for your equipment.
View building health at a glance with FDD dashboards.