> ## Documentation Index
> Fetch the complete documentation index at: https://documentation.kodelabs.com/llms.txt
> Use this file to discover all available pages before exploring further.
# Faults
> Track recurring equipment issues, analyze fault patterns across devices and routines, and manage long-term maintenance priorities.
Faults capture long-term or recurring issues across your building equipment. Use the `Faults` page to monitor patterns, prioritize maintenance, and track resolution over time.
Faults is a building-level module. Select a building from the sites list, then navigate to `FDD` > `Faults` in the left sidebar.
## Access from device details
Open any device and select the `Trends` tab. Click `Faults` in the summary bar to review recent faults for that equipment in the **FDD Faults** sidebar. See [View faults from trends](/products/kode-os/devices/devices#view-faults-from-trends).
Faults are generated daily when `Fault Config` is enabled in the [Status Setup](/products/fdd/configuration#configure-status-setup) section of a routine's configuration. They analyze non-critical comfort, energy, and mechanical issues. To create faults, you first define a monitoring [routine](/products/fdd/routines), then [configure](/products/fdd/configuration) it with `Fault Config` enabled.
## Watcher notifications
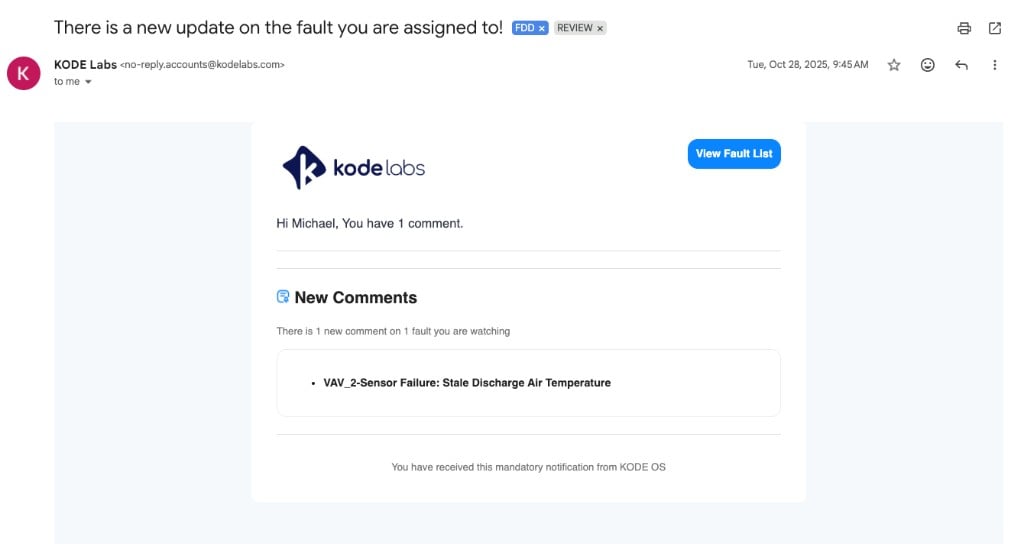
Faults send email notifications to assigned watchers when any of the following occur:
* Status update
* New comment
* New watcher (notifies only the newly added watcher)
Notifications use a five-minute rolling delay. Each watcher-relevant change resets the window. After five minutes with no further changes, FDD sends one email that summarizes the updates in that window.
For example, if changes occur at minute 1, minute 3, and minute 7, relevant watchers receive a summary email at the 12-minute mark.
 ## Faults landing page
The `Faults` page provides three views to organize fault data:
| View | Description |
| ----------- | -------------------------------------------- |
| **List** | Individual faults displayed as separate rows |
| **Device** | Faults grouped by device |
| **Routine** | Faults grouped by monitoring routine |
## List view
The list view displays one row per fault. Status tabs at the top show counts for `Open`, `In Progress`, `Resolved`, `Deferred`, `In Review`, and `Suppressed` faults. Use the date picker at the top right to select a time range (up to 30 days) and select `Filters` to open the filter bar.
## Faults landing page
The `Faults` page provides three views to organize fault data:
| View | Description |
| ----------- | -------------------------------------------- |
| **List** | Individual faults displayed as separate rows |
| **Device** | Faults grouped by device |
| **Routine** | Faults grouped by monitoring routine |
## List view
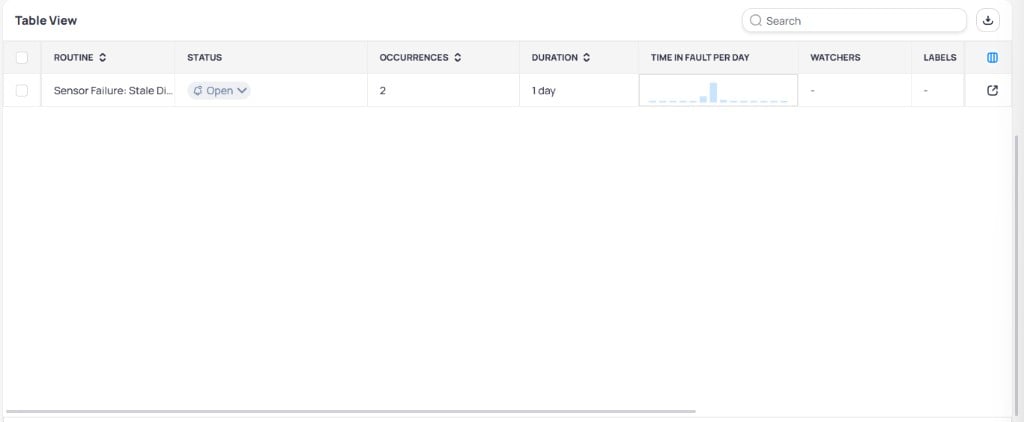
The list view displays one row per fault. Status tabs at the top show counts for `Open`, `In Progress`, `Resolved`, `Deferred`, `In Review`, and `Suppressed` faults. Use the date picker at the top right to select a time range (up to 30 days) and select `Filters` to open the filter bar.
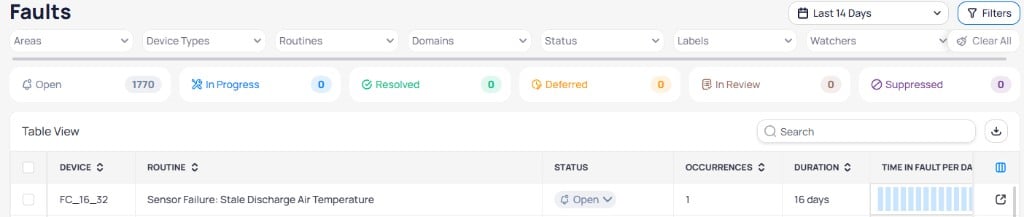 Hover over the `Time in Fault per Day` column to see a tooltip with the event count and total hours in fault for a specific day.
The list view displays the following columns:
| Column | Description |
| ------------------------- | ------------------------------------------------------------------------------------------- |
| **Device** | The device associated with the fault |
| **Routine** | The monitoring routine that triggered the fault |
| **Status** | Current status: `Open`, `In Progress`, `Resolved`, `Deferred`, `In Review`, or `Suppressed` |
| **Occurrences** | Number of events generated by this fault |
| **Duration** | Cumulative time the fault has been active |
| **Time in Fault per Day** | Visual bar indicator of daily fault duration |
| **Watchers** | Users monitoring this fault |
| **Labels** | Tags such as `Reopened`, `Overdue`, or `Work Order` |
| **Last Comment** | Most recent comment on the fault |
| **Last Activity** | Timestamp of the most recent action |
| **Area** | Building area where the device is located |
| **Work Order URL** | Link to the associated work order |
### Filter and search faults
Select `Filters` to open the filter bar with dropdown slicers for `Areas`, `Device Types`, `Routines`, `Domains`, `Status`, `Labels`, and `Watchers`. Select `Clear All` to reset all filters.
Combine filters to focus your view. For example, filter by `Open` status and a specific routine to see all unresolved faults for that monitoring rule.
Search faults by device name or routine name using the search bar.
### Bulk actions
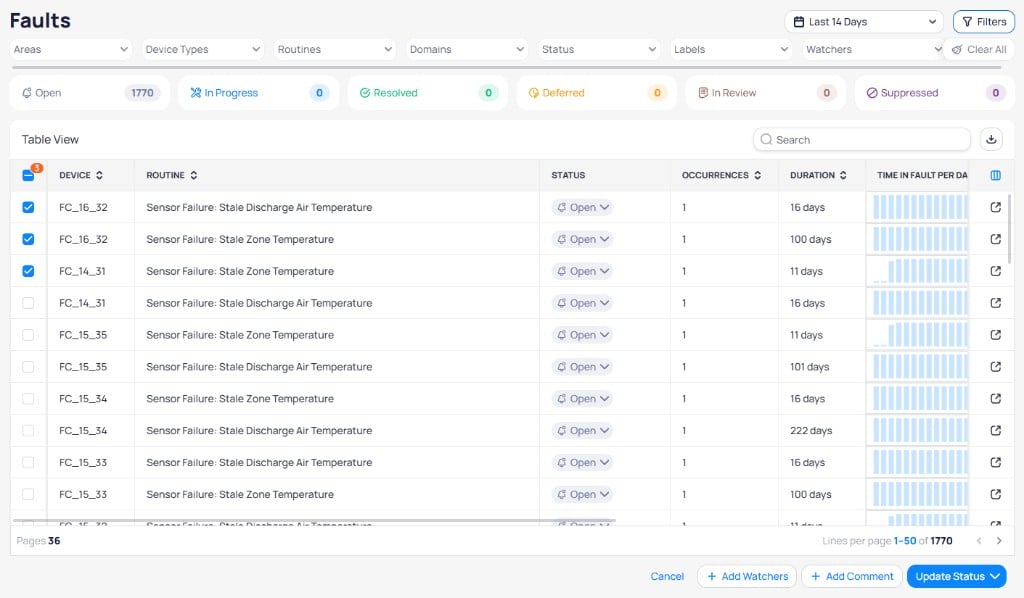
Select one or more faults using the checkboxes on the left side of the table. A bulk action toolbar appears at the bottom with the following options:
* `Cancel` -- deselect all faults
* `+ Add Watchers` -- assign watchers to the selected faults
* `+ Add Comment` -- add a comment to all selected faults
* `Update Status` -- change the status of all selected faults at once
Hover over the `Time in Fault per Day` column to see a tooltip with the event count and total hours in fault for a specific day.
The list view displays the following columns:
| Column | Description |
| ------------------------- | ------------------------------------------------------------------------------------------- |
| **Device** | The device associated with the fault |
| **Routine** | The monitoring routine that triggered the fault |
| **Status** | Current status: `Open`, `In Progress`, `Resolved`, `Deferred`, `In Review`, or `Suppressed` |
| **Occurrences** | Number of events generated by this fault |
| **Duration** | Cumulative time the fault has been active |
| **Time in Fault per Day** | Visual bar indicator of daily fault duration |
| **Watchers** | Users monitoring this fault |
| **Labels** | Tags such as `Reopened`, `Overdue`, or `Work Order` |
| **Last Comment** | Most recent comment on the fault |
| **Last Activity** | Timestamp of the most recent action |
| **Area** | Building area where the device is located |
| **Work Order URL** | Link to the associated work order |
### Filter and search faults
Select `Filters` to open the filter bar with dropdown slicers for `Areas`, `Device Types`, `Routines`, `Domains`, `Status`, `Labels`, and `Watchers`. Select `Clear All` to reset all filters.
Combine filters to focus your view. For example, filter by `Open` status and a specific routine to see all unresolved faults for that monitoring rule.
Search faults by device name or routine name using the search bar.
### Bulk actions
Select one or more faults using the checkboxes on the left side of the table. A bulk action toolbar appears at the bottom with the following options:
* `Cancel` -- deselect all faults
* `+ Add Watchers` -- assign watchers to the selected faults
* `+ Add Comment` -- add a comment to all selected faults
* `Update Status` -- change the status of all selected faults at once
 ### Export
Select the download icon to export the filtered list as a CSV file. Fault metrics such as total duration and occurrences are computed based on the selected date range.
### Fault report
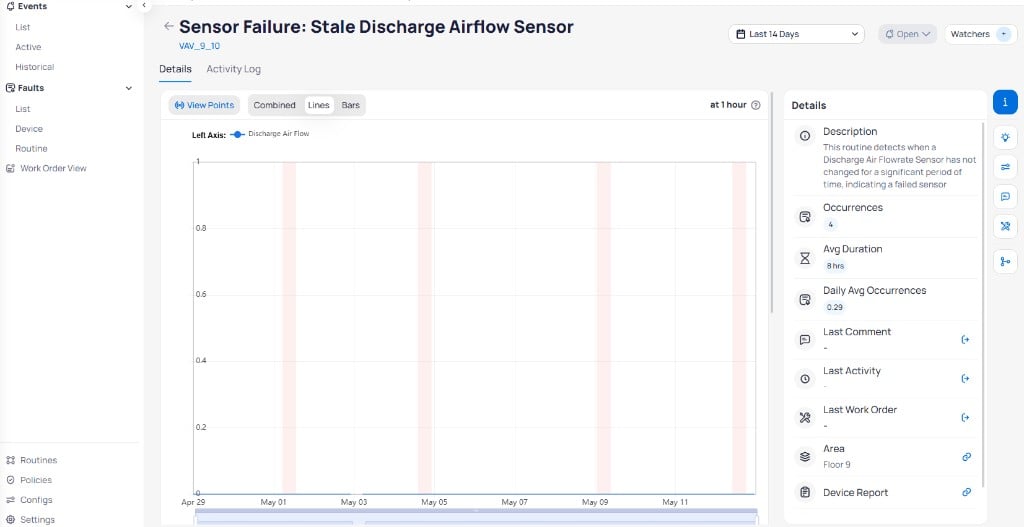
Select any fault row to open the fault report. The report header displays the fault name, device name, date picker, status dropdown, and a `Watchers` control to add or view users monitoring the fault. The report contains two tabs: `Details` and `Activity Log`.
### Export
Select the download icon to export the filtered list as a CSV file. Fault metrics such as total duration and occurrences are computed based on the selected date range.
### Fault report
Select any fault row to open the fault report. The report header displays the fault name, device name, date picker, status dropdown, and a `Watchers` control to add or view users monitoring the fault. The report contains two tabs: `Details` and `Activity Log`.
 #### Points trend view
The Points Trend panel on the left lists all available points for the device with their live values. Search for specific points or check their checkbox to toggle visibility on the trend chart. Select `Show Selected` to display only checked points. Select `Clear Selection` to reset. Use the `Reference Devices` tab to view and overlay points from related devices.
#### Points trend view
The Points Trend panel on the left lists all available points for the device with their live values. Search for specific points or check their checkbox to toggle visibility on the trend chart. Select `Show Selected` to display only checked points. Select `Clear Selection` to reset. Use the `Reference Devices` tab to view and overlay points from related devices.
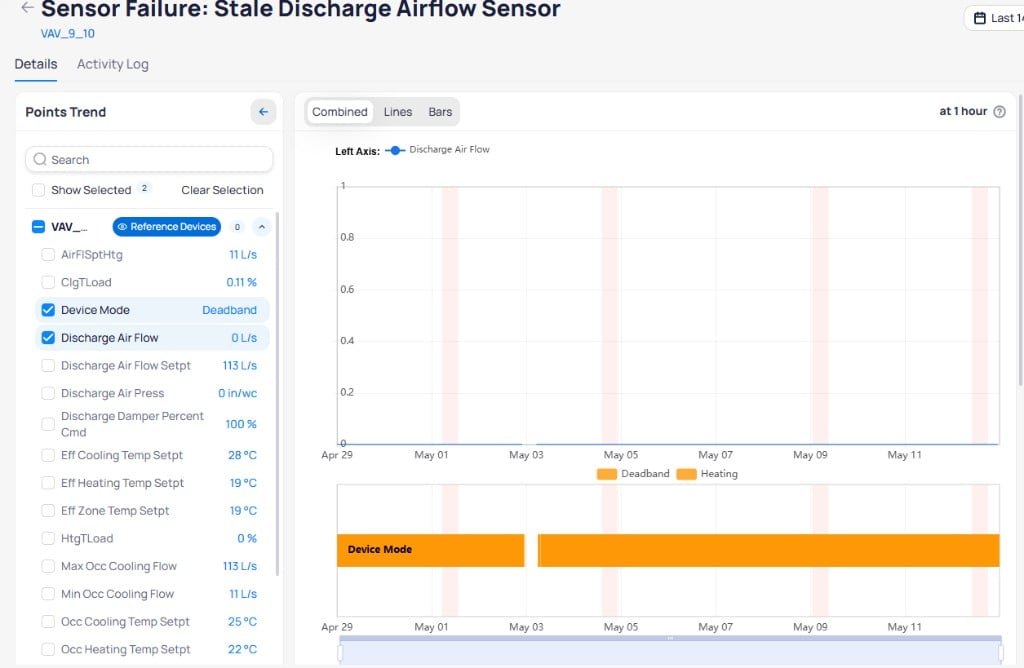 Red shaded regions on the trend chart highlight the periods when fault events were active. Switch between display modes:
| Mode | Description |
| ------------ | --------------------------------------- |
| **Combined** | Overlay of all points on a single chart |
| **Lines** | Line chart for continuous data |
| **Bars** | Bar chart format for discrete values |
#### Table view
Below the trend chart, a table lists each event associated with the fault. Search events using the search bar. Each row is expandable for additional detail.
Red shaded regions on the trend chart highlight the periods when fault events were active. Switch between display modes:
| Mode | Description |
| ------------ | --------------------------------------- |
| **Combined** | Overlay of all points on a single chart |
| **Lines** | Line chart for continuous data |
| **Bars** | Bar chart format for discrete values |
#### Table view
Below the trend chart, a table lists each event associated with the fault. Search events using the search bar. Each row is expandable for additional detail.
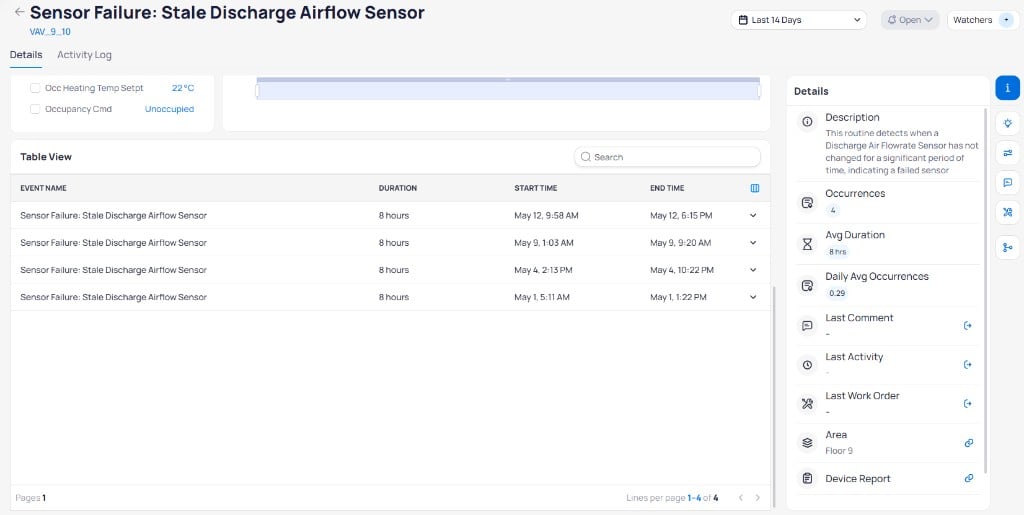 | Column | Description |
| -------------- | ------------------------------ |
| **Event Name** | Name of the contributing event |
| **Duration** | How long the event was active |
| **Start Time** | When the event began |
| **End Time** | When the event ended |
#### Fault details sidebar
The sidebar on the right side of the fault report contains multiple tabs accessible through icon buttons.
**Details** -- displays core fault information:
| Field | Description |
| ----------------------- | ------------------------------------------------------------------------------- |
| `Description` | Explains the fault condition logic |
| `Occurrences` | Number of events generated by this fault |
| `Avg Duration` | Average duration of individual fault events |
| `Daily Avg Occurrences` | Average number of fault events per day |
| `Last Comment` | Most recent comment on the fault |
| `Last Activity` | Timestamp of the most recent action |
| `Last Work Order` | Most recent work order linked to the fault |
| `Area` | Floor or zone where the device is located. Select to navigate to the area page. |
| `Device Report` | Select to navigate to the device details page. |
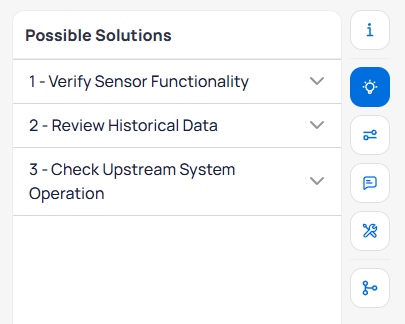
**Possible Solutions** -- lists recommended actions to resolve the fault. Each solution is an expandable card with detailed troubleshooting steps.
| Column | Description |
| -------------- | ------------------------------ |
| **Event Name** | Name of the contributing event |
| **Duration** | How long the event was active |
| **Start Time** | When the event began |
| **End Time** | When the event ended |
#### Fault details sidebar
The sidebar on the right side of the fault report contains multiple tabs accessible through icon buttons.
**Details** -- displays core fault information:
| Field | Description |
| ----------------------- | ------------------------------------------------------------------------------- |
| `Description` | Explains the fault condition logic |
| `Occurrences` | Number of events generated by this fault |
| `Avg Duration` | Average duration of individual fault events |
| `Daily Avg Occurrences` | Average number of fault events per day |
| `Last Comment` | Most recent comment on the fault |
| `Last Activity` | Timestamp of the most recent action |
| `Last Work Order` | Most recent work order linked to the fault |
| `Area` | Floor or zone where the device is located. Select to navigate to the area page. |
| `Device Report` | Select to navigate to the device details page. |
**Possible Solutions** -- lists recommended actions to resolve the fault. Each solution is an expandable card with detailed troubleshooting steps.
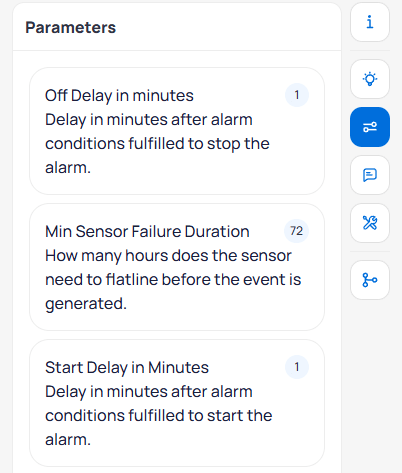
 **Parameters** -- shows the tuning parameter values configured for the routine that generated the fault. Each parameter card displays the parameter name, its current value, and a description.
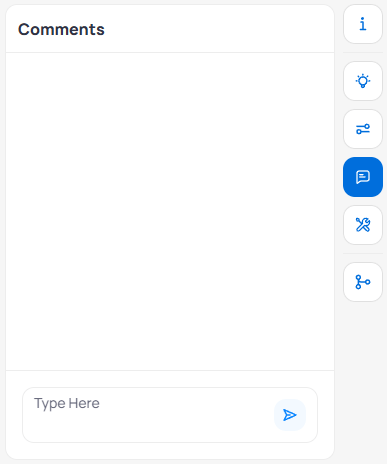
 **Comments** -- a shared space for team collaboration. Type a message and select the send button to post a comment.
 **Work Orders** -- displays linked work orders with an option to create new ones.
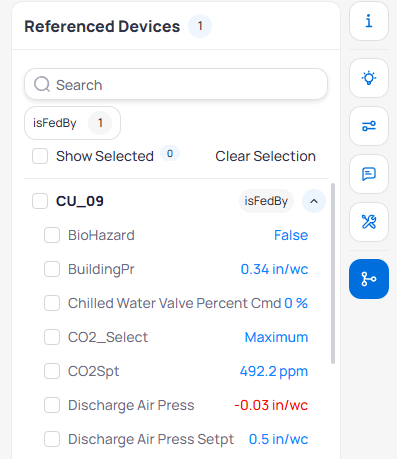
**Referenced Devices** -- lists related devices grouped by ontology relationship type. Select a device to expand its point list and view live values. Check a point's checkbox to overlay it on the trend chart for comparison.
**Work Orders** -- displays linked work orders with an option to create new ones.
**Referenced Devices** -- lists related devices grouped by ontology relationship type. Select a device to expand its point list and view live values. Check a point's checkbox to overlay it on the trend chart for comparison.
 ## Device view
The device view groups faults by device. Each row represents a single device with aggregated fault data. The same status tabs, date picker, and filter controls from the list view are available.
## Device view
The device view groups faults by device. Each row represents a single device with aggregated fault data. The same status tabs, date picker, and filter controls from the list view are available.
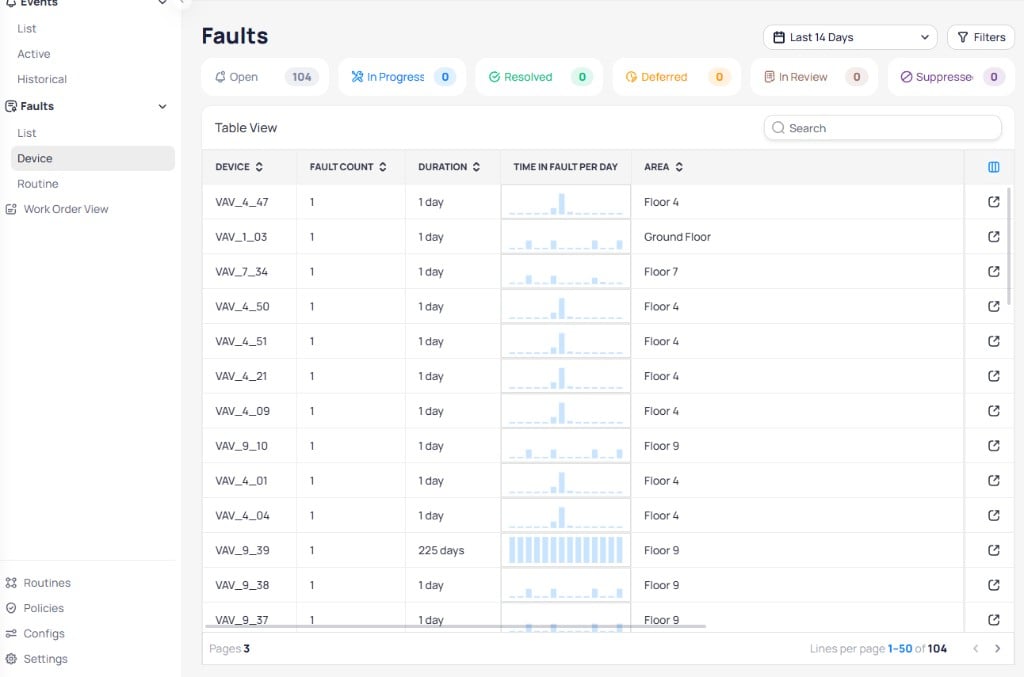 | Column | Description |
| ------------------------- | ------------------------------------------- |
| **Device** | The device name |
| **Fault Count** | Number of distinct faults for this device |
| **Duration** | Cumulative fault duration across all faults |
| **Time in Fault per Day** | Visual indicator of daily fault duration |
| **Area** | Building area where the device is located |
Select any device row to open the device fault report. The report header displays the device name, area, and a date picker. Summary cards show **Total Nr Of Events**, **Daily Average Nr Of Events**, **Average Duration**, and **Affected Routines**.
| Column | Description |
| ------------------------- | ------------------------------------------- |
| **Device** | The device name |
| **Fault Count** | Number of distinct faults for this device |
| **Duration** | Cumulative fault duration across all faults |
| **Time in Fault per Day** | Visual indicator of daily fault duration |
| **Area** | Building area where the device is located |
Select any device row to open the device fault report. The report header displays the device name, area, and a date picker. Summary cards show **Total Nr Of Events**, **Daily Average Nr Of Events**, **Average Duration**, and **Affected Routines**.
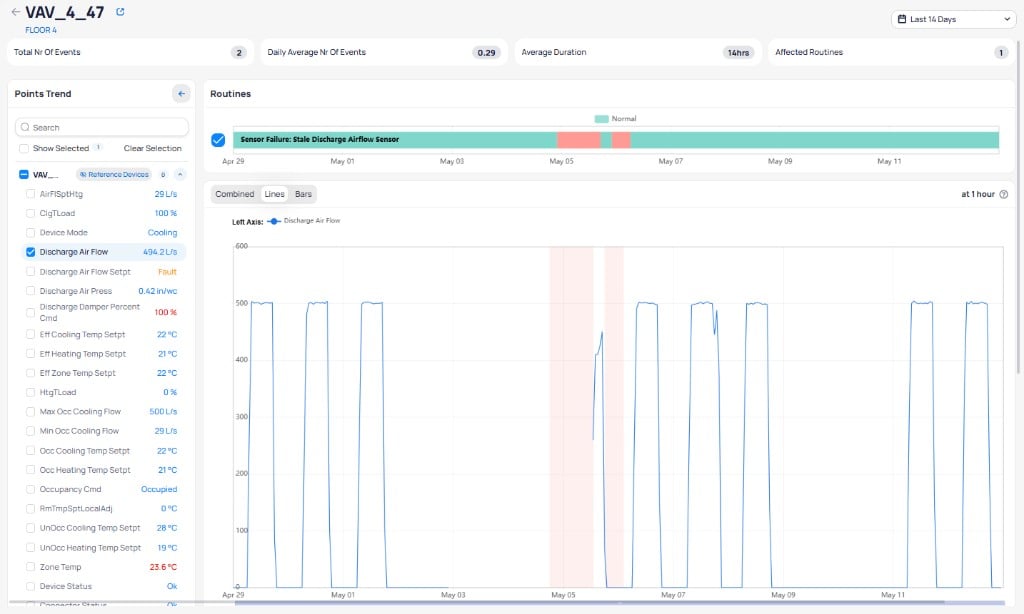 The **Routines** section shows a timeline for each affected routine. Green indicates normal operation and red/orange indicates fault periods.
Below the routines timeline, the Points Trend panel and trend chart function the same as the [fault report](#points-trend-view). A Table View at the bottom lists the individual faults for the device.
The **Routines** section shows a timeline for each affected routine. Green indicates normal operation and red/orange indicates fault periods.
Below the routines timeline, the Points Trend panel and trend chart function the same as the [fault report](#points-trend-view). A Table View at the bottom lists the individual faults for the device.
 ## Routine view
The routine view groups faults by monitoring routine. Each row represents a single routine with aggregated fault data. The same status tabs, date picker, and filter controls from the list view are available.
## Routine view
The routine view groups faults by monitoring routine. Each row represents a single routine with aggregated fault data. The same status tabs, date picker, and filter controls from the list view are available.
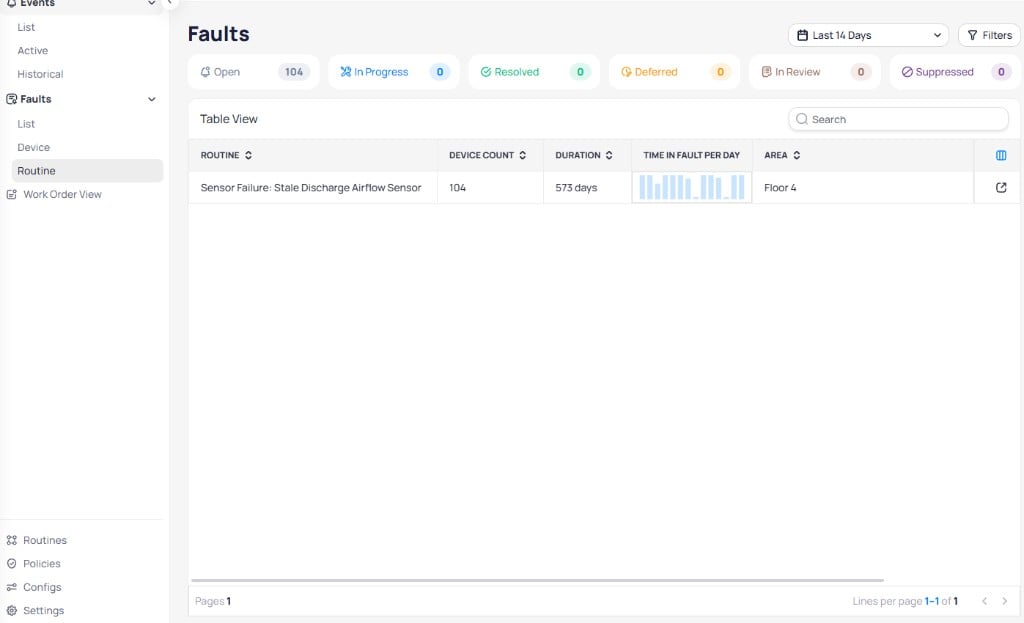 | Column | Description |
| ------------------------- | -------------------------------------------- |
| **Routine** | The monitoring routine name |
| **Device Count** | Number of devices affected by this routine |
| **Duration** | Cumulative fault duration across all devices |
| **Time in Fault per Day** | Visual indicator of daily fault duration |
| **Area** | Building area |
Select any routine row to open the routine fault report. The report header displays the routine name and a date picker. Summary cards show **Total Nr Of Events**, **Daily Average Nr Of Events**, **Average Duration**, and **Affected Devices**.
| Column | Description |
| ------------------------- | -------------------------------------------- |
| **Routine** | The monitoring routine name |
| **Device Count** | Number of devices affected by this routine |
| **Duration** | Cumulative fault duration across all devices |
| **Time in Fault per Day** | Visual indicator of daily fault duration |
| **Area** | Building area |
Select any routine row to open the routine fault report. The report header displays the routine name and a date picker. Summary cards show **Total Nr Of Events**, **Daily Average Nr Of Events**, **Average Duration**, and **Affected Devices**.
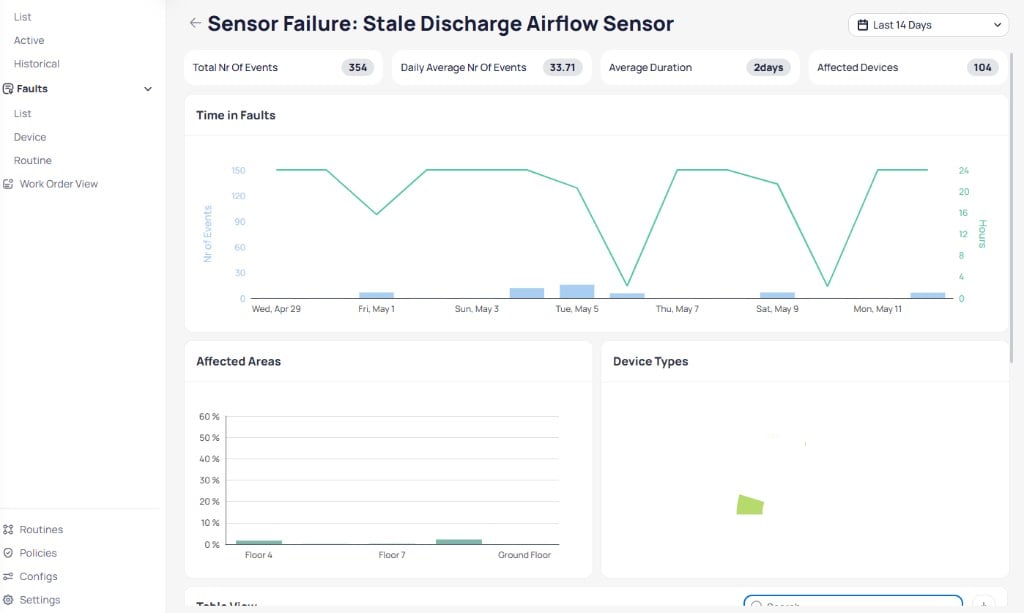 The **Time in Faults** chart displays the number of events as bars and total fault hours as a line over the selected time range. Below, **Affected Areas** and **Device Types** charts show the distribution of faults by floor and equipment type.
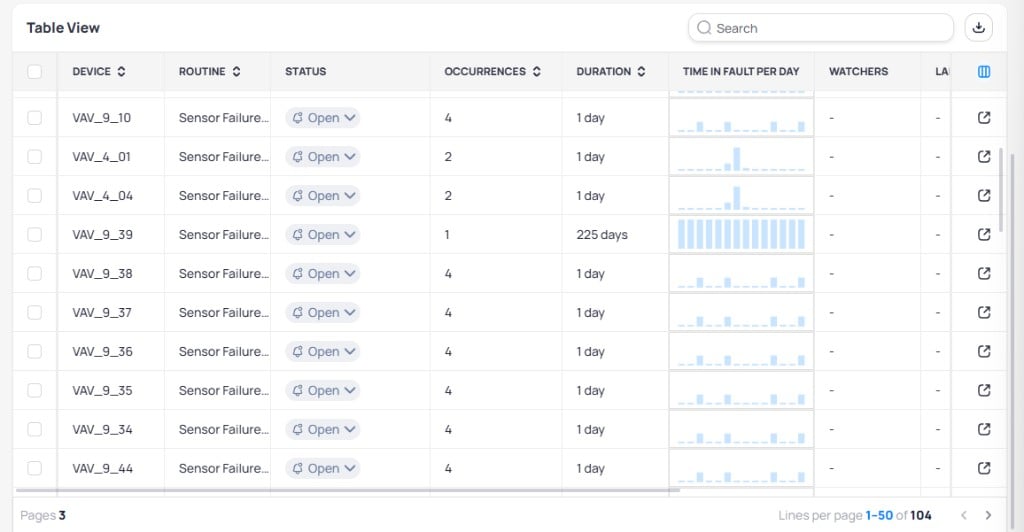
A Table View at the bottom lists the individual faults for the routine, with columns for Device, Routine, Status, Occurrences, Duration, Time in Fault per Day, and Watchers.
The **Time in Faults** chart displays the number of events as bars and total fault hours as a line over the selected time range. Below, **Affected Areas** and **Device Types** charts show the distribution of faults by floor and equipment type.
A Table View at the bottom lists the individual faults for the routine, with columns for Device, Routine, Status, Occurrences, Duration, Time in Fault per Day, and Watchers.
 ## Next steps
Monitor and investigate individual fault events in detail.
Set up monitoring rules and parameters for your building equipment.
View building health at a glance with FDD dashboards.
## Next steps
Monitor and investigate individual fault events in detail.
Set up monitoring rules and parameters for your building equipment.
View building health at a glance with FDD dashboards.