> ## Documentation Index
> Fetch the complete documentation index at: https://documentation.kodelabs.com/llms.txt
> Use this file to discover all available pages before exploring further.
# Events and incidents
> Monitor, filter, and investigate FDD events and incidents with real-time streaming, device trends, and collaborative triage tools.
The Events page displays FDD events for your building. You can filter, search, acknowledge, create work orders, and investigate events from a single interface. Switch to Incidents when you want related events grouped together.
Select a building from the [sites list](/products/kode-os/sites-and-map), then navigate to `FDD` > `Events` > `List` in the left sidebar.
## Events list
The Events list page combines priority filtering and a sortable table. The page header provides controls for streaming, date range, and filters.
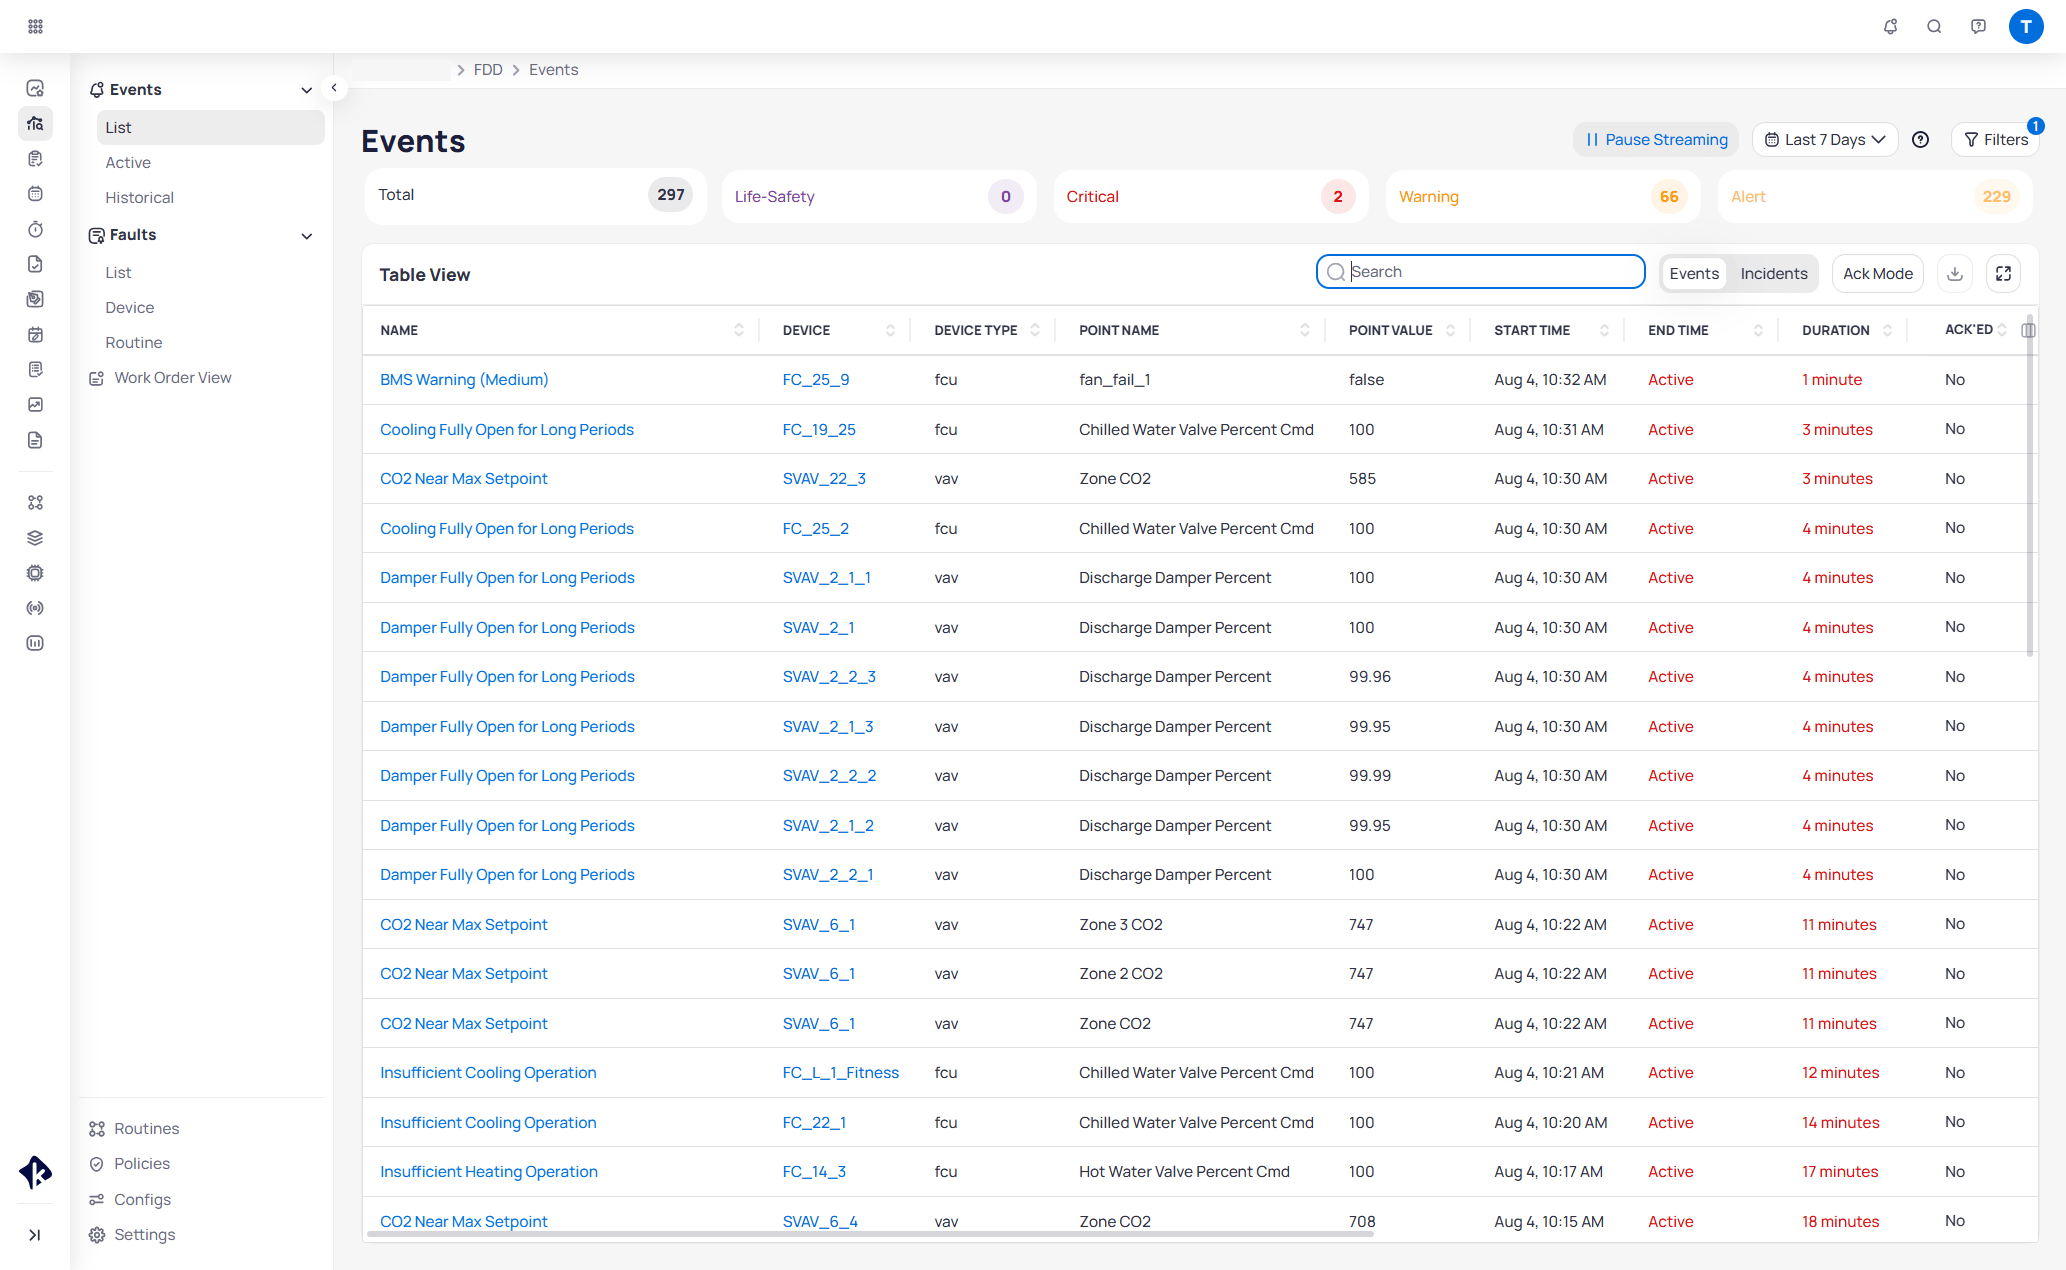 Select `Pause Streaming` to stop live updates while you review the current list. Use the `Last 7 Days` date picker to set the time range for the list.
### Filters
Select `Filters` at the top right to open the filter bar.
Select `Pause Streaming` to stop live updates while you review the current list. Use the `Last 7 Days` date picker to set the time range for the list.
### Filters
Select `Filters` at the top right to open the filter bar.
 The following dropdown slicers are available:
| Filter | Description |
| ---------------- | ----------------------------------------------- |
| **Areas** | Filter by floor or zone |
| **Routines** | Filter by the routine that triggered the event |
| **Priorities** | Filter by priority level |
| **Device Types** | Filter by equipment type |
| **Ack Status** | Filter by acknowledgment status |
| **Domains** | Filter by fault domain (cooling, heating, etc.) |
| **Work Order** | Filter by work order status |
| **Event State** | Filter by event state |
| **Users** | Filter by assigned user |
Select `Save` to save the current filter selection as your personal default. Expand the `Save` dropdown and select `Save for Building` to apply the filters for all users viewing this building. Select `Clear All` to remove all active filters.
### Priority summary cards
Below the filters, a row of priority cards displays the event count by severity level: `Total`, `Life Safety`, `Critical`, `Warning`, `Alert`, and `Info`. These cards are interactive -- select a priority card to filter the table to that severity level. The count on each card updates dynamically as you apply or remove filters.
### Search
Use the search bar above the table to find events by event name, device name, or building name.
## Events table
The table view lists each event as a row with sortable columns. Click the up or down arrows on any column header to sort the table.
| Column | Description |
| --------------- | -------------------------------------------- |
| **Name** | Event name describing the detected condition |
| **Device** | Device associated with the event |
| **Device Type** | Equipment type |
| **Point Name** | Data point that triggered the event |
| **Point Value** | Value of the triggering point |
| **Start Time** | When the event began |
| **End Time** | When the event ended |
| **Duration** | Total event duration |
| **Priority** | Severity level |
| **Work Order** | Linked work order status |
| **SLA** | Service level agreement status |
| **Area** | Floor or zone location |
| **Building** | Building name |
| **Assignees** | Users assigned to the event |
| **Event ID** | Unique event identifier |
| **Incident ID** | Linked incident identifier |
| **Notified** | Whether notifications were sent |
| **Ack'ed** | Acknowledgment status |
Customize which columns appear and their order using the column configuration icon in the upper-right corner of the table. Pagination controls at the bottom let you configure the number of lines per page.
Click any row to open the event report.
### Bulk acknowledge
Select the checkboxes on the left side of the table to choose one or more events. Use Shift + click to select a range. A footer appears with `Acknowledge` and `Create Work Order` actions.
Select `Acknowledge` to confirm. Based on your permissions, you may only be able to acknowledge events assigned to you. The count on the `Acknowledge` button shows how many of the selected events you can acknowledge.
### Create work orders per event
Create **one work order per selected event** from the Events list. Select events with row checkboxes or the header select-all control. In the list footer, select `Create Work Order` (badged with the selection count). The button uses the same work order creation permission as a single-event work order.
This flow does not combine several events into one work order.
Select the events that need field response. The footer shows `Acknowledge` and `Create Work Order` with the live selection count.
The review dialog lists one row per selected event with **Event Name**, **Device Name**, **Event ID**, and **Status**. Sort columns and page through the list as needed. Use the delete icon on a row to remove that event from the batch without returning to the table.
These statuses describe the work order inside the bulk creation workflow. They are not the operational status of the work order in the destination CMMS.
| Status | Meaning |
| ------------------- | ------------------------------------------------------------------------------------------------------------------------------------------------------------------------------------------------------------------------- |
| **To Be Completed** | One or more required fields still need values. You cannot send the work order in this state. |
| **Ready** | All required fields are populated. You can send the work order individually or include it in `Send Work Orders`. |
| **Sent** | The work order was submitted successfully. You cannot edit or discard it within the bulk creation workflow. |
| **Not Sent** | The work order was part of a submit-all action but was not submitted, usually because required fields were still incomplete. It remains available for review. When all required fields are populated, it becomes `Ready`. |
Select `Send Work Orders` to send every ready work order in one action. Select `Review Each` to open the standard work order form for the first event and walk the set one by one.
The form uses the same fields as single-event creation (name, data source, entity, action, title, description, category, subcategory, location, device link, and priority). The header shows the event name, status chip, **Event N of M**, previous and next controls, and a dropdown to jump to any event in the batch. Use **Back** or **Back to Selected Events** to return to the review dialog.
After submission, the dialog reports **Sent** or **Not Sent** per row:
* All succeeded — every selected work order was sent to the external system
* Partial failure — some sent and some not sent; continue editing incomplete rows until they are `Ready`, then send again
* Total failure — none were created; complete required fields and try again
In the Review Each path, outcomes can also appear inline in the submission dialog. Successfully created work orders appear under [Generated Work Orders](/products/fdd/work-orders#work-order-view) with single-event work orders.
Select `Cancel Creation` only when you intend to leave the flow. The **Discard Work Order Creation?** confirmation warns that unsaved progress and the current selection are lost. Choose `Keep Working` to stay in the flow.
There is no bulk apply of category, priority, or location across the batch. Editing in Review Each is one event at a time. Failed submissions are not retried automatically.
### Export
Select the download icon from the table toolbar to open the Export Options dialog. Configure the maximum number of rows (default 1,000), select the export type (`CSV` or `PDF`), and choose which columns to include.
The following dropdown slicers are available:
| Filter | Description |
| ---------------- | ----------------------------------------------- |
| **Areas** | Filter by floor or zone |
| **Routines** | Filter by the routine that triggered the event |
| **Priorities** | Filter by priority level |
| **Device Types** | Filter by equipment type |
| **Ack Status** | Filter by acknowledgment status |
| **Domains** | Filter by fault domain (cooling, heating, etc.) |
| **Work Order** | Filter by work order status |
| **Event State** | Filter by event state |
| **Users** | Filter by assigned user |
Select `Save` to save the current filter selection as your personal default. Expand the `Save` dropdown and select `Save for Building` to apply the filters for all users viewing this building. Select `Clear All` to remove all active filters.
### Priority summary cards
Below the filters, a row of priority cards displays the event count by severity level: `Total`, `Life Safety`, `Critical`, `Warning`, `Alert`, and `Info`. These cards are interactive -- select a priority card to filter the table to that severity level. The count on each card updates dynamically as you apply or remove filters.
### Search
Use the search bar above the table to find events by event name, device name, or building name.
## Events table
The table view lists each event as a row with sortable columns. Click the up or down arrows on any column header to sort the table.
| Column | Description |
| --------------- | -------------------------------------------- |
| **Name** | Event name describing the detected condition |
| **Device** | Device associated with the event |
| **Device Type** | Equipment type |
| **Point Name** | Data point that triggered the event |
| **Point Value** | Value of the triggering point |
| **Start Time** | When the event began |
| **End Time** | When the event ended |
| **Duration** | Total event duration |
| **Priority** | Severity level |
| **Work Order** | Linked work order status |
| **SLA** | Service level agreement status |
| **Area** | Floor or zone location |
| **Building** | Building name |
| **Assignees** | Users assigned to the event |
| **Event ID** | Unique event identifier |
| **Incident ID** | Linked incident identifier |
| **Notified** | Whether notifications were sent |
| **Ack'ed** | Acknowledgment status |
Customize which columns appear and their order using the column configuration icon in the upper-right corner of the table. Pagination controls at the bottom let you configure the number of lines per page.
Click any row to open the event report.
### Bulk acknowledge
Select the checkboxes on the left side of the table to choose one or more events. Use Shift + click to select a range. A footer appears with `Acknowledge` and `Create Work Order` actions.
Select `Acknowledge` to confirm. Based on your permissions, you may only be able to acknowledge events assigned to you. The count on the `Acknowledge` button shows how many of the selected events you can acknowledge.
### Create work orders per event
Create **one work order per selected event** from the Events list. Select events with row checkboxes or the header select-all control. In the list footer, select `Create Work Order` (badged with the selection count). The button uses the same work order creation permission as a single-event work order.
This flow does not combine several events into one work order.
Select the events that need field response. The footer shows `Acknowledge` and `Create Work Order` with the live selection count.
The review dialog lists one row per selected event with **Event Name**, **Device Name**, **Event ID**, and **Status**. Sort columns and page through the list as needed. Use the delete icon on a row to remove that event from the batch without returning to the table.
These statuses describe the work order inside the bulk creation workflow. They are not the operational status of the work order in the destination CMMS.
| Status | Meaning |
| ------------------- | ------------------------------------------------------------------------------------------------------------------------------------------------------------------------------------------------------------------------- |
| **To Be Completed** | One or more required fields still need values. You cannot send the work order in this state. |
| **Ready** | All required fields are populated. You can send the work order individually or include it in `Send Work Orders`. |
| **Sent** | The work order was submitted successfully. You cannot edit or discard it within the bulk creation workflow. |
| **Not Sent** | The work order was part of a submit-all action but was not submitted, usually because required fields were still incomplete. It remains available for review. When all required fields are populated, it becomes `Ready`. |
Select `Send Work Orders` to send every ready work order in one action. Select `Review Each` to open the standard work order form for the first event and walk the set one by one.
The form uses the same fields as single-event creation (name, data source, entity, action, title, description, category, subcategory, location, device link, and priority). The header shows the event name, status chip, **Event N of M**, previous and next controls, and a dropdown to jump to any event in the batch. Use **Back** or **Back to Selected Events** to return to the review dialog.
After submission, the dialog reports **Sent** or **Not Sent** per row:
* All succeeded — every selected work order was sent to the external system
* Partial failure — some sent and some not sent; continue editing incomplete rows until they are `Ready`, then send again
* Total failure — none were created; complete required fields and try again
In the Review Each path, outcomes can also appear inline in the submission dialog. Successfully created work orders appear under [Generated Work Orders](/products/fdd/work-orders#work-order-view) with single-event work orders.
Select `Cancel Creation` only when you intend to leave the flow. The **Discard Work Order Creation?** confirmation warns that unsaved progress and the current selection are lost. Choose `Keep Working` to stay in the flow.
There is no bulk apply of category, priority, or location across the batch. Editing in Review Each is one event at a time. Failed submissions are not retried automatically.
### Export
Select the download icon from the table toolbar to open the Export Options dialog. Configure the maximum number of rows (default 1,000), select the export type (`CSV` or `PDF`), and choose which columns to include.
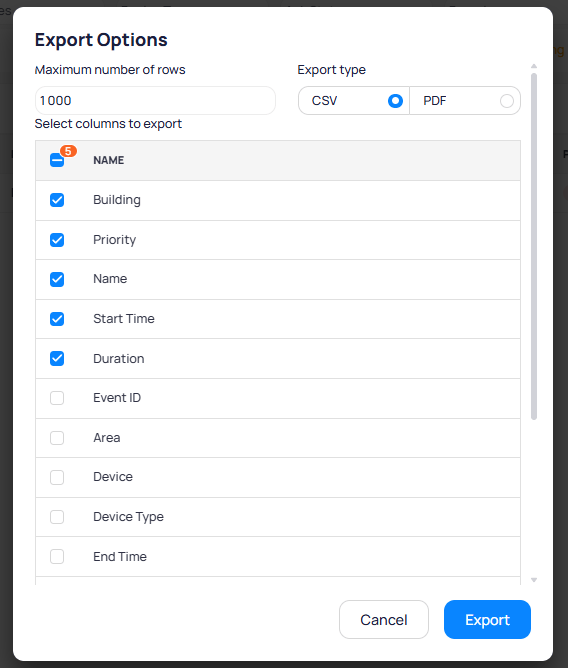 Any active filters also apply to the exported data.
### Full screen mode
Select the full screen button in the upper-right corner to maximize the table view for a wider display.
## Acknowledge events
Only users assigned to the event's notification policy can acknowledge it. FDD adds policy recipients as event assignees when it sends notifications.
Each event has one acknowledgment, not one per assignee. If someone else already acknowledged it, you do not need to acknowledge again. You also need building access for that site.
You can acknowledge from the event report header, from the Events list footer after selecting rows, or through the acknowledgment link in email notifications.
If the **Acknowledge** button is unavailable, confirm that your account or role is listed in the policy assigned to the event. See [Notification policies](/products/fdd/notification-policies) for policy configuration.
## Event report
Select an event from the table to open its report page. The event report provides automated trend charts, device context, and collaboration tools for investigating a single event.
Any active filters also apply to the exported data.
### Full screen mode
Select the full screen button in the upper-right corner to maximize the table view for a wider display.
## Acknowledge events
Only users assigned to the event's notification policy can acknowledge it. FDD adds policy recipients as event assignees when it sends notifications.
Each event has one acknowledgment, not one per assignee. If someone else already acknowledged it, you do not need to acknowledge again. You also need building access for that site.
You can acknowledge from the event report header, from the Events list footer after selecting rows, or through the acknowledgment link in email notifications.
If the **Acknowledge** button is unavailable, confirm that your account or role is listed in the policy assigned to the event. See [Notification policies](/products/fdd/notification-policies) for policy configuration.
## Event report
Select an event from the table to open its report page. The event report provides automated trend charts, device context, and collaboration tools for investigating a single event.
 ### Event header
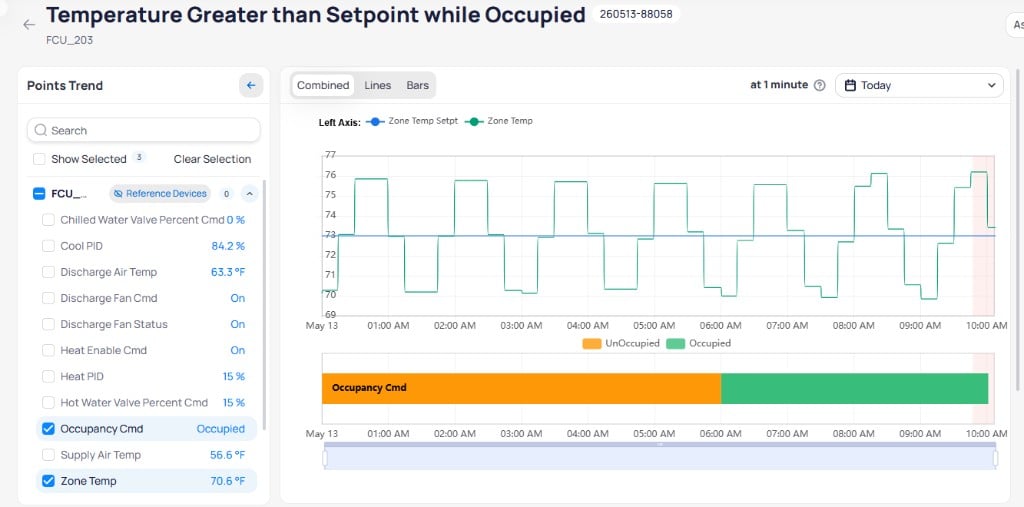
The header displays the event name, device name, event ID, and assigned users as avatar icons. If you are a policy assignee, select `Acknowledge` to confirm you have reviewed the event.
### Device point trends
FDD generates automated trend charts for the device associated with the event. Use the time range controls and date picker at the top right to adjust the visible window. Switch between display modes:
| Mode | Description |
| ------------ | ------------------------------------------------- |
| **Combined** | All points on a single chart |
| **Lines** | Each point displayed as a line on separate charts |
| **Bars** | Bar chart format for discrete values |
### Point selection panel
The Points Trend panel on the left lists all available points for the device with their live values. Search for specific points or check their checkbox to toggle visibility on the trend chart. Select `Show Selected` to display only checked points. Select `Clear Selection` to reset. Use the `Reference Devices` tab to view and overlay points from related devices.
## Event details sidebar
The sidebar on the right side of the event report contains multiple sections accessible through icon tabs. Each tab provides a different layer of context for investigating the event.
### Details
Displays core event information including the fault condition description, current state, priority level, triggering point name and value, timestamps, duration, and the affected device, area, and building.
### Event header
The header displays the event name, device name, event ID, and assigned users as avatar icons. If you are a policy assignee, select `Acknowledge` to confirm you have reviewed the event.
### Device point trends
FDD generates automated trend charts for the device associated with the event. Use the time range controls and date picker at the top right to adjust the visible window. Switch between display modes:
| Mode | Description |
| ------------ | ------------------------------------------------- |
| **Combined** | All points on a single chart |
| **Lines** | Each point displayed as a line on separate charts |
| **Bars** | Bar chart format for discrete values |
### Point selection panel
The Points Trend panel on the left lists all available points for the device with their live values. Search for specific points or check their checkbox to toggle visibility on the trend chart. Select `Show Selected` to display only checked points. Select `Clear Selection` to reset. Use the `Reference Devices` tab to view and overlay points from related devices.
## Event details sidebar
The sidebar on the right side of the event report contains multiple sections accessible through icon tabs. Each tab provides a different layer of context for investigating the event.
### Details
Displays core event information including the fault condition description, current state, priority level, triggering point name and value, timestamps, duration, and the affected device, area, and building.
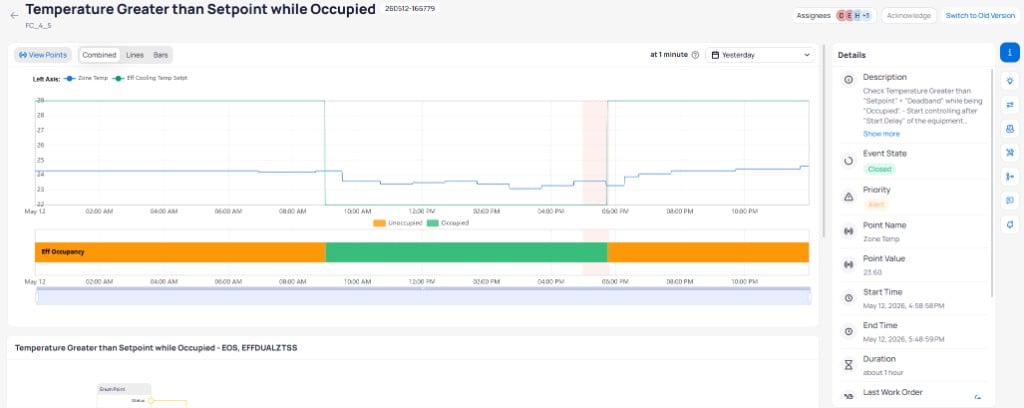 | Field | Description |
| ------------------------- | ----------------------------------------------------------------------------------------------------------------------------------------------------- |
| `Description` | Explains the fault condition logic, including setpoint, `deadband`, occupancy, and delay behavior. Select `Show more` to expand the full description. |
| `Event State` | Current state of the event (Active or Closed) |
| `Priority` | Severity level assigned to the routine |
| `Point Name` | The data point that triggered the event |
| `Point Value` | The value of the triggering point at the time of the event |
| `Start Time` / `End Time` | When the event began and ended |
| `Duration` | Total event duration |
| `Last Work Order` | Most recent work order linked to the event |
| `Incident` | Linked incident identifier. Select to navigate to the incident report. |
| `Device` | The device that triggered the event. Select to navigate to the device details page. |
| `Area` | Floor or zone where the device is located. Select to navigate to the area page. |
| `Building` | Building name. Select to navigate to the building overview. |
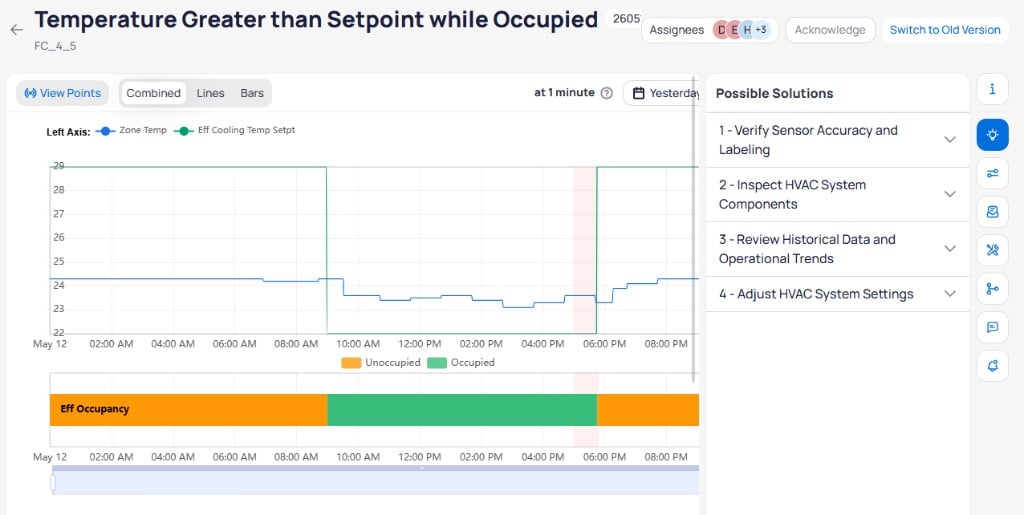
### Possible solutions
Lists recommended actions to resolve the fault. Each solution is an expandable card that you can select to view detailed troubleshooting steps.
| Field | Description |
| ------------------------- | ----------------------------------------------------------------------------------------------------------------------------------------------------- |
| `Description` | Explains the fault condition logic, including setpoint, `deadband`, occupancy, and delay behavior. Select `Show more` to expand the full description. |
| `Event State` | Current state of the event (Active or Closed) |
| `Priority` | Severity level assigned to the routine |
| `Point Name` | The data point that triggered the event |
| `Point Value` | The value of the triggering point at the time of the event |
| `Start Time` / `End Time` | When the event began and ended |
| `Duration` | Total event duration |
| `Last Work Order` | Most recent work order linked to the event |
| `Incident` | Linked incident identifier. Select to navigate to the incident report. |
| `Device` | The device that triggered the event. Select to navigate to the device details page. |
| `Area` | Floor or zone where the device is located. Select to navigate to the area page. |
| `Building` | Building name. Select to navigate to the building overview. |
### Possible solutions
Lists recommended actions to resolve the fault. Each solution is an expandable card that you can select to view detailed troubleshooting steps.
 ### Parameters
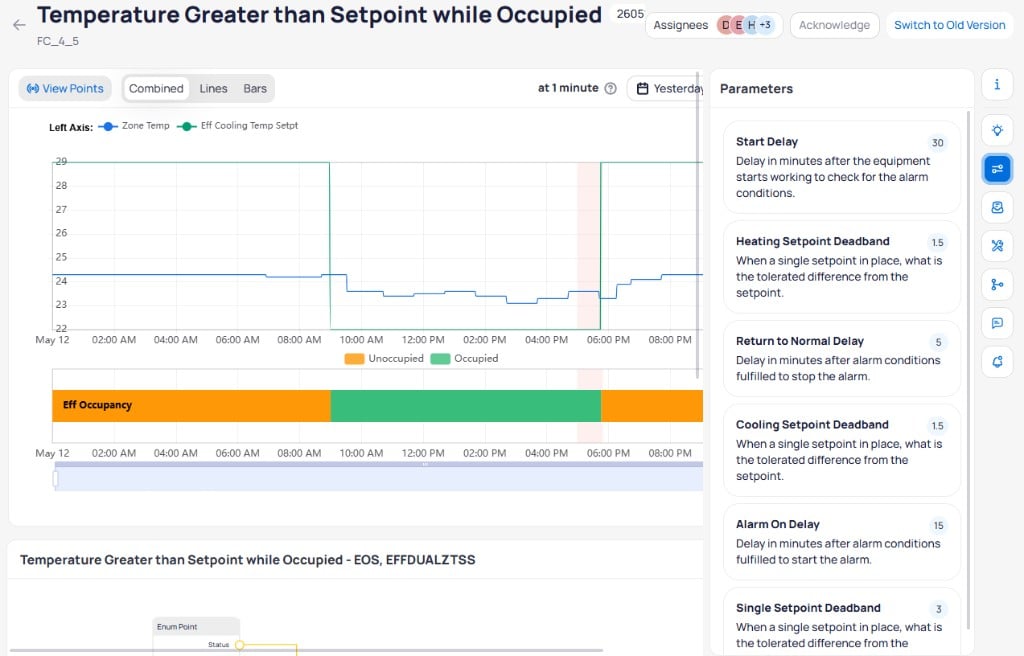
Shows the tuning parameter values configured for the routine that generated the event. Each parameter card displays the parameter name, its current value, and a description of its function.
### Parameters
Shows the tuning parameter values configured for the routine that generated the event. Each parameter card displays the parameter name, its current value, and a description of its function.
 ### Historical
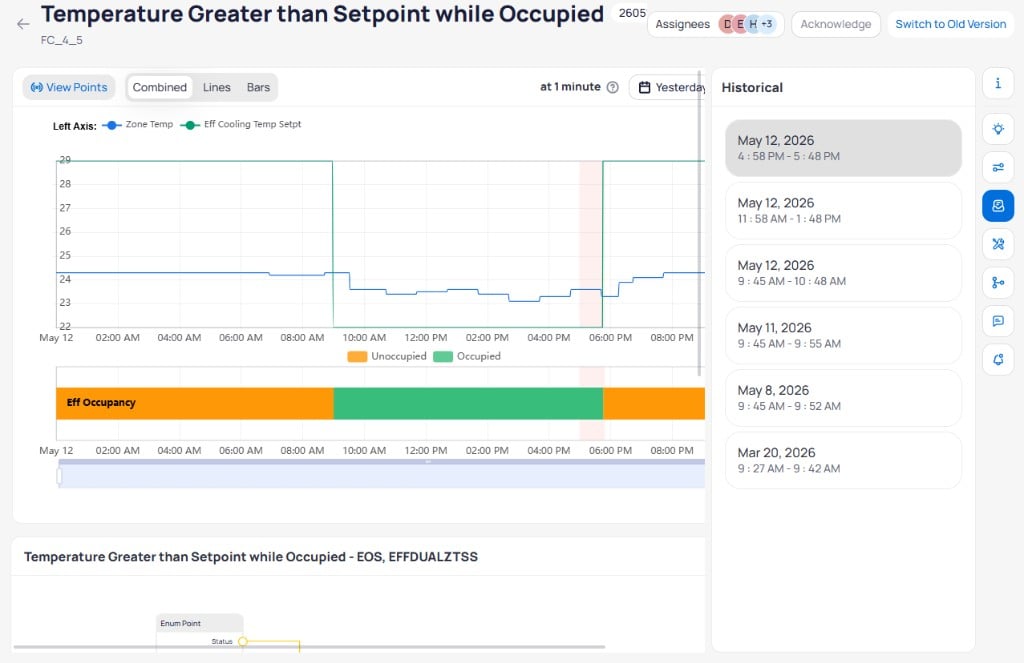
Lists past occurrences of the same event on the same device. Each entry shows the date and time range. Select any historical entry to navigate to that event's report. Use this section to identify recurring patterns and assess whether the fault is intermittent or persistent.
### Historical
Lists past occurrences of the same event on the same device. Each entry shows the date and time range. Select any historical entry to navigate to that event's report. Use this section to identify recurring patterns and assess whether the fault is intermittent or persistent.
 ### Work orders
Displays linked work orders for the event. Select `+` to [create a new work order](/products/fdd/work-orders#generate-a-work-order-from-an-event) directly from the event report. To create one work order for each of several events from the list, see [Create work orders per event](#create-work-orders-per-event).
### Referenced devices
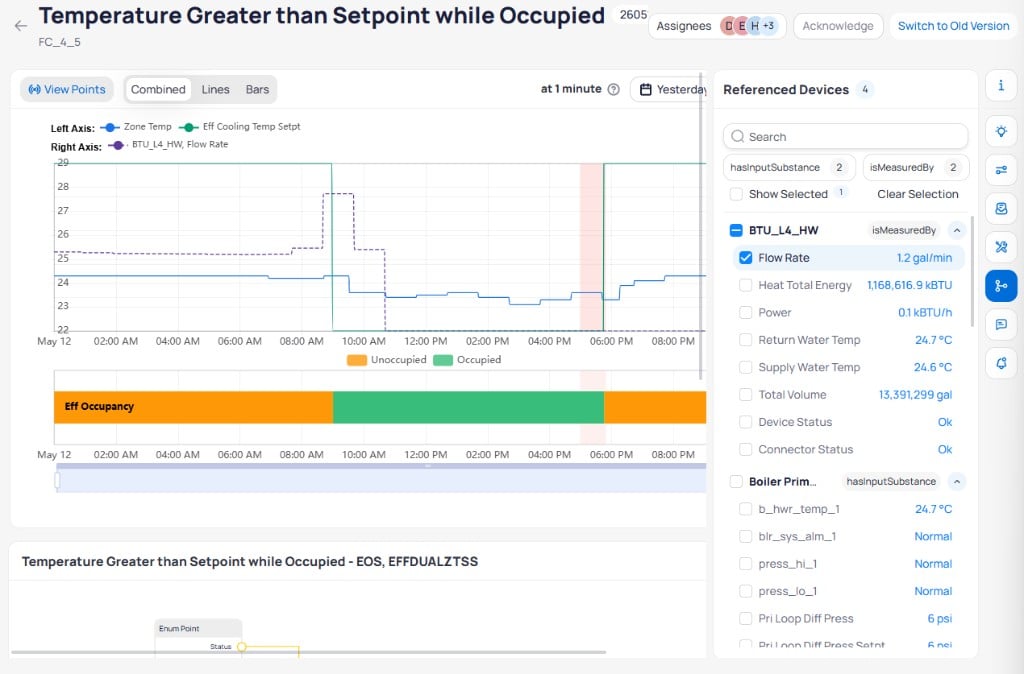
Lists related devices grouped by ontology relationship type (for example, `hasInputSubstance`, `isMeasuredBy`). Select a device to expand its point list and view live values. Check a point's checkbox to overlay it on the trend chart for comparison. Use the search bar and relationship filters to narrow the list.
### Work orders
Displays linked work orders for the event. Select `+` to [create a new work order](/products/fdd/work-orders#generate-a-work-order-from-an-event) directly from the event report. To create one work order for each of several events from the list, see [Create work orders per event](#create-work-orders-per-event).
### Referenced devices
Lists related devices grouped by ontology relationship type (for example, `hasInputSubstance`, `isMeasuredBy`). Select a device to expand its point list and view live values. Check a point's checkbox to overlay it on the trend chart for comparison. Use the search bar and relationship filters to narrow the list.
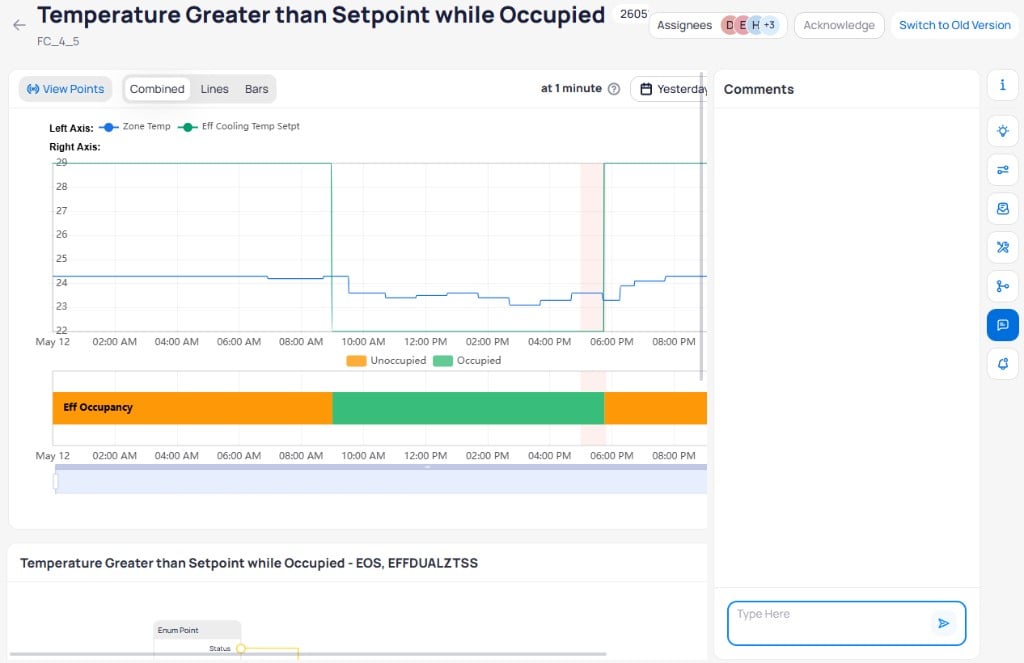
 ### Comments
A shared space for team collaboration. Type a message in the text field and select the send button to post a comment. All team members with access to the event can view and reply to comments.
### Comments
A shared space for team collaboration. Type a message in the text field and select the send button to post a comment. All team members with access to the event can view and reply to comments.
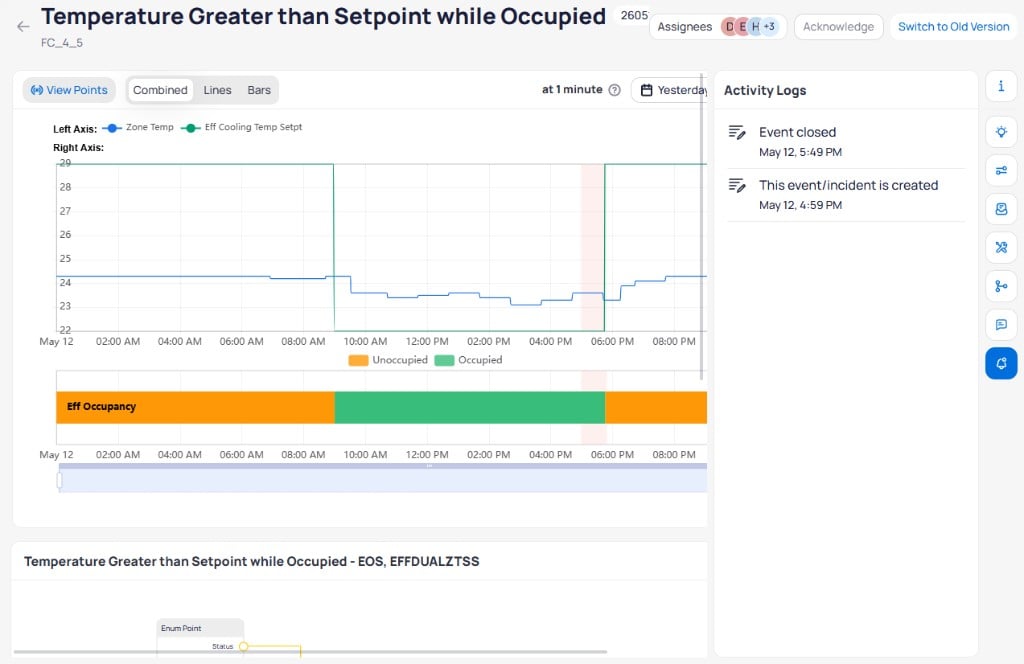
 ### Activity logs
An audit trail of all actions and updates associated with the event. Each entry shows the action taken and a timestamp. Activity logs track event lifecycle changes such as creation, closure, acknowledgments, and status updates.
### Activity logs
An audit trail of all actions and updates associated with the event. Each entry shows the action taken and a timestamp. Activity logs track event lifecycle changes such as creation, closure, acknowledgments, and status updates.
 ## Incidents view
Switch to the `Incidents` view using the `Incidents` toggle above the table. Incidents group related events by finding commonalities through ontology relationships, reducing the number of individual issues you need to investigate.
## Incidents view
Switch to the `Incidents` view using the `Incidents` toggle above the table. Incidents group related events by finding commonalities through ontology relationships, reducing the number of individual issues you need to investigate.
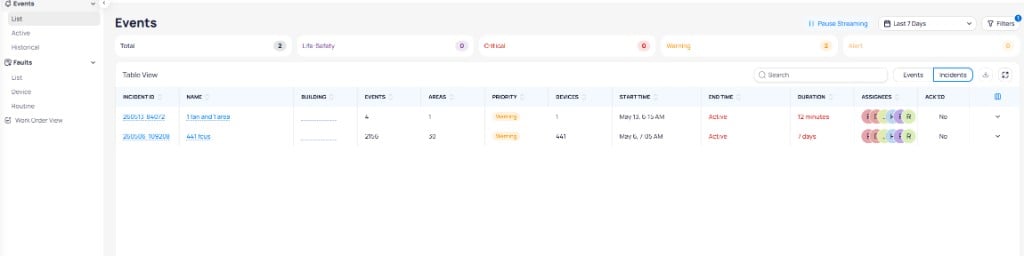 FDD creates incidents using Reference Based Grouping. For example, if a VAV cannot meet its room temperature setpoint, the system checks whether the associated AHU or sibling VAVs also have active events. Related events are grouped under a single incident.
### Incidents table
The incidents table lists each incident as a row. Search incidents by `Incident ID`, `Building`, or `Routines`. Click the expand icon on the right side of any row to reveal an inline incident summary without leaving the table.
Click any row to open the full incident report.
### Incident report
The incident report displays the incident ID in the header along with assignee avatars and an `Acknowledge` button for policy assignees. Summary cards at the top show **Number of Events**, **Average Event Duration**, and **Affected Areas**.
FDD creates incidents using Reference Based Grouping. For example, if a VAV cannot meet its room temperature setpoint, the system checks whether the associated AHU or sibling VAVs also have active events. Related events are grouped under a single incident.
### Incidents table
The incidents table lists each incident as a row. Search incidents by `Incident ID`, `Building`, or `Routines`. Click the expand icon on the right side of any row to reveal an inline incident summary without leaving the table.
Click any row to open the full incident report.
### Incident report
The incident report displays the incident ID in the header along with assignee avatars and an `Acknowledge` button for policy assignees. Summary cards at the top show **Number of Events**, **Average Event Duration**, and **Affected Areas**.
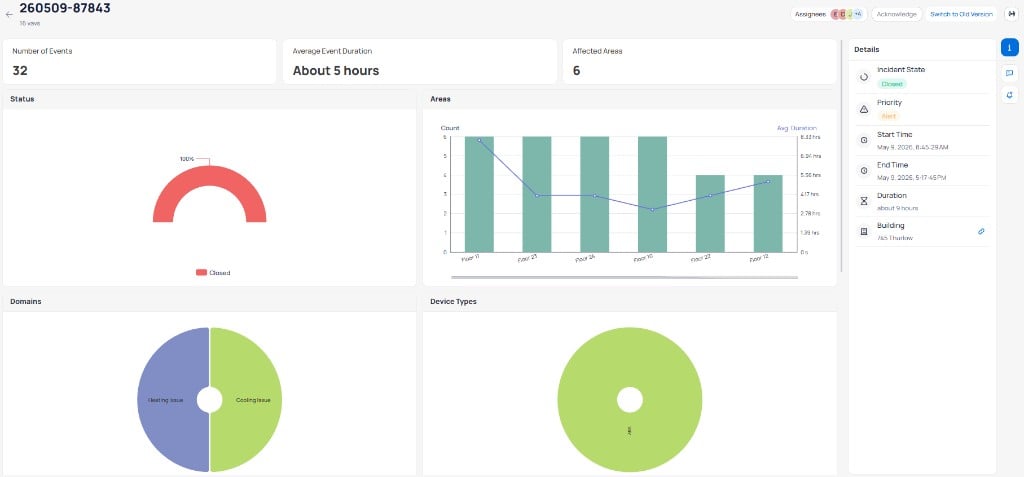 **Overview visualizations** display below the summary cards:
| Widget | Description |
| ---------------- | ------------------------------------------------------------------------------------------- |
| **Status** | Donut chart showing the percentage of events by status (Closed, Active) |
| **Areas** | Bar chart ranking affected areas by event count, with an overlaid line for average duration |
| **Domains** | Donut chart breaking down events by fault domain |
| **Device Types** | Donut chart breaking down events by equipment type |
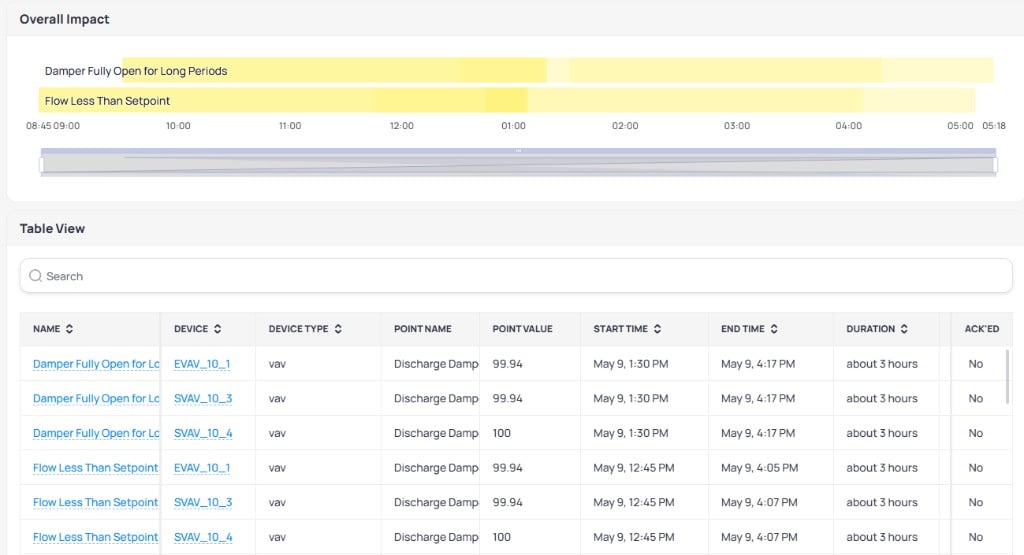
**Overall Impact** displays a timeline view of each routine involved in the incident. Color intensity represents the number of affected devices over time. Use the scrubber bar below to zoom into a specific time window.
**Table View** lists all events contributing to the incident in a sortable table with columns for Name, Device, Device Type, Point Name, Point Value, Start Time, End Time, Duration, and Ack'ed. Select any event row to open the event report. Select a device name to navigate to the device details page.
**Overview visualizations** display below the summary cards:
| Widget | Description |
| ---------------- | ------------------------------------------------------------------------------------------- |
| **Status** | Donut chart showing the percentage of events by status (Closed, Active) |
| **Areas** | Bar chart ranking affected areas by event count, with an overlaid line for average duration |
| **Domains** | Donut chart breaking down events by fault domain |
| **Device Types** | Donut chart breaking down events by equipment type |
**Overall Impact** displays a timeline view of each routine involved in the incident. Color intensity represents the number of affected devices over time. Use the scrubber bar below to zoom into a specific time window.
**Table View** lists all events contributing to the incident in a sortable table with columns for Name, Device, Device Type, Point Name, Point Value, Start Time, End Time, Duration, and Ack'ed. Select any event row to open the event report. Select a device name to navigate to the device details page.
 Select `Select Points` to choose points across multiple devices for trend comparison. A trend chart appears below the table, plotting the selected points over time.
### Incident details sidebar
The sidebar on the right side of the incident report contains three tabs accessible through icon buttons.
**Details** -- displays core incident information:
| Field | Description |
| ---------------- | ------------------------------------------------ |
| `Incident State` | Current state of the incident (Active or Closed) |
| `Priority` | Severity level of the incident |
| `Start Time` | When the incident began |
| `End Time` | When the incident ended |
| `Duration` | Total incident duration |
| `Building` | Building name (select the edit icon to reassign) |
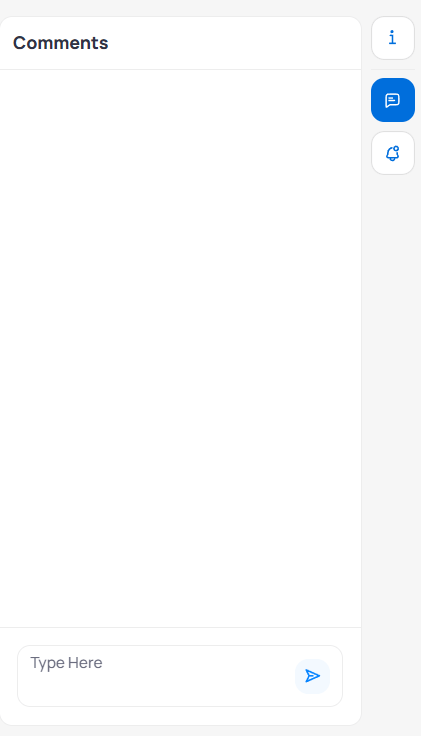
**Comments** -- a shared space for team collaboration. Type a message and select the send button to post a comment.
Select `Select Points` to choose points across multiple devices for trend comparison. A trend chart appears below the table, plotting the selected points over time.
### Incident details sidebar
The sidebar on the right side of the incident report contains three tabs accessible through icon buttons.
**Details** -- displays core incident information:
| Field | Description |
| ---------------- | ------------------------------------------------ |
| `Incident State` | Current state of the incident (Active or Closed) |
| `Priority` | Severity level of the incident |
| `Start Time` | When the incident began |
| `End Time` | When the incident ended |
| `Duration` | Total incident duration |
| `Building` | Building name (select the edit icon to reassign) |
**Comments** -- a shared space for team collaboration. Type a message and select the send button to post a comment.
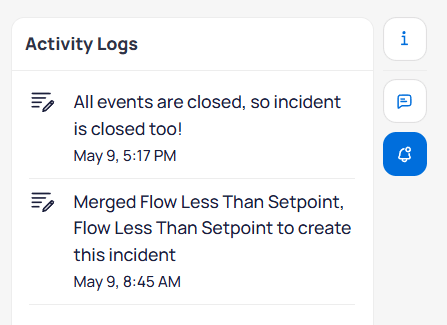
 **Activity Logs** -- an audit trail of all actions associated with the incident. Each entry shows the action taken and a timestamp.
 ## Advanced use cases
### Subsystem alarm ingestion and writeback
Subsystem alarm ingestion and acknowledgment writeback are limited-release capabilities. They are not available on all environments. Contact your KODE representative if your organization needs this workflow.
Cloud BMS can ingest native alarms from connected subsystems through [data sources](/products/kode-os/data-sources). This brings BMS and other subsystem alarms into the same Events workflow as routine-generated faults. Operators can view, acknowledge, comment on, and create work orders without switching to the source console.
Niagara is the first supported connector. Additional subsystems will use the same normalized alarm structure in future releases.
#### Capabilities
| Capability | Description |
| --------------------------------- | ----------------------------------------------------------------------------------------------------------- |
| **Alarm visualization** | Alarms enabled in the source system appear in KODE when alarm ingestion is configured on the connector |
| **Bi-directional acknowledgment** | Acknowledging an alarm in KODE writes back to the source system. Acknowledgments in the source sync to KODE |
| **Trend context** | Device trend data appears on the event report when available for the associated equipment |
| **Comments and SLA** | Use the same collaboration tools and SLA tracking as routine-generated events |
| **Work orders** | Create work orders directly from subsystem alarm events |
#### Current limitations
V1 imports all alarms enabled in the source system. Selective filtering by priority, domain, or alarm name is not available yet. [Notification policies](/products/fdd/notification-policies) do not route email, SMS, or push alerts for subsystem alarms in V1. KODE does not show inline confirmation when acknowledgment writeback succeeds or fails.
FDD routines and subsystem alarms run in parallel. Routine-based FDD is not replaced by alarm ingestion.
#### Acknowledgment writeback
**Ack writeback** sends an acknowledgment from KODE back to the source subsystem when you acknowledge an alarm on the Events list or event report. This keeps both systems in sync and helps prevent unacknowledged alarms from accumulating in the BMS queue.
Acknowledgments made in the source system also appear in KODE. See [Acknowledge events](#acknowledge-events) for list and report workflows.
## Next steps
Track recurring equipment issues and manage long-term maintenance priorities.
View building health at a glance with active and historical event dashboards.
Set up monitoring rules and parameters for your building equipment.
Configure connectors used by limited-release subsystem alarm ingestion.
## Advanced use cases
### Subsystem alarm ingestion and writeback
Subsystem alarm ingestion and acknowledgment writeback are limited-release capabilities. They are not available on all environments. Contact your KODE representative if your organization needs this workflow.
Cloud BMS can ingest native alarms from connected subsystems through [data sources](/products/kode-os/data-sources). This brings BMS and other subsystem alarms into the same Events workflow as routine-generated faults. Operators can view, acknowledge, comment on, and create work orders without switching to the source console.
Niagara is the first supported connector. Additional subsystems will use the same normalized alarm structure in future releases.
#### Capabilities
| Capability | Description |
| --------------------------------- | ----------------------------------------------------------------------------------------------------------- |
| **Alarm visualization** | Alarms enabled in the source system appear in KODE when alarm ingestion is configured on the connector |
| **Bi-directional acknowledgment** | Acknowledging an alarm in KODE writes back to the source system. Acknowledgments in the source sync to KODE |
| **Trend context** | Device trend data appears on the event report when available for the associated equipment |
| **Comments and SLA** | Use the same collaboration tools and SLA tracking as routine-generated events |
| **Work orders** | Create work orders directly from subsystem alarm events |
#### Current limitations
V1 imports all alarms enabled in the source system. Selective filtering by priority, domain, or alarm name is not available yet. [Notification policies](/products/fdd/notification-policies) do not route email, SMS, or push alerts for subsystem alarms in V1. KODE does not show inline confirmation when acknowledgment writeback succeeds or fails.
FDD routines and subsystem alarms run in parallel. Routine-based FDD is not replaced by alarm ingestion.
#### Acknowledgment writeback
**Ack writeback** sends an acknowledgment from KODE back to the source subsystem when you acknowledge an alarm on the Events list or event report. This keeps both systems in sync and helps prevent unacknowledged alarms from accumulating in the BMS queue.
Acknowledgments made in the source system also appear in KODE. See [Acknowledge events](#acknowledge-events) for list and report workflows.
## Next steps
Track recurring equipment issues and manage long-term maintenance priorities.
View building health at a glance with active and historical event dashboards.
Set up monitoring rules and parameters for your building equipment.
Configure connectors used by limited-release subsystem alarm ingestion.