> ## Documentation Index
> Fetch the complete documentation index at: https://documentation.kodelabs.com/llms.txt
> Use this file to discover all available pages before exploring further.
# Capital planning
> Set baseline periods, utility rates, and building context for decarbonization planning in EnerG
Model energy conservation measures and projected savings for one building with capital planning. In the [building view](/products/energ/get-started/navigation#building-view), click **Capital Planning** in the left sidebar. Start on **Basic Information** to set project parameters before you create measures or scenarios. For the underlying concepts, see [Measures, curves, and scenarios](/products/energ/concepts/budgets-and-capital-planning#measures-curves-and-scenarios).
For portfolio-wide scenario comparison, see [Portfolio capital planning](/products/energ/analytics/portfolio-capital-planning).
## Capital Planning menu
After you open **Capital Planning**, a secondary menu lists the workflow pages.
| Page | Purpose |
| --------------------- | -------------------------------------------------------------------------- |
| **Basic Information** | Building context, baseline period, usage charts, and utility rate settings |
| **Measure Creation** | Define individual conservation measures |
| **Scenario Planner** | Bundle measures into scenarios |
| **Scenario Analysis** | Review savings and financial metrics per scenario |
| **Comparison** | Compare scenarios side by side |
Complete [Basic Information](#open-basic-information) before you open **Measure Creation**, **Scenario Planner**, **Scenario Analysis**, or **Comparison**.
From [Portfolio Home](/products/energ/analytics/benchmarking), open a building in the building view.
Click **Capital Planning** in the left sidebar, then select **Basic Information** in the Capital Planning menu.
The page subtitle explains the goal: establish the foundation for effective decarbonization by setting up your project parameters.
 ## Building and target settings
The **Building & Target Settings** card summarizes inputs EnerG pulls from the building record.
| Field | What it shows |
| ----------------------------------------- | --------------------------------------------------------------------------- |
| **Building Name** | Site label |
| **Primary Heating** / **Primary Cooling** | Dominant HVAC types when configured |
| **Building Area** | Gross floor area used in intensity metrics |
| **Service Types** | Active commodities, such as **Natural Gas**, **Electric**, and **Lighting** |
Click **Go to Building Info** to update area, systems, or service types on [Building information](/products/energ/buildings/building-information).
## Building and target settings
The **Building & Target Settings** card summarizes inputs EnerG pulls from the building record.
| Field | What it shows |
| ----------------------------------------- | --------------------------------------------------------------------------- |
| **Building Name** | Site label |
| **Primary Heating** / **Primary Cooling** | Dominant HVAC types when configured |
| **Building Area** | Gross floor area used in intensity metrics |
| **Service Types** | Active commodities, such as **Natural Gas**, **Electric**, and **Lighting** |
Click **Go to Building Info** to update area, systems, or service types on [Building information](/products/energ/buildings/building-information).
Define baseline period
Set the historical window that measures and scenarios use as the reference for savings.
| Control | Purpose |
| ----------------------------- | ---------------------------------------------------------------- |
| **Start Date** / **End Date** | Baseline range, such as **05/25/2025 – 05/25/2026** |
| **Edit** | Change dates after the initial setup |
| **Service Type** | Commodity for the summary metrics and chart below |
| **Annual Usage** | Total usage for the selected service type in the baseline window |
| **Annual Cost** | Total cost for the same period |
Pick a period with stable operations and reliable [meter](/products/energ/buildings/meters) coverage. A full calendar year is typical so seasonal patterns appear in charts.
## Visualize baseline usage
Scroll below the baseline settings for a multi-series chart and configuration table.
 | Control | Purpose |
| --------------------------- | ------------------------------------------------------------ |
| **Show Weather Data** | Overlay temperature on the chart to explain seasonal drivers |
| **Usage** (green bars) | Monthly consumption for the selected service type |
| **Cost** (orange line) | Monthly spend aligned to usage |
| **Temperature** (blue line) | Outdoor temperature when weather overlay is on |
Use the chart to confirm heating or cooling peaks match expectations before you assign savings curves on [Measure Creation](#measure-creation).
## Factors and calculations configuration
The **Factors & Calculations Configuration** table sets rates and degree-day base temperatures per utility type. See [Weather normalization](/products/energ/reference/calculations-and-parameters#weather-normalization) for degree-day settings.
| Column | Purpose |
| -------------------- | ------------------------------------------------------------------------------- |
| **Utility Type** | Service category, such as **Natural Gas**, **Electric**, or **Lighting** |
| **Utility Rate** | Blended cost per unit for simple cost translation |
| **Base Temperature** | Reference temperature for heating and cooling degree-day logic, often **65 °F** |
| **Actions** | Edit icon to update rate or base temperature |
Confirm **Utility Rate** matches the tariff class or blended average you use in audit narratives and [Budget planning](/products/energ/finance/budget-planning) rate analysis.
| Control | Purpose |
| --------------------------- | ------------------------------------------------------------ |
| **Show Weather Data** | Overlay temperature on the chart to explain seasonal drivers |
| **Usage** (green bars) | Monthly consumption for the selected service type |
| **Cost** (orange line) | Monthly spend aligned to usage |
| **Temperature** (blue line) | Outdoor temperature when weather overlay is on |
Use the chart to confirm heating or cooling peaks match expectations before you assign savings curves on [Measure Creation](#measure-creation).
## Factors and calculations configuration
The **Factors & Calculations Configuration** table sets rates and degree-day base temperatures per utility type. See [Weather normalization](/products/energ/reference/calculations-and-parameters#weather-normalization) for degree-day settings.
| Column | Purpose |
| -------------------- | ------------------------------------------------------------------------------- |
| **Utility Type** | Service category, such as **Natural Gas**, **Electric**, or **Lighting** |
| **Utility Rate** | Blended cost per unit for simple cost translation |
| **Base Temperature** | Reference temperature for heating and cooling degree-day logic, often **65 °F** |
| **Actions** | Edit icon to update rate or base temperature |
Confirm **Utility Rate** matches the tariff class or blended average you use in audit narratives and [Budget planning](/products/energ/finance/budget-planning) rate analysis.
Measure Creation
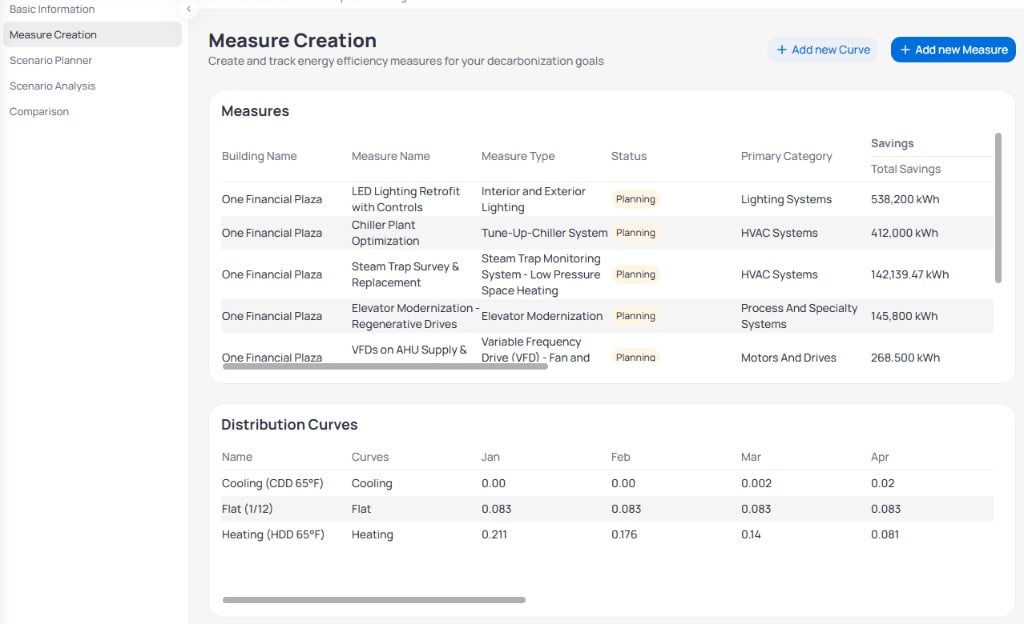
Select **Measure Creation** in the Capital Planning menu to add conservation measures and manage distribution curves for the building.
Add a new measure
Click **+ Add new Measure** to open the **Add New Measure** panel.
 | Field | Purpose |
| ------------------------- | ------------------------------------------------------------------------ |
| **Measure Name** | Project label shown in the measures table |
| **Primary Category** | Grouping such as **Lighting Systems** or **HVAC Systems** |
| **Curve** | Distribution curve from the table below, such as **Flat** or **Heating** |
| **Status** | **Planning**, **Implementation**, or **Operations** |
| **Service Types** | Fuels affected by the measure |
| **Capital Cost (\$)** | Upfront project cost |
| **Incentive Amount (\$)** | Rebates or grants applied to payback |
| **Incentive Source** | Program or funder name for audit trails |
Click **Save** to add the row. EnerG calculates payback and fuel-specific savings columns after you save. Additional fields may appear when you select multiple service types.
| Field | Purpose |
| ------------------------- | ------------------------------------------------------------------------ |
| **Measure Name** | Project label shown in the measures table |
| **Primary Category** | Grouping such as **Lighting Systems** or **HVAC Systems** |
| **Curve** | Distribution curve from the table below, such as **Flat** or **Heating** |
| **Status** | **Planning**, **Implementation**, or **Operations** |
| **Service Types** | Fuels affected by the measure |
| **Capital Cost (\$)** | Upfront project cost |
| **Incentive Amount (\$)** | Rebates or grants applied to payback |
| **Incentive Source** | Program or funder name for audit trails |
Click **Save** to add the row. EnerG calculates payback and fuel-specific savings columns after you save. Additional fields may appear when you select multiple service types.
Create a custom curve
Click **+ Add new Curve** to open the **Create Custom Curve** panel when default cooling, heating, or flat curves do not fit your measure.
 | Field | Purpose |
| ---------------------- | -------------------------------------------- |
| **Curve Name** | Label in the **Distribution Curves** table |
| **Curve Type** | Curve family EnerG uses for allocation logic |
| **January – December** | Monthly factor for each month |
Monthly values must total **1.000** for annual distribution. The footer shows **Total Sum** and a validation message until the monthly factors sum to one.
Click **Create Curve** when the sum reaches **1.000**. The new curve appears in the **Curve** dropdown on **Add New Measure**.
### Measures table
The **Measures** table lists every conservation project for the building. Scroll horizontally to see financial and fuel-specific columns.
| Column | What it shows |
| ------------------------- | ---------------------------------------------------------------------------- |
| **Building Name** | Site the measure applies to |
| **Measure Name** | Project label, such as **LED Lighting Retrofit with Controls** |
| **Measure Type** | Specific technology, such as **Interior and Exterior Lighting** |
| **Status** | Lifecycle state, such as **Planning**, **Implementation**, or **Operations** |
| **Primary Category** | Grouping, such as **Lighting Systems** or **HVAC Systems** |
| **Total Savings** | Annual energy reduction, such as **538,200 kWh** |
| **Cost Savings** | Annual cost impact, such as **\$75,348** |
| **Electric Saving** | Electric commodity savings when applicable |
| **Water Saving** | Water savings when applicable |
| **District Steam Saving** | Steam savings when applicable |
| **Consumption Savings** | Combined consumption impact across fuels |
| **Payback (Years)** | Simple payback from capital cost, incentives, and savings |
| **Capital Cost** | Upfront project cost, such as **\$285,000** |
| **Incentive Amount** | Rebates or grants, such as **\$64,600** |
| **Actions** | Edit or delete the measure |
Set **Operations** status only when the **operation date** is in the past and savings have started.
When a measure reaches **Operations**, EnerG can connect it to [M\&V models](/products/energ/energy-modeling/mv-models). Keep the measure record aligned with the meters and models that prove savings.
| Field | Purpose |
| ---------------------- | -------------------------------------------- |
| **Curve Name** | Label in the **Distribution Curves** table |
| **Curve Type** | Curve family EnerG uses for allocation logic |
| **January – December** | Monthly factor for each month |
Monthly values must total **1.000** for annual distribution. The footer shows **Total Sum** and a validation message until the monthly factors sum to one.
Click **Create Curve** when the sum reaches **1.000**. The new curve appears in the **Curve** dropdown on **Add New Measure**.
### Measures table
The **Measures** table lists every conservation project for the building. Scroll horizontally to see financial and fuel-specific columns.
| Column | What it shows |
| ------------------------- | ---------------------------------------------------------------------------- |
| **Building Name** | Site the measure applies to |
| **Measure Name** | Project label, such as **LED Lighting Retrofit with Controls** |
| **Measure Type** | Specific technology, such as **Interior and Exterior Lighting** |
| **Status** | Lifecycle state, such as **Planning**, **Implementation**, or **Operations** |
| **Primary Category** | Grouping, such as **Lighting Systems** or **HVAC Systems** |
| **Total Savings** | Annual energy reduction, such as **538,200 kWh** |
| **Cost Savings** | Annual cost impact, such as **\$75,348** |
| **Electric Saving** | Electric commodity savings when applicable |
| **Water Saving** | Water savings when applicable |
| **District Steam Saving** | Steam savings when applicable |
| **Consumption Savings** | Combined consumption impact across fuels |
| **Payback (Years)** | Simple payback from capital cost, incentives, and savings |
| **Capital Cost** | Upfront project cost, such as **\$285,000** |
| **Incentive Amount** | Rebates or grants, such as **\$64,600** |
| **Actions** | Edit or delete the measure |
Set **Operations** status only when the **operation date** is in the past and savings have started.
When a measure reaches **Operations**, EnerG can connect it to [M\&V models](/products/energ/energy-modeling/mv-models). Keep the measure record aligned with the meters and models that prove savings.
Distribution curves
The **Distribution Curves** table defines how annual savings spread across months. EnerG provides default cooling, heating, and flat curves derived from degree-day logic on [Basic Information](#define-baseline-period).
| Column | What it shows |
| ------------- | --------------------------------------------------------------------------------------- |
| **Name** | Curve label, such as **Cooling (CDD 65°F)**, **Heating (HDD 65°F)**, or **Flat (1/12)** |
| **Curves** | Curve family: **Cooling**, **Heating**, or **Flat** |
| **Jan – Dec** | Monthly factor that sums to the annual savings profile |
Assign a curve when you create or edit a measure so EnerG allocates savings without manual spreadsheet work. For when to use each curve type, see [Distribution curves](/products/energ/reference/calculations-and-parameters#distribution-curves).
Scenario Planner
Select **Scenario Planner** in the Capital Planning menu to bundle measures into funding packages. Each scenario lists included measures with implementation and operation dates.
 Click **+ Add new Scenario** to create a bundle. Expand a card to review measures or click **Edit Scenario** to change dates and membership.
### Scenario cards
Each card shows the scenario name, a **priority** tag, and a table of measures when expanded.
| Element | What it shows |
| ----------------------- | ------------------------------------------------------- |
| **Scenario name** | Bundle label, such as **LED Only** or **Full retrofit** |
| **Priority** | **High**, **Medium**, or **Low** planning priority |
| **Measure Name** | Measure included in the bundle |
| **Measure Status** | Status of each measure, such as **Planning** |
| **Implementation Date** | When work begins |
| **Operation Date** | When savings start in reporting |
| **Edit Scenario** | Opens the scenario for changes |
**Implementation date** marks construction or install start. **Operation date** marks when savings first count in forecasts and analysis.
### Create a scenario
Click **+ Add new Scenario** to open the **Create Scenario** panel.
Click **+ Add new Scenario** to create a bundle. Expand a card to review measures or click **Edit Scenario** to change dates and membership.
### Scenario cards
Each card shows the scenario name, a **priority** tag, and a table of measures when expanded.
| Element | What it shows |
| ----------------------- | ------------------------------------------------------- |
| **Scenario name** | Bundle label, such as **LED Only** or **Full retrofit** |
| **Priority** | **High**, **Medium**, or **Low** planning priority |
| **Measure Name** | Measure included in the bundle |
| **Measure Status** | Status of each measure, such as **Planning** |
| **Implementation Date** | When work begins |
| **Operation Date** | When savings start in reporting |
| **Edit Scenario** | Opens the scenario for changes |
**Implementation date** marks construction or install start. **Operation date** marks when savings first count in forecasts and analysis.
### Create a scenario
Click **+ Add new Scenario** to open the **Create Scenario** panel.
 | Field | Purpose |
| --------------------------------------- | -------------------------------------------------------------------------------------------------------------- |
| **Scenario Name** | Label on the scenario card |
| **Priority** | **High**, **Medium**, or **Low** |
| **Select Energy Conservation Measures** | Check each measure to include. Tags show the assigned curve, such as **Flat (1/12)** or **Cooling (CDD 65°F)** |
Click **Create Scenario**, then open **Edit Scenario** on the card to set **Implementation Date** and **Operation Date** per measure when projects phase over time.
Review savings and payback on [Scenario Analysis](#scenario-analysis). Compare bundles on **Comparison** or at the portfolio on [Portfolio capital planning](/products/energ/analytics/portfolio-capital-planning).
| Field | Purpose |
| --------------------------------------- | -------------------------------------------------------------------------------------------------------------- |
| **Scenario Name** | Label on the scenario card |
| **Priority** | **High**, **Medium**, or **Low** |
| **Select Energy Conservation Measures** | Check each measure to include. Tags show the assigned curve, such as **Flat (1/12)** or **Cooling (CDD 65°F)** |
Click **Create Scenario**, then open **Edit Scenario** on the card to set **Implementation Date** and **Operation Date** per measure when projects phase over time.
Review savings and payback on [Scenario Analysis](#scenario-analysis). Compare bundles on **Comparison** or at the portfolio on [Portfolio capital planning](/products/energ/analytics/portfolio-capital-planning).
Scenario Analysis
Select **Scenario Analysis** in the Capital Planning menu to review financial and environmental impacts for a scenario you built on [Scenario Planner](#scenario-planner).
 ### Page controls
| Control | Purpose |
| ------------------------------------------ | ------------------------------------------------------------ |
| **Consumption** / **Cost** / **Emissions** | Switch KPI cards and charts between usage, spend, and kgCO₂e |
| **Energy** | Filter by energy scope or commodity |
| **Scenario** | Select the scenario to analyze, such as **LED Only** |
| **Measures** | Multi-select measures within the scenario |
### Summary metrics
Five cards roll up results for the active scenario and view.
| Card | What it shows |
| ------------------------------ | ---------------------------------------------------- |
| **Projected Annual Reduction** | Total annual savings, such as **538,200 kWh** |
| **Percent Reduction** | Savings as a percent of baseline, such as **12.02%** |
| **Projected Payback Period** | Simple payback in years, such as **2.93** |
| **Total Capital Cost** | Sum of measure capital costs |
| **Total Incentives** | Sum of rebates and grants |
### Target chart
The **Target** chart compares long-range trajectories through **2040**.
| Series | Meaning |
| ------------------ | ----------------------------------------------------------- |
| **TTM Baseline** | Trailing-twelve-month baseline without measures |
| **Forecast TTM** | Projected use after measures take effect |
| **Target Final** | Long-term reduction goal, such as a **2040 Reduction Goal** |
| **Target Rolling** | Rolling path from baseline toward the final target |
Use the goal dropdown, such as **2040 Reduction Goal**, to align the chart with targets you set on [Portfolio targets](/products/energ/analytics/portfolio-targets) and review on the [Building Energy dashboard](/products/energ/analytics/building-dashboards-energy#target).
### Baseline vs. projected and measures timeline
Scroll below the Target chart for service-type breakdowns and a measure schedule.
### Page controls
| Control | Purpose |
| ------------------------------------------ | ------------------------------------------------------------ |
| **Consumption** / **Cost** / **Emissions** | Switch KPI cards and charts between usage, spend, and kgCO₂e |
| **Energy** | Filter by energy scope or commodity |
| **Scenario** | Select the scenario to analyze, such as **LED Only** |
| **Measures** | Multi-select measures within the scenario |
### Summary metrics
Five cards roll up results for the active scenario and view.
| Card | What it shows |
| ------------------------------ | ---------------------------------------------------- |
| **Projected Annual Reduction** | Total annual savings, such as **538,200 kWh** |
| **Percent Reduction** | Savings as a percent of baseline, such as **12.02%** |
| **Projected Payback Period** | Simple payback in years, such as **2.93** |
| **Total Capital Cost** | Sum of measure capital costs |
| **Total Incentives** | Sum of rebates and grants |
### Target chart
The **Target** chart compares long-range trajectories through **2040**.
| Series | Meaning |
| ------------------ | ----------------------------------------------------------- |
| **TTM Baseline** | Trailing-twelve-month baseline without measures |
| **Forecast TTM** | Projected use after measures take effect |
| **Target Final** | Long-term reduction goal, such as a **2040 Reduction Goal** |
| **Target Rolling** | Rolling path from baseline toward the final target |
Use the goal dropdown, such as **2040 Reduction Goal**, to align the chart with targets you set on [Portfolio targets](/products/energ/analytics/portfolio-targets) and review on the [Building Energy dashboard](/products/energ/analytics/building-dashboards-energy#target).
### Baseline vs. projected and measures timeline
Scroll below the Target chart for service-type breakdowns and a measure schedule.
 | Section | What it shows |
| -------------------------- | ------------------------------------------------------------------------------------- |
| **Baseline vs. Projected** | Grouped bars by service type comparing baseline to projected use |
| **Reduction** | Table with **Baseline**, **% of Baseline**, **Projected**, and **Reduction** per fuel |
| **Measures Timeline** | Gantt-style view of when each measure starts savings based on **Operation Date** |
**Scenario Analysis** shows trailing-twelve-month **Forecast TTM** and baseline separation for one scenario. Use it when you explain how savings emerge across seasons before you compare bundles on **Comparison**.
Set each measure **Implementation Date** when work begins and **Operation Date** when savings start. Staggered dates keep cash flows and contractor access realistic in one scenario.
| Section | What it shows |
| -------------------------- | ------------------------------------------------------------------------------------- |
| **Baseline vs. Projected** | Grouped bars by service type comparing baseline to projected use |
| **Reduction** | Table with **Baseline**, **% of Baseline**, **Projected**, and **Reduction** per fuel |
| **Measures Timeline** | Gantt-style view of when each measure starts savings based on **Operation Date** |
**Scenario Analysis** shows trailing-twelve-month **Forecast TTM** and baseline separation for one scenario. Use it when you explain how savings emerge across seasons before you compare bundles on **Comparison**.
Set each measure **Implementation Date** when work begins and **Operation Date** when savings start. Staggered dates keep cash flows and contractor access realistic in one scenario.
Scenario Comparison
Select **Comparison** in the Capital Planning menu to evaluate multiple scenarios side by side on one chart and table.
 ### Page controls
| Control | Purpose |
| ------------------------------------------ | ------------------------------------------------------------------------- |
| **Energy** | Scope or commodity filter for the roadmap |
| **Scenario tags** | Select two or more scenarios, such as **LED Only** and **Simple Upgrade** |
| **Target goal** | Long-range target overlay, such as **2040 Reduction Goal** |
| **Consumption** / **Cost** / **Emissions** | Switch the roadmap and table between usage, spend, and CO₂e |
### Capital Planning Roadmap
The **Capital Planning Roadmap** chart projects each selected scenario from the current year through **2040**.
| Series | Meaning |
| ----------------------------------------------------------------- | ----------------------------------------------------------------------------- |
| **Baseline** | Reference use without new measures |
| **Target** | Published reduction path toward the goal year |
| **LED Only TTM** / **Simple Upgrade TTM** / **Full retrofit TTM** | Trailing-twelve-month forecast per scenario (line color matches the scenario) |
Steeper drops indicate larger or earlier savings. Compare scenario lines to **Target** to see which bundle closes the gap soonest.
### Comparison table
The table below the chart summarizes each scenario for the active toggle.
| Column | What it shows |
| -------------------------------------- | ---------------------------------------------------------- |
| **Scenario Name** | Bundle label |
| **Total Annual Savings (Consumption)** | Annual energy reduction |
| **Total Annual Savings (Cost)** | Annual cost reduction |
| **Total Annual Savings (CO2e)** | Annual emissions reduction |
| **Capex** | Total capital cost |
| **Incentives** | Total rebates and grants |
| **Projected Annual Consumption** | Percent reduction or projected use metric for the scenario |
| **Simple Payback (Years)** | Payback period for the bundle |
Use the table to compare **Simple Payback** and **Capex** when you shortlist funding options. Open [Scenario Analysis](#scenario-analysis) for a single-scenario drill-down.
Compare at least one low-capex scenario and one deep-retrofit scenario so stakeholders see the tradeoff between payback speed and total savings.
For portfolio-wide comparison across buildings, use [Portfolio capital planning](/products/energ/analytics/portfolio-capital-planning).
## Next steps
Compare scenarios across buildings on the roadmap chart.
Add capital projects from planning into an annual budget in step 4.
Update area, heating, cooling, and service types before you lock a baseline.
### Page controls
| Control | Purpose |
| ------------------------------------------ | ------------------------------------------------------------------------- |
| **Energy** | Scope or commodity filter for the roadmap |
| **Scenario tags** | Select two or more scenarios, such as **LED Only** and **Simple Upgrade** |
| **Target goal** | Long-range target overlay, such as **2040 Reduction Goal** |
| **Consumption** / **Cost** / **Emissions** | Switch the roadmap and table between usage, spend, and CO₂e |
### Capital Planning Roadmap
The **Capital Planning Roadmap** chart projects each selected scenario from the current year through **2040**.
| Series | Meaning |
| ----------------------------------------------------------------- | ----------------------------------------------------------------------------- |
| **Baseline** | Reference use without new measures |
| **Target** | Published reduction path toward the goal year |
| **LED Only TTM** / **Simple Upgrade TTM** / **Full retrofit TTM** | Trailing-twelve-month forecast per scenario (line color matches the scenario) |
Steeper drops indicate larger or earlier savings. Compare scenario lines to **Target** to see which bundle closes the gap soonest.
### Comparison table
The table below the chart summarizes each scenario for the active toggle.
| Column | What it shows |
| -------------------------------------- | ---------------------------------------------------------- |
| **Scenario Name** | Bundle label |
| **Total Annual Savings (Consumption)** | Annual energy reduction |
| **Total Annual Savings (Cost)** | Annual cost reduction |
| **Total Annual Savings (CO2e)** | Annual emissions reduction |
| **Capex** | Total capital cost |
| **Incentives** | Total rebates and grants |
| **Projected Annual Consumption** | Percent reduction or projected use metric for the scenario |
| **Simple Payback (Years)** | Payback period for the bundle |
Use the table to compare **Simple Payback** and **Capex** when you shortlist funding options. Open [Scenario Analysis](#scenario-analysis) for a single-scenario drill-down.
Compare at least one low-capex scenario and one deep-retrofit scenario so stakeholders see the tradeoff between payback speed and total savings.
For portfolio-wide comparison across buildings, use [Portfolio capital planning](/products/energ/analytics/portfolio-capital-planning).
## Next steps
Compare scenarios across buildings on the roadmap chart.
Add capital projects from planning into an annual budget in step 4.
Update area, heating, cooling, and service types before you lock a baseline.