> ## Documentation Index
> Fetch the complete documentation index at: https://documentation.kodelabs.com/llms.txt
> Use this file to discover all available pages before exploring further.
# Utility cost analysis
> Review utility costs, download statements, and analyze spending for one building in EnerG
You analyze utility spending at the **building level** in EnerG with cost dashboards, original statements, and quality checks. For budget variance and charts, use [Building budget overview](/products/energ/finance/budget-overview). For portfolio-wide rollups, use [Portfolio budget and planning](/products/energ/analytics/portfolio-budgets).
## Navigate to cost views
Click `Dashboards`, then `Energy`, and toggle to **Cost** to see building-specific cost data in charts. To create annual budgets, use [Budget planning](/products/energ/finance/budget-planning) under **Budget** in the building sidebar.
## Use cost dashboards
Cost dashboards summarize utility spending by building, service type, and time period. Portfolio views show the whole estate. Building views focus on one site with the same filters you use elsewhere in EnerG.
## Download statements
You download original utility statements or invoices that your data sources collect. Navigate to the Arcadia data source (click `Data Sources` in the left sidebar, then click the `Utility Hub` card) and open the `Statements` tab to locate and download individual bills.
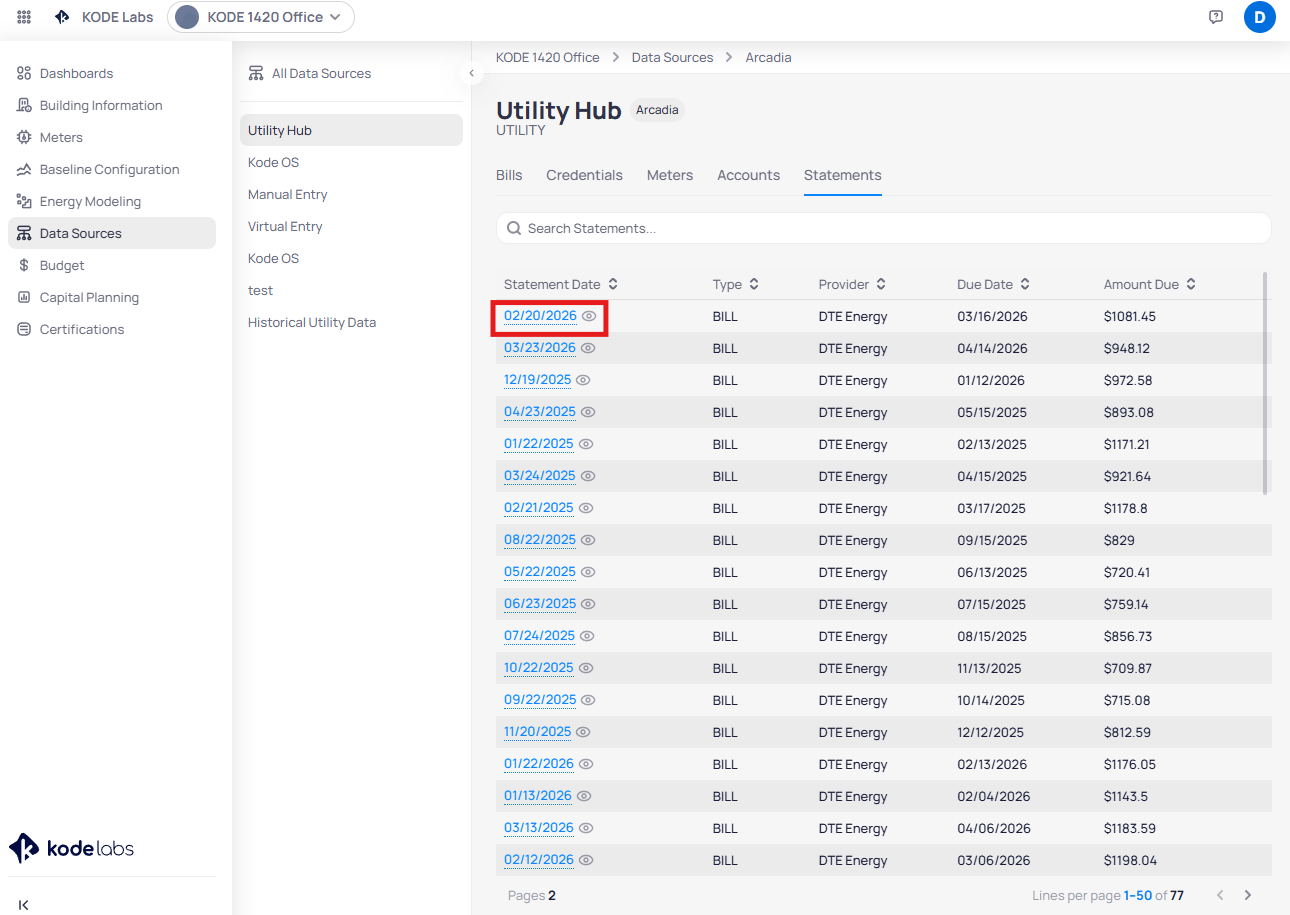 Use downloads when you audit a bill, share proof with finance, or reconcile EnerG cost lines to source documents.
Keep statement retrieval inside EnerG when your integration already stores files; you avoid hunting through separate vendor portals.
## Review data quality issues
Cost tracking breaks when bills are missing or usage and cost series disagree. Review data-quality signals beside cost charts to spot sudden spikes, flat lines that should vary, or gaps that hide true spend.
For deeper triage, use the [Data quality overview](/products/energ/data-quality/data-quality-overview) to inspect alerts and completeness scores.
## Toggle usage, cost, and emissions
Dashboards let you toggle between `Usage`, `Cost`, and `Emissions` perspectives, as shown below. You pick the measure that matches your audience.
Use downloads when you audit a bill, share proof with finance, or reconcile EnerG cost lines to source documents.
Keep statement retrieval inside EnerG when your integration already stores files; you avoid hunting through separate vendor portals.
## Review data quality issues
Cost tracking breaks when bills are missing or usage and cost series disagree. Review data-quality signals beside cost charts to spot sudden spikes, flat lines that should vary, or gaps that hide true spend.
For deeper triage, use the [Data quality overview](/products/energ/data-quality/data-quality-overview) to inspect alerts and completeness scores.
## Toggle usage, cost, and emissions
Dashboards let you toggle between `Usage`, `Cost`, and `Emissions` perspectives, as shown below. You pick the measure that matches your audience.
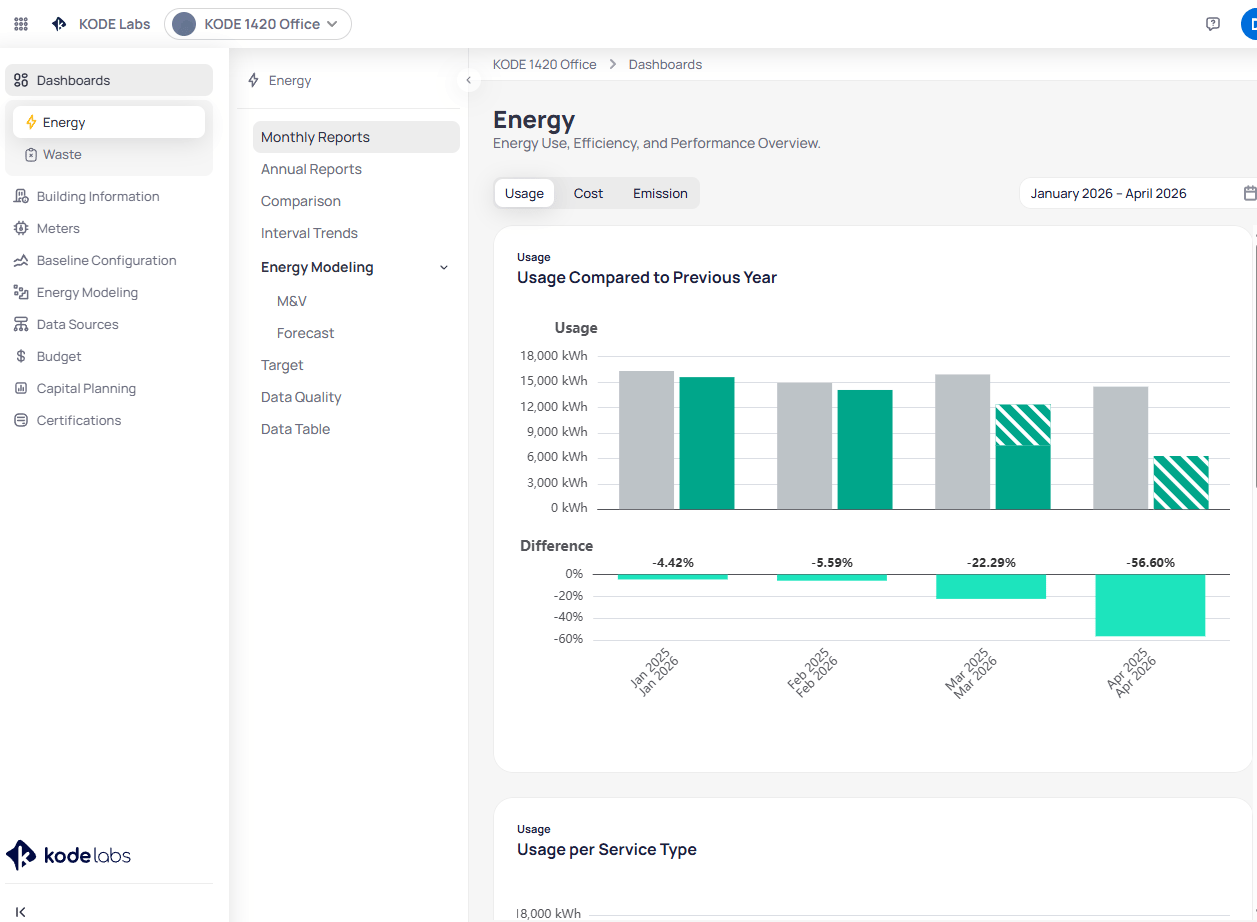 Finance stakeholders often start on cost. Sustainability reviews may lead with emissions while you keep cost one toggle away.
## Read portfolio and building breakdowns
At portfolio level, compare buildings and regions across consistent service types and periods. At building level, split cost by meter or account where your configuration allows. Combine breakdowns with benchmarks or targets when those modules are enabled for your workspace.
## Next steps
Compare actual spend to budget with charts and monthly variance tables.
Create annual budgets with the six-step Planning wizard.
Configure simpler manual or Smart Generation budget models.
Export configurable reports for historical consumption, cost, and emissions data.
See how EnerG monitors completeness, anomalies, and alerts across meters and bills.
Understand how utility data and documents flow into EnerG from connected sources.
Finance stakeholders often start on cost. Sustainability reviews may lead with emissions while you keep cost one toggle away.
## Read portfolio and building breakdowns
At portfolio level, compare buildings and regions across consistent service types and periods. At building level, split cost by meter or account where your configuration allows. Combine breakdowns with benchmarks or targets when those modules are enabled for your workspace.
## Next steps
Compare actual spend to budget with charts and monthly variance tables.
Create annual budgets with the six-step Planning wizard.
Configure simpler manual or Smart Generation budget models.
Export configurable reports for historical consumption, cost, and emissions data.
See how EnerG monitors completeness, anomalies, and alerts across meters and bills.
Understand how utility data and documents flow into EnerG from connected sources.