> ## Documentation Index
> Fetch the complete documentation index at: https://documentation.kodelabs.com/llms.txt
> Use this file to discover all available pages before exploring further.
# Building budget overview
> Track predicted, actual, and variance energy budget performance for one building in EnerG
**Building Budget Overview** compares planned spend to actual utility cost for one building in the [building view](/products/energ/get-started/navigation#budget-submenu). Expand **Budget** in the left sidebar and open **Overview**. Use this page after you configure monthly values in [Model configuration](/products/energ/finance/budgets). For how predicted, actual, and variance relate, see [Budgets and capital planning](/products/energ/concepts/budgets-and-capital-planning#predicted-actual-and-variance).
For portfolio rollups across sites, see [Portfolio budget and planning](/products/energ/analytics/portfolio-budgets).
## Open building budget overview
From [Portfolio Home](/products/energ/analytics/benchmarking), open a building in the building view.
In the left sidebar, expand **Budget**, then click **Overview**.
## Summary metrics
Three cards at the top roll up performance for the year you select.
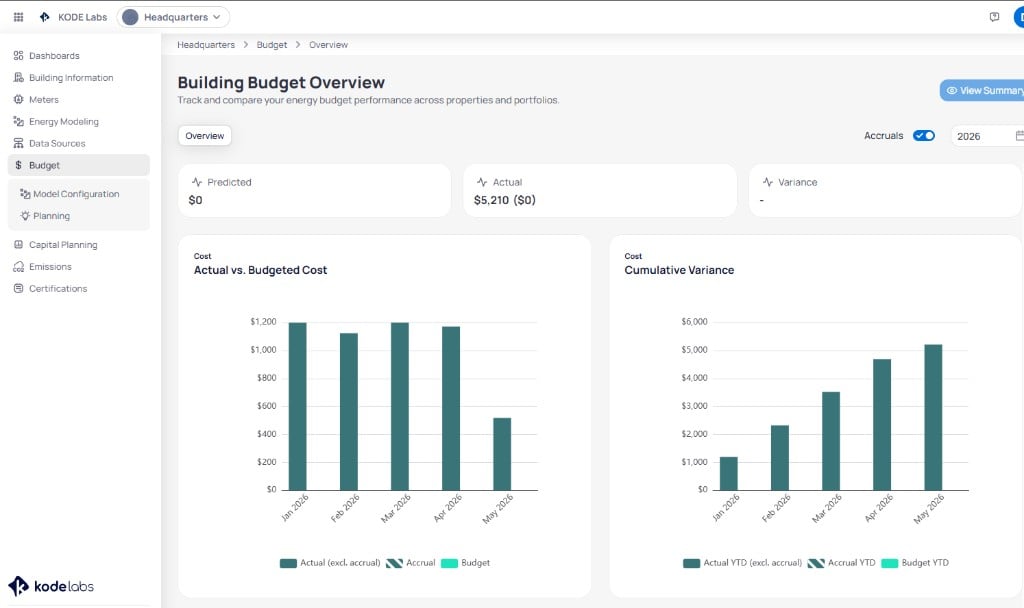 | Card | What it shows |
| ----------------------------------------------------------------------------------------------------------------- | ----------------------------------------------------------------------------------------- |
| **Predicted** | Estimated year-end spend based on current trends |
| **Actual** | Billed cost to date for the selected year. A secondary value can show accrued adjustments |
| **Variance** | Difference between budget and actual performance. Displays a dash when no budget is set |
When **Budget** columns are zero, configure monthly amounts in [Model configuration](/products/energ/finance/budgets) so variance and predicted values populate.
## Page controls
| Control | Purpose |
| ---------------- | ---------------------------------------------------------------------------------------------------------- |
| **View Summary** | Open a condensed summary of budget performance |
| **Accruals** | Include estimated cost for months without final bills in charts and totals |
| **Service type** | Toggle charts and totals by utility (electric, gas, and other configured types) or view the combined total |
| **Year** | Calendar year for KPI cards and charts |
| **Overview** | Tab that shows charts and the monthly table on this page |
| **Download** | Export budget data for the active filters, including all service types in one file when available |
Turn **Accruals** on for month-end reporting when some utilities have not posted final bills. Turn it off to compare billed amounts only.
## Charts
Two charts sit below the summary cards. Use the **service type** toggle to break down total budget versus actual and see which commodities drive increases or reductions.
### Actual vs. budgeted cost
A monthly bar chart compares spend to plan for each month in the selected year.
| Series | Meaning |
| -------------------------- | ------------------------------------------------- |
| **Actual (excl. accrual)** | Billed cost for the month |
| **Accrual** | Estimated cost for delivered but unbilled service |
| **Budget** | Planned cost from your configured model |
### Cumulative variance
A year-to-date chart stacks the same series cumulatively so you can see how variance builds across the year.
| Series | Meaning |
| ------------------------------ | ---------------------------------- |
| **Actual YTD (excl. accrual)** | Running total of billed cost |
| **Accrual YTD** | Running total of accrued estimates |
| **Budget YTD** | Running total of planned cost |
## Monthly and YTD table
Scroll below the charts for a tabular breakdown. Switch between **Monthly** and **YTD** to change how rows aggregate.
| Card | What it shows |
| ----------------------------------------------------------------------------------------------------------------- | ----------------------------------------------------------------------------------------- |
| **Predicted** | Estimated year-end spend based on current trends |
| **Actual** | Billed cost to date for the selected year. A secondary value can show accrued adjustments |
| **Variance** | Difference between budget and actual performance. Displays a dash when no budget is set |
When **Budget** columns are zero, configure monthly amounts in [Model configuration](/products/energ/finance/budgets) so variance and predicted values populate.
## Page controls
| Control | Purpose |
| ---------------- | ---------------------------------------------------------------------------------------------------------- |
| **View Summary** | Open a condensed summary of budget performance |
| **Accruals** | Include estimated cost for months without final bills in charts and totals |
| **Service type** | Toggle charts and totals by utility (electric, gas, and other configured types) or view the combined total |
| **Year** | Calendar year for KPI cards and charts |
| **Overview** | Tab that shows charts and the monthly table on this page |
| **Download** | Export budget data for the active filters, including all service types in one file when available |
Turn **Accruals** on for month-end reporting when some utilities have not posted final bills. Turn it off to compare billed amounts only.
## Charts
Two charts sit below the summary cards. Use the **service type** toggle to break down total budget versus actual and see which commodities drive increases or reductions.
### Actual vs. budgeted cost
A monthly bar chart compares spend to plan for each month in the selected year.
| Series | Meaning |
| -------------------------- | ------------------------------------------------- |
| **Actual (excl. accrual)** | Billed cost for the month |
| **Accrual** | Estimated cost for delivered but unbilled service |
| **Budget** | Planned cost from your configured model |
### Cumulative variance
A year-to-date chart stacks the same series cumulatively so you can see how variance builds across the year.
| Series | Meaning |
| ------------------------------ | ---------------------------------- |
| **Actual YTD (excl. accrual)** | Running total of billed cost |
| **Accrual YTD** | Running total of accrued estimates |
| **Budget YTD** | Running total of planned cost |
## Monthly and YTD table
Scroll below the charts for a tabular breakdown. Switch between **Monthly** and **YTD** to change how rows aggregate.
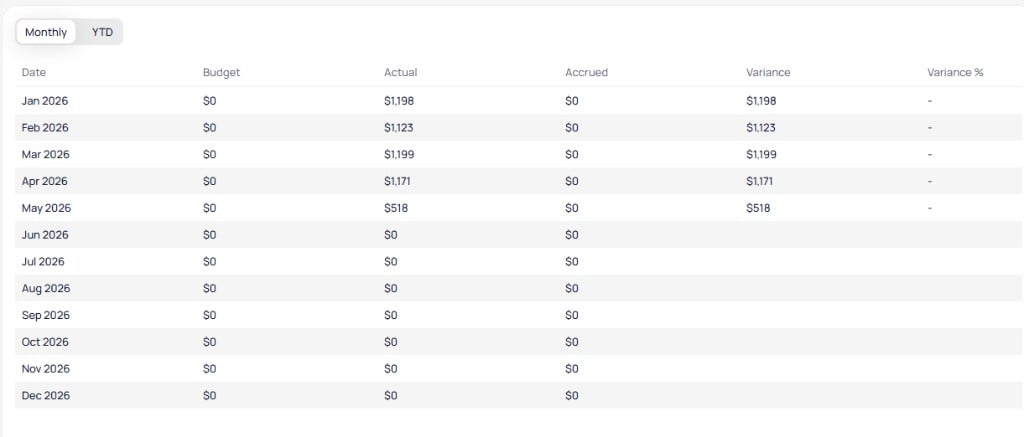 | Column | What it shows |
| -------------- | ---------------------------------------------------------------- |
| **Date** | Calendar month in the selected year |
| **Budget** | Planned cost for the month |
| **Actual** | Billed cost for the month |
| **Accrued** | Estimated cost included when **Accruals** is on |
| **Variance** | Difference between budget and actual plus accrued |
| **Variance %** | Variance as a percent of budget when budget is greater than zero |
## Accruals
On **Overview**, enable **Accruals** to include estimates for unbilled months in **Actual** totals, chart series, and variance. Disable **Accruals** when you need a billed-only view for audits or close processes. For how EnerG builds and trues up accruals, see [Accruals](/products/energ/concepts/budgets-and-capital-planning#accruals) and the [accrual behavior reference](/products/energ/reference/calculations-and-parameters#accruals).
Accrual behavior may vary by deployment. Confirm labels and calculations in your workspace before you publish variance reports.
## Next steps
Create or edit monthly budget values with Manual Flow or Smart Generation.
Create and manage annual budgets with the six-step wizard.
Compare this building to portfolio budget rollups.
Analyze usage and cost trends alongside budget performance.
| Column | What it shows |
| -------------- | ---------------------------------------------------------------- |
| **Date** | Calendar month in the selected year |
| **Budget** | Planned cost for the month |
| **Actual** | Billed cost for the month |
| **Accrued** | Estimated cost included when **Accruals** is on |
| **Variance** | Difference between budget and actual plus accrued |
| **Variance %** | Variance as a percent of budget when budget is greater than zero |
## Accruals
On **Overview**, enable **Accruals** to include estimates for unbilled months in **Actual** totals, chart series, and variance. Disable **Accruals** when you need a billed-only view for audits or close processes. For how EnerG builds and trues up accruals, see [Accruals](/products/energ/concepts/budgets-and-capital-planning#accruals) and the [accrual behavior reference](/products/energ/reference/calculations-and-parameters#accruals).
Accrual behavior may vary by deployment. Confirm labels and calculations in your workspace before you publish variance reports.
## Next steps
Create or edit monthly budget values with Manual Flow or Smart Generation.
Create and manage annual budgets with the six-step wizard.
Compare this building to portfolio budget rollups.
Analyze usage and cost trends alongside budget performance.