> ## Documentation Index
> Fetch the complete documentation index at: https://documentation.kodelabs.com/llms.txt
> Use this file to discover all available pages before exploring further.
# Data completeness
> Review meter timelines and upload missing bills to close data completeness gaps in EnerG
Fix meter coverage gaps in EnerG before they skew analytics or benchmarking. This page walks you through reviewing a meter timeline and uploading the bills that raise its data completeness score.
To learn how EnerG scores coverage and why gaps and overlaps lower it, see the [data completeness concept](/products/energ/concepts/data-completeness).
## Where you see completeness
You view completeness in several places throughout EnerG.
* **KPI card on the Home page**: The **Data Completeness** card shows the portfolio-wide percentage on the [Portfolio Home](/products/energ/analytics/benchmarking) page.
* **Building detail panel**: Each building's detail panel on **Home** shows a completeness score and trend chart.
* **Data Quality report**: Open **Data Quality** from the [Building Energy dashboard](/products/energ/analytics/building-dashboards-energy#data-quality) report menu for meter-by-meter coverage at the building level.
* **Portfolio meters**: [Portfolio meters](/products/energ/analytics/portfolio-meters) lists monthly completeness percentages by account and meter.
Review gaps on a meter
Open [Building meters](/products/energ/buildings/meters), select a meter, then open the **Data Quality** tab. The **Bills Data Quality** chart shows how each day in the date range is classified.
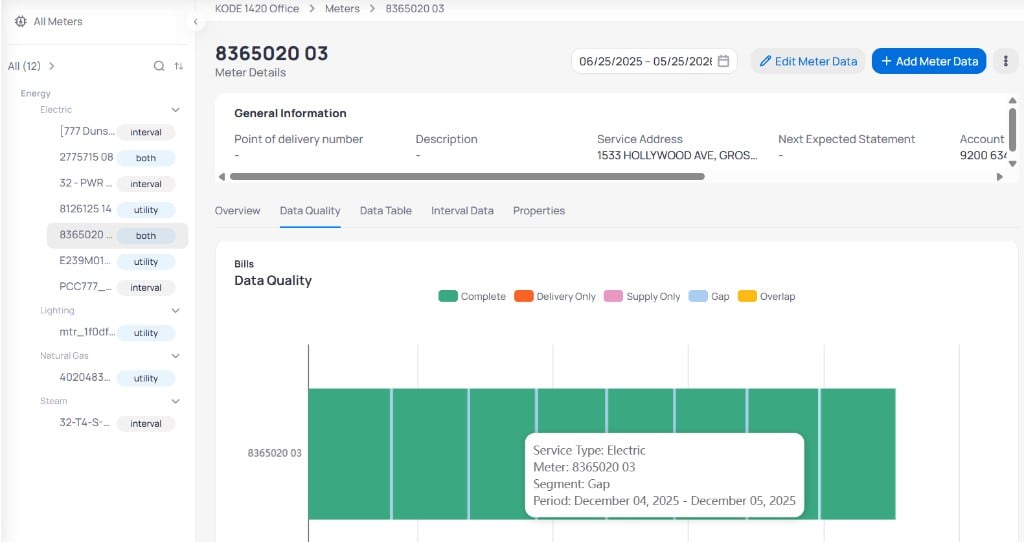 Each segment is colored by coverage: a gap shows light blue and an overlap shows yellow. For the full color legend, see [Data quality legend](/products/energ/reference/data-and-meter-fields#data-quality-legend).
Hover a segment to read **Service Type**, **Meter**, **Segment**, and **Period** in the tooltip.
Scroll below the chart for a table that alternates **Complete** rows (with **BILL** links and usage) and **Gap** rows (zero usage and no statement).
Each segment is colored by coverage: a gap shows light blue and an overlap shows yellow. For the full color legend, see [Data quality legend](/products/energ/reference/data-and-meter-fields#data-quality-legend).
Hover a segment to read **Service Type**, **Meter**, **Segment**, and **Period** in the tooltip.
Scroll below the chart for a table that alternates **Complete** rows (with **BILL** links and usage) and **Gap** rows (zero usage and no statement).
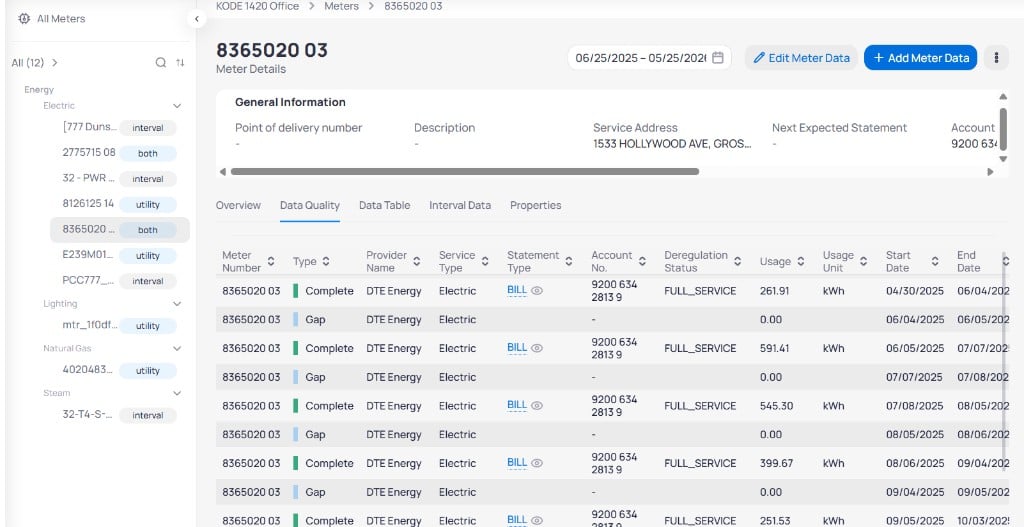 A **Gap** row between two **Complete** periods usually means EnerG expected a bill for those dates but none arrived. See [Building meters — Data Quality tab](/products/energ/buildings/meters#data-quality-tab) for column definitions and bill PDF links.
## Why gaps matter
Buildings below your completeness threshold drop out of benchmarking until coverage recovers. For why this rule protects rankings, see [Why completeness gates benchmarking](/products/energ/concepts/data-completeness#why-completeness-gates-benchmarking).
A **Gap** row between two **Complete** periods usually means EnerG expected a bill for those dates but none arrived. See [Building meters — Data Quality tab](/products/energ/buildings/meters#data-quality-tab) for column definitions and bill PDF links.
## Why gaps matter
Buildings below your completeness threshold drop out of benchmarking until coverage recovers. For why this rule protects rankings, see [Why completeness gates benchmarking](/products/energ/concepts/data-completeness#why-completeness-gates-benchmarking).
Investigate and fix gaps
Open [Portfolio Home](/products/energ/analytics/benchmarking) and check the **Data Completeness** KPI card. Click a building with a low score to review its detail panel.
Go to [Building meters](/products/energ/buildings/meters), select the meter, and open **Data Quality**. Use the date range picker in the header to match the gap period. Confirm **Gap** segments on the chart and **Gap** rows in the table.
Match what you see to one of the causes below. Each cause points to the workflow that fixes it.
When the gap is missing billing data, follow [Add new billing data](/products/energ/buildings/meters#add-new-billing-data) on the same meter detail page. Click **+ Add Meter Data**, enter usage and dates, and upload the bill PDF in **Upload Files** when you have it.
For many gaps at once, use **Bulk Import** from the three-dot menu next to **+ Add Meter Data**. See [Bulk import meter data](/products/energ/buildings/meters#bulk-import-meter-data) for the Excel template workflow.
Return to the **Data Quality** tab after data syncs. **Gap** segments should turn **Complete**, and the building completeness score should rise on **Home**.
Revisit completeness on [Portfolio meters](/products/energ/analytics/portfolio-meters) or the building **Data Quality** report when you finish.
### Common gap causes
**What you see:** Light blue **Gap** segments on the timeline and **Gap** rows with **0.00** usage in the table.
**What to do:** Upload or enter the missing period on [Building meters — Add new billing data](/products/energ/buildings/meters#add-new-billing-data). If the provider should have sent the bill automatically, check [Arcadia](/products/energ/data-sources/arcadia) **Statements** or [Alert center](/products/energ/data-quality/alert-center) for ingestion errors first.
**What you see:** Gaps across many meters that share one utility account, often with no new **BILL** rows for weeks.
**What to do:** Open [Arcadia](/products/energ/data-sources/arcadia) at the portfolio or building level, review **Credentials** status, and re-authenticate or refresh the connection. After statements flow again, gaps close without manual entry when ingestion succeeds.
**What you see:** Long **Gap** bars at the start or end of the timeline, or **Complete** periods that do not match when the meter was actually active.
**What to do:** Open the **Properties** tab on [Building meters](/products/energ/buildings/meters#properties-tab) and correct **Date Became Active** and **Date Became Inactive**. EnerG recalculates expected days in the completeness window after you save.
**What you see:** Low building completeness while the meter list looks healthy, or bills exist in the portfolio but not on this building's **Meters** page.
**What to do:** Assign meters from [Arcadia](/products/energ/data-sources/arcadia), [CSV uploads](/products/energ/data-sources/csv-uploads), [Manual entry](/products/energ/data-sources/manual-entry), or [KODE OS](/products/energ/data-sources/kode-os-data-source) using **Assign Meters** on each data source page. See [Building data sources](/products/energ/buildings/data-sources).
## Next steps
Upload bills and fill gaps with **+ Add Meter Data**.
Return to the data quality hub for alerts and meter comparisons.
Triage billing issues with priorities, statuses, and resolution actions.
Review meter coverage for every commodity on one building.