> ## Documentation Index
> Fetch the complete documentation index at: https://documentation.kodelabs.com/llms.txt
> Use this file to discover all available pages before exploring further.
# Data sources and meters
> How utility bills, interval reads, and meters feed EnerG analytics, and why calendarization matters
EnerG runs on two data streams: monthly utility bills and high-frequency interval reads. This page explains how those streams enter the product, how meters organize them, and why EnerG calendarizes bills before it compares periods.
For the steps to connect a feed, see the connector how-tos: [Arcadia](/products/energ/data-sources/arcadia), [CSV uploads](/products/energ/data-sources/csv-uploads), [Manual entry](/products/energ/data-sources/manual-entry), and the [KODE OS data source](/products/energ/data-sources/kode-os-data-source).
## EnerG and KODE OS
Use EnerG for utility bills, bill-led reporting, compliance, and sustainability planning. Use KODE OS for submeters, interval data, and operational insight. Many portfolios need both.
Bills and interval reads stay separate. Site meters and equipment trends do not replace utility bills for portfolio EUI, cost rollups, or accruals.
## Two data streams
Most EnerG dashboards, rankings, and accruals run on **utility billing data**: the monthly statements your electric, gas, and water providers issue. Automated connections retrieve those bills on a schedule.
EnerG imports interval meters when you need granular charts, forecasting, or Option B M\&V. Interval reads are normalized before analytics use them. See [Interval data normalization](/products/energ/concepts/interval-data-normalization).
| Data type | Typical source | Primary use in EnerG |
| --------------- | -------------------------- | ------------------------------------------------------------------------------------------------------------------- |
| Utility bills | Arcadia, CSV, manual entry | Portfolio Home, dashboards, targets, budgets, alert center |
| Interval meters | KODE OS data source | [Interval Trends](/products/energ/analytics/building-dashboards-energy#interval-trends), forecasting, Option B M\&V |
| Waste tickets | Manual or bulk upload | Waste dashboards and diversion metrics |
## Data sources
A **data source** is any path that brings utility or meter data into EnerG. You manage sources once per portfolio and reuse them across buildings.
| Method | Purpose |
| ----------------------------------------------------------------------- | ------------------------------------------------------- |
| [Arcadia](/products/energ/data-sources/arcadia) | Automated utility data via credential-based connections |
| [CSV uploads](/products/energ/data-sources/csv-uploads) | Load historical totals from spreadsheets |
| [Manual entry](/products/energ/data-sources/manual-entry) | Create meters and enter readings manually |
| [KODE OS data source](/products/energ/data-sources/kode-os-data-source) | Interval meters for analytics and M\&V |
See the full comparison on [Portfolio data sources](/products/energ/analytics/portfolio-data-sources).
## Accounts, meters, and statements
Utility data lands in three related layers.
* **Meters** measure usage at physical or virtual service points.
* **Accounts** group one or more meters under a single payer.
* **Statements** (bills) summarize meter-level usage, billing periods, rates, and total costs for an account.
In practice: meters roll up to accounts, and accounts produce statements.
Example: a mixed-use building may have five electric meters. Three suite meters bill to individual accounts. Two common-area meters share one owner account. Each account receives its own monthly statement.
When you connect a utility account, EnerG can capture all meters in that login. Statements may arrive per meter or combined, depending on the provider.
## Service types and commodity groups
**Service types** describe what flows through a meter. EnerG groups them into three **commodity groups** for portfolio reporting.
| Group | Includes |
| ------ | ------------------------------------------------------- |
| Energy | Electric plus fuels such as natural gas, steam, and oil |
| Water | Potable and irrigation water |
| Waste | Waste streams tracked by disposal method |
Fuels convert to a common energy unit before EnerG rolls them into portfolio energy totals and EUI. For the full service-type list, see [Data and meter fields](/products/energ/reference/data-and-meter-fields#service-types).
## Meters
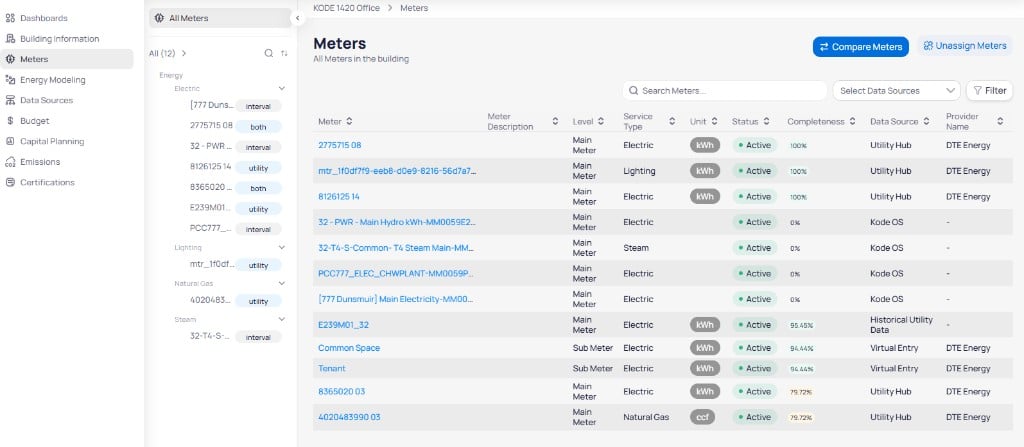
A **meter** is the utility-assigned or platform-tracked measurement point that records resource usage for a service location. Each meter has service start and end dates that control which bills count toward a building.
Meters differ by scope and by feed.
| Distinction | Values | Meaning |
| ----------- | ----------------------- | --------------------------------------------------------- |
| Scope | Main meter, submeter | Whole-site boundary versus a load below it |
| Feed | Utility, interval, both | Monthly bills, high-frequency reads, or both on one meter |
**Utility bill meters** settle on monthly billing periods. **Interval meters** record usage every hour or every 15 minutes for load shapes, forecasting, and M\&V.
 For field definitions such as meter status, level, and data origin, see [Data and meter fields](/products/energ/reference/data-and-meter-fields). To manage meters, see [Building meters](/products/energ/buildings/meters) and [Portfolio meters](/products/energ/analytics/portfolio-meters).
## Calendarization
**Calendarization** spreads each billing period across calendar months using average daily consumption. It normalizes irregular bill windows so January always means January.
A bill that runs January 13 to February 11 splits its usage across both months by daily rate. EnerG then reports a clean January value and a clean February value.
For field definitions such as meter status, level, and data origin, see [Data and meter fields](/products/energ/reference/data-and-meter-fields). To manage meters, see [Building meters](/products/energ/buildings/meters) and [Portfolio meters](/products/energ/analytics/portfolio-meters).
## Calendarization
**Calendarization** spreads each billing period across calendar months using average daily consumption. It normalizes irregular bill windows so January always means January.
A bill that runs January 13 to February 11 splits its usage across both months by daily rate. EnerG then reports a clean January value and a clean February value.
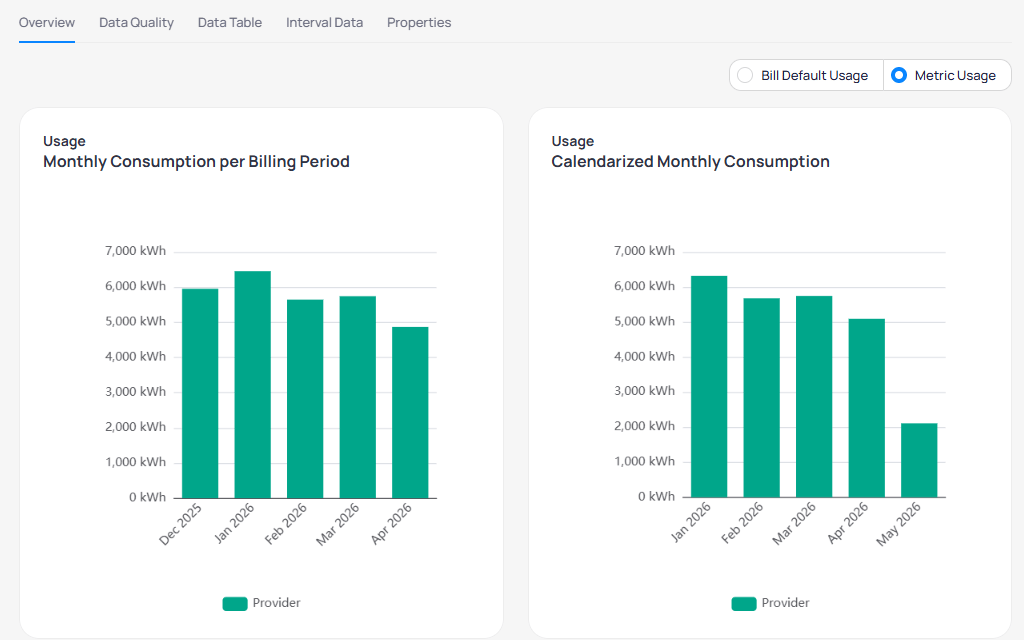 You rely on calendarization for year-over-year comparisons, accounting closes, and any dashboard that must align to calendar months.
## How data flows
Portfolio settings and data sources shape what each building can use. Building-level meter work rolls up to portfolio dashboards, rankings, and alerts.
```mermaid actions={false} theme={"theme":{"light":"github-dark","dark":"github-dark"}}
---
config:
layout: dagre
theme: neutral
---
flowchart LR
A["Utility provider"] -->|"bills"| B["Data source"]
K["KODE OS points"] -->|"interval reads"| B
B --> M["Meters"]
M --> C["Calendarization"]
C --> D["Dashboards, rankings, budgets"]
M --> I["Interval Trends, M&V, forecasting"]
```
## Next steps
See how EnerG scores billed coverage and why gaps drop a building from benchmarking.
See how irregular interval reads become clean 15-minute values.
Look up service types, units, meter states, and column definitions.
Connect Arcadia, uploads, manual entry, and interval feeds.
You rely on calendarization for year-over-year comparisons, accounting closes, and any dashboard that must align to calendar months.
## How data flows
Portfolio settings and data sources shape what each building can use. Building-level meter work rolls up to portfolio dashboards, rankings, and alerts.
```mermaid actions={false} theme={"theme":{"light":"github-dark","dark":"github-dark"}}
---
config:
layout: dagre
theme: neutral
---
flowchart LR
A["Utility provider"] -->|"bills"| B["Data source"]
K["KODE OS points"] -->|"interval reads"| B
B --> M["Meters"]
M --> C["Calendarization"]
C --> D["Dashboards, rankings, budgets"]
M --> I["Interval Trends, M&V, forecasting"]
```
## Next steps
See how EnerG scores billed coverage and why gaps drop a building from benchmarking.
See how irregular interval reads become clean 15-minute values.
Look up service types, units, meter states, and column definitions.
Connect Arcadia, uploads, manual entry, and interval feeds.