> ## Documentation Index
> Fetch the complete documentation index at: https://documentation.kodelabs.com/llms.txt
> Use this file to discover all available pages before exploring further.
# Portfolio emissions overview
> Monitor portfolio GHG emissions, offsets, and renewable contracts in EnerG
Monitor greenhouse gas emissions across your portfolio in the [portfolio view](/products/energ/get-started/navigation#portfolio-view). Expand `Emissions` in the left sidebar and open `Overview` to review scope totals, offsets, and renewable contracts. For the accounting model behind these numbers, see [Emissions accounting](/products/energ/concepts/emissions-accounting).
At the building level, open [Emissions](/products/energ/buildings/emissions-overview) after you select a site. Use the portfolio **Emissions** group for benchmarking, emission factors, contracts, fleet, and fugitive tools.
## Navigate to Emissions Overview
Click `Emissions` in the portfolio left sidebar, then select `Overview`.
 ### Filter the portfolio
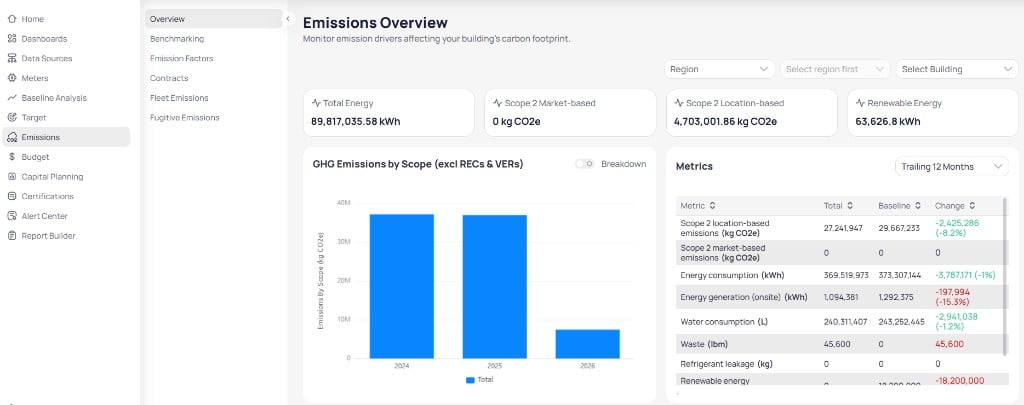
Use **Region** and **Select Building** filters at the top right to narrow charts and tables. Values in summary cards, charts, and scope tables update for the scope you select.
### Summary cards
Four cards roll up key drivers at the top of the page. The two Scope 2 cards separate the two accounting methods described in [location- and market-based Scope 2](/products/energ/concepts/emissions-accounting#location-based-and-market-based-scope-2).
| Card | What it shows |
| -------------------------- | -------------------------------------------------- |
| **Total Energy** | Portfolio energy consumption for the active filter |
| **Scope 2 Market-based** | Market-based Scope 2 emissions in kg CO₂e |
| **Scope 2 Location-based** | Location-based Scope 2 emissions in kg CO₂e |
| **Renewable Energy** | Renewable energy attributed to the portfolio |
## GHG emissions by scope
The **GHG Emissions by Scope (excl RECs & VERs)** chart shows total emissions by year. Turn **Breakdown** on to split bars by scope when your deployment supports it.
The vertical axis measures emissions in **kg CO₂e**. The horizontal axis lists calendar years in your reporting window.
## Metrics table
The **Metrics** table compares totals to a baseline for the period you select in the dropdown (for example, **Trailing 12 Months**).
| Column | Description |
| ------------ | ---------------------------------------------------------------------------------------------------------- |
| **Metric** | Emissions or activity measure name |
| **Total** | Value for the selected period |
| **Baseline** | Reference value for comparison |
| **Change** | Absolute and percentage change. Green indicates improvement; red indicates movement away from the baseline |
Common rows include **Scope 2 location-based emissions**, **Scope 2 market-based emissions**, **Energy consumption**, **Energy generation (onsite)**, **Water consumption**, **Waste**, and **Renewable energy**.
Use the download control to export the full emissions table to an Excel (`.xlsx`) file. The export uses the same filters and period active on the page.
## Emissions offset and renewable contracts
Below the overview charts, review how offsets and renewable energy contracts affect net emissions.
### Filter the portfolio
Use **Region** and **Select Building** filters at the top right to narrow charts and tables. Values in summary cards, charts, and scope tables update for the scope you select.
### Summary cards
Four cards roll up key drivers at the top of the page. The two Scope 2 cards separate the two accounting methods described in [location- and market-based Scope 2](/products/energ/concepts/emissions-accounting#location-based-and-market-based-scope-2).
| Card | What it shows |
| -------------------------- | -------------------------------------------------- |
| **Total Energy** | Portfolio energy consumption for the active filter |
| **Scope 2 Market-based** | Market-based Scope 2 emissions in kg CO₂e |
| **Scope 2 Location-based** | Location-based Scope 2 emissions in kg CO₂e |
| **Renewable Energy** | Renewable energy attributed to the portfolio |
## GHG emissions by scope
The **GHG Emissions by Scope (excl RECs & VERs)** chart shows total emissions by year. Turn **Breakdown** on to split bars by scope when your deployment supports it.
The vertical axis measures emissions in **kg CO₂e**. The horizontal axis lists calendar years in your reporting window.
## Metrics table
The **Metrics** table compares totals to a baseline for the period you select in the dropdown (for example, **Trailing 12 Months**).
| Column | Description |
| ------------ | ---------------------------------------------------------------------------------------------------------- |
| **Metric** | Emissions or activity measure name |
| **Total** | Value for the selected period |
| **Baseline** | Reference value for comparison |
| **Change** | Absolute and percentage change. Green indicates improvement; red indicates movement away from the baseline |
Common rows include **Scope 2 location-based emissions**, **Scope 2 market-based emissions**, **Energy consumption**, **Energy generation (onsite)**, **Water consumption**, **Waste**, and **Renewable energy**.
Use the download control to export the full emissions table to an Excel (`.xlsx`) file. The export uses the same filters and period active on the page.
## Emissions offset and renewable contracts
Below the overview charts, review how offsets and renewable energy contracts affect net emissions.
 ### Emissions offset breakdown
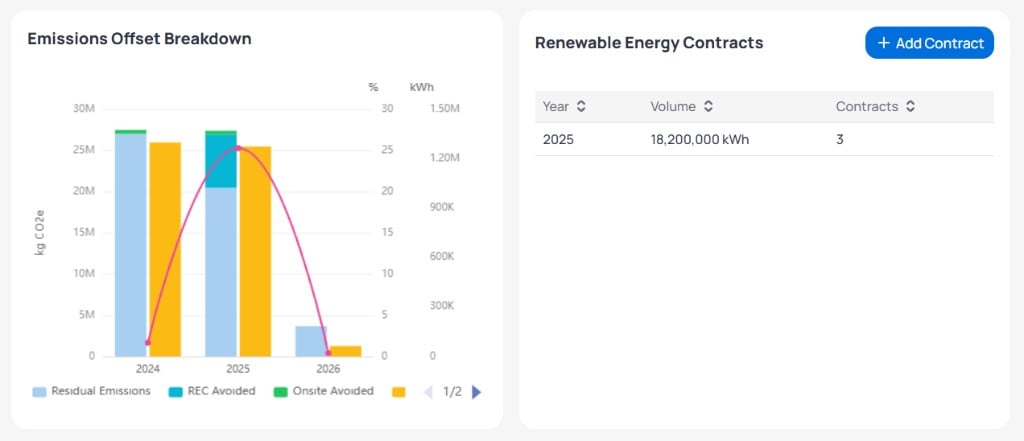
The **Emissions Offset Breakdown** chart shows residual emissions, REC avoided, and onsite avoided reductions by year. For definitions of these offset categories, see [RECs and offsets](/products/energ/concepts/emissions-accounting#recs-and-offsets). Use pagination controls when the chart has more than one view.
### Renewable energy contracts
The **Renewable Energy Contracts** table lists contract volume by year.
| Column | Description |
| ------------- | ---------------------------------------------------- |
| **Year** | Contract year |
| **Volume** | Total contracted renewable volume (for example, kWh) |
| **Contracts** | Number of contracts in that year |
Click `+ Add Contract` to record a new renewable energy certificate (REC) or volume contract. For full contract libraries, volume allocation, and retirement status, open [Volume contracts](/products/energ/analytics/portfolio-emissions-contracts).
## Scope breakdown
The **Scope Breakdown** section includes wide tables for **Annual Emissions (kg CO₂e)** and **Annual Consumptions**. Scroll horizontally to view all scope and service-type columns. Column headers support sorting.
### Emissions offset breakdown
The **Emissions Offset Breakdown** chart shows residual emissions, REC avoided, and onsite avoided reductions by year. For definitions of these offset categories, see [RECs and offsets](/products/energ/concepts/emissions-accounting#recs-and-offsets). Use pagination controls when the chart has more than one view.
### Renewable energy contracts
The **Renewable Energy Contracts** table lists contract volume by year.
| Column | Description |
| ------------- | ---------------------------------------------------- |
| **Year** | Contract year |
| **Volume** | Total contracted renewable volume (for example, kWh) |
| **Contracts** | Number of contracts in that year |
Click `+ Add Contract` to record a new renewable energy certificate (REC) or volume contract. For full contract libraries, volume allocation, and retirement status, open [Volume contracts](/products/energ/analytics/portfolio-emissions-contracts).
## Scope breakdown
The **Scope Breakdown** section includes wide tables for **Annual Emissions (kg CO₂e)** and **Annual Consumptions**. Scroll horizontally to view all scope and service-type columns. Column headers support sorting.
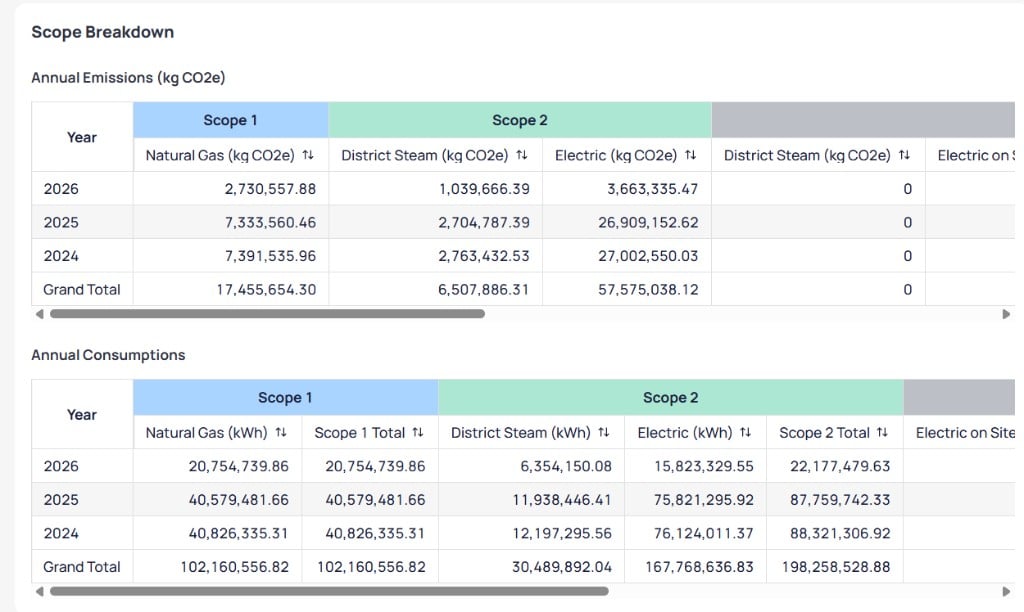 For the column groups in these tables, including Scope 1, Scope 2, Additional Services, and REC columns, see [scope breakdown columns](/products/energ/reference/emissions-reference#scope-columns).
Compare **Total Location Based** and **Total Market Based** in **Annual Emissions** when you report both GHG accounting methods.
## Next steps
Understand scopes, methods, RECs, and factors.
Look up scope column groups and record fields.
Compare Scope 1 and Scope 2 emissions by building.
Manage emission factors used in carbon calculations.
Manage REC and volume-based emission contracts.
Manage vehicles and mileage for Scope 1 mobile combustion.
Track refrigerant loss for Scope 1 fugitive reporting.
Build custom report layouts beyond the on-page emissions table export.
For the column groups in these tables, including Scope 1, Scope 2, Additional Services, and REC columns, see [scope breakdown columns](/products/energ/reference/emissions-reference#scope-columns).
Compare **Total Location Based** and **Total Market Based** in **Annual Emissions** when you report both GHG accounting methods.
## Next steps
Understand scopes, methods, RECs, and factors.
Look up scope column groups and record fields.
Compare Scope 1 and Scope 2 emissions by building.
Manage emission factors used in carbon calculations.
Manage REC and volume-based emission contracts.
Manage vehicles and mileage for Scope 1 mobile combustion.
Track refrigerant loss for Scope 1 fugitive reporting.
Build custom report layouts beyond the on-page emissions table export.