> ## Documentation Index
> Fetch the complete documentation index at: https://documentation.kodelabs.com/llms.txt
> Use this file to discover all available pages before exploring further.
# Building Waste dashboard
> Review building-level waste quantities, costs, diversion rate, and composition charts in EnerG
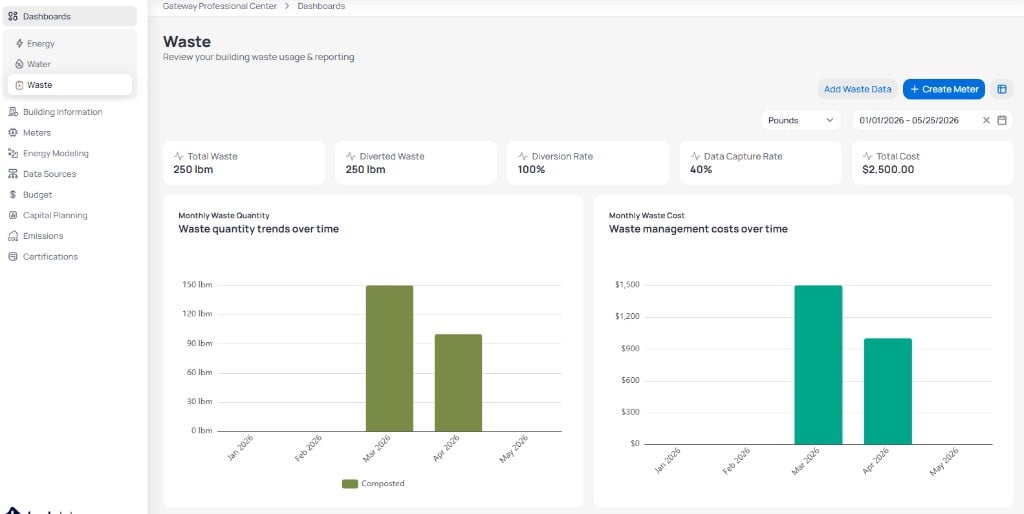
The building **Waste** dashboard shows how one site performs on waste quantity, cost, and diversion. In the [building view](/products/energ/get-started/navigation#building-view), open `Dashboards` in the left sidebar, then select `Waste`. The page header reads **Waste** with the subtitle *Review your building waste usage & reporting.*
Unlike Energy and Water, the Waste dashboard uses a single view without a secondary report menu.
 Building Waste reports apply to the site you selected in the top bar. Portfolio rollups live on the [Portfolio Waste dashboard](/products/energ/analytics/portfolio-dashboards-waste).
## Controls
| Control | Purpose |
| ------------------ | ------------------------------------------------------------------------------ |
| **Add Waste Data** | Open the form to record a pickup against an existing waste stream |
| **Create Meter** | Define a new waste stream with disposal method, waste type, unit, and currency |
| **Unit** | Display quantities in **Pounds**, kilograms, or other supported units |
| **Date range** | Set the period for KPIs and charts (for example, `01/01/2026 – 05/25/2026`) |
Waste data is usually entered manually because automated hauler feeds are uncommon. Use **Create Meter** to define streams, then **Add Waste Data** for each pickup.
## Summary metrics
Five KPI cards appear below the header.
| Metric | What it shows |
| ---------------------------------------------------------------------------------------------------------------- | ------------------------------------------------------------------------------------------- |
| **Total Waste** | Combined waste quantity for the selected period, such as **250 lbm** |
| **Diverted Waste** | Quantity routed away from landfill |
| Diversion Rate | Percentage of total waste diverted, such as **100%** when all reported material is diverted |
| Data Capture Rate | How completely waste streams are reported relative to expectations |
| **Total Cost** | Waste management spend for the period |
## Monthly waste charts
### Monthly Waste Quantity
The **Monthly Waste Quantity** chart stacks or groups waste by disposal method each month.
* **Composted** — material sent to composting (typically shown in green)
* **Disposed** — material sent to landfill or disposal (typically shown in brown when present)
Use this chart to see whether diversion improves month over month.
### Monthly Waste Cost
The **Monthly Waste Cost** chart shows total waste management spend by month. Compare it with quantity trends to spot cost-per-unit changes.
## Diversion and composition
Scroll below the monthly charts for diversion performance and composition breakdowns.
Building Waste reports apply to the site you selected in the top bar. Portfolio rollups live on the [Portfolio Waste dashboard](/products/energ/analytics/portfolio-dashboards-waste).
## Controls
| Control | Purpose |
| ------------------ | ------------------------------------------------------------------------------ |
| **Add Waste Data** | Open the form to record a pickup against an existing waste stream |
| **Create Meter** | Define a new waste stream with disposal method, waste type, unit, and currency |
| **Unit** | Display quantities in **Pounds**, kilograms, or other supported units |
| **Date range** | Set the period for KPIs and charts (for example, `01/01/2026 – 05/25/2026`) |
Waste data is usually entered manually because automated hauler feeds are uncommon. Use **Create Meter** to define streams, then **Add Waste Data** for each pickup.
## Summary metrics
Five KPI cards appear below the header.
| Metric | What it shows |
| ---------------------------------------------------------------------------------------------------------------- | ------------------------------------------------------------------------------------------- |
| **Total Waste** | Combined waste quantity for the selected period, such as **250 lbm** |
| **Diverted Waste** | Quantity routed away from landfill |
| Diversion Rate | Percentage of total waste diverted, such as **100%** when all reported material is diverted |
| Data Capture Rate | How completely waste streams are reported relative to expectations |
| **Total Cost** | Waste management spend for the period |
## Monthly waste charts
### Monthly Waste Quantity
The **Monthly Waste Quantity** chart stacks or groups waste by disposal method each month.
* **Composted** — material sent to composting (typically shown in green)
* **Disposed** — material sent to landfill or disposal (typically shown in brown when present)
Use this chart to see whether diversion improves month over month.
### Monthly Waste Cost
The **Monthly Waste Cost** chart shows total waste management spend by month. Compare it with quantity trends to spot cost-per-unit changes.
## Diversion and composition
Scroll below the monthly charts for diversion performance and composition breakdowns.
 ### Diversion and Data Capture Rate
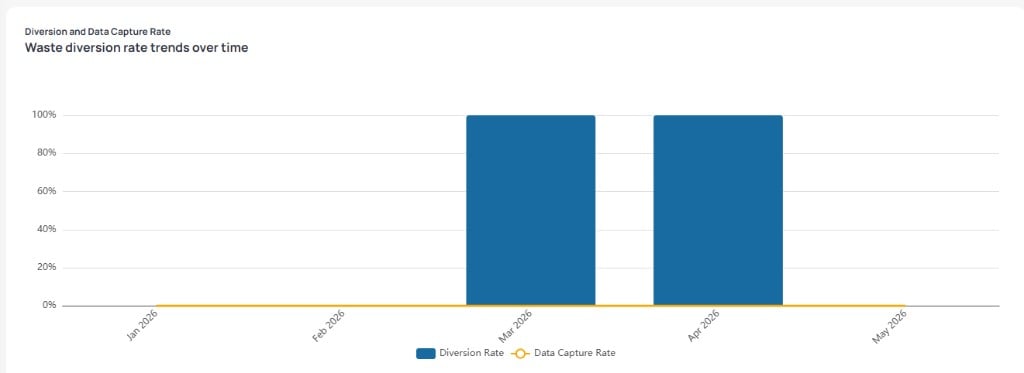
**Diversion Rate** bars show the share of waste diverted each month. **Data Capture Rate** (yellow line) shows reporting completeness over the same period. A high diversion rate with a low capture rate can mean incomplete stream coverage rather than strong diversion performance.
### Diversion and Data Capture Rate
**Diversion Rate** bars show the share of waste diverted each month. **Data Capture Rate** (yellow line) shows reporting completeness over the same period. A high diversion rate with a low capture rate can mean incomplete stream coverage rather than strong diversion performance.
 ### Waste Composition by Stream
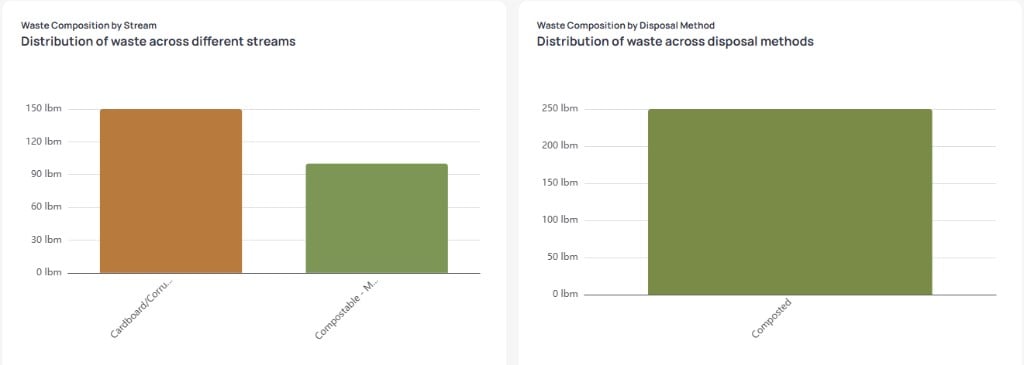
The **Waste Composition by Stream** chart groups quantity by material category, such as **Cardboard/Corrugated** and **Compostable - Mixed**.
### Waste Composition by Disposal Method
The **Waste Composition by Disposal Method** chart totals quantity by outcome, such as **Composted**. Compare it to the stream chart to confirm disposal methods align with material types.
### Waste Composition by Stream
The **Waste Composition by Stream** chart groups quantity by material category, such as **Cardboard/Corrugated** and **Compostable - Mixed**.
### Waste Composition by Disposal Method
The **Waste Composition by Disposal Method** chart totals quantity by outcome, such as **Composted**. Compare it to the stream chart to confirm disposal methods align with material types.
Create waste streams
A waste stream combines disposal method, material type, and measurement settings. Define streams once, then post recurring pickups against them.
Composted, disposed, donated or reused, or recycled value that matches hauler invoices.
On the **Waste** dashboard, click **Create Meter**. The **Waste Meter Management** form opens.
Pick **Composted**, **Disposed**, **Donated or reused**, or **Recycled** to match vendor reporting.
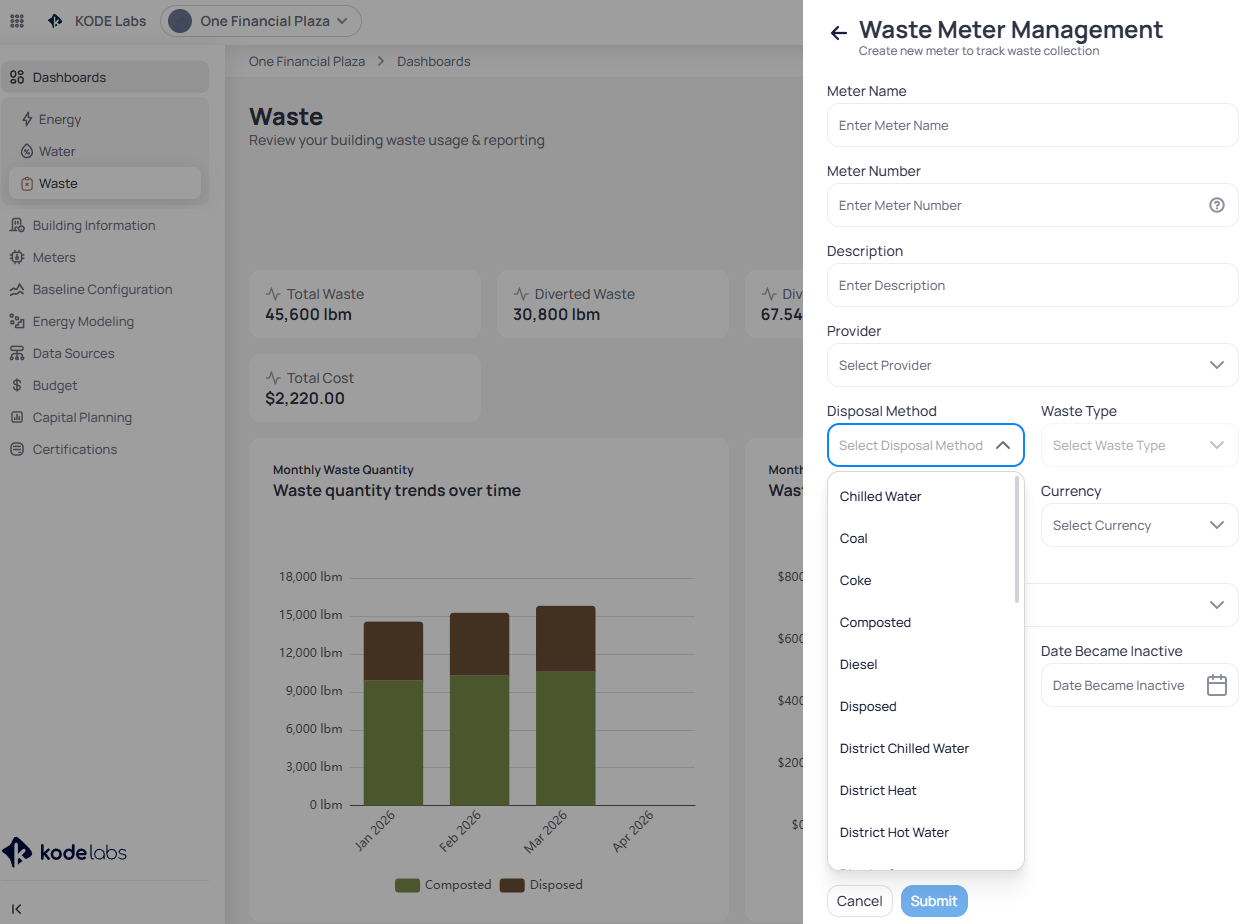 Choose a category such as appliances, batteries, or cardboard. Set the unit of measure and **Currency** for cost fields.
Click **Save**. The stream appears for data entry and in monthly charts.
Choose a category such as appliances, batteries, or cardboard. Set the unit of measure and **Currency** for cost fields.
Click **Save**. The stream appears for data entry and in monthly charts.
Add waste data
Each entry records quantity, cost, and service timing. Attach ticket PDFs and notes for audit trails.
Click **Add Waste Data** in the header.
Choose the **Waste Stream** meter, then enter **Quantity** and **Cost** when available.
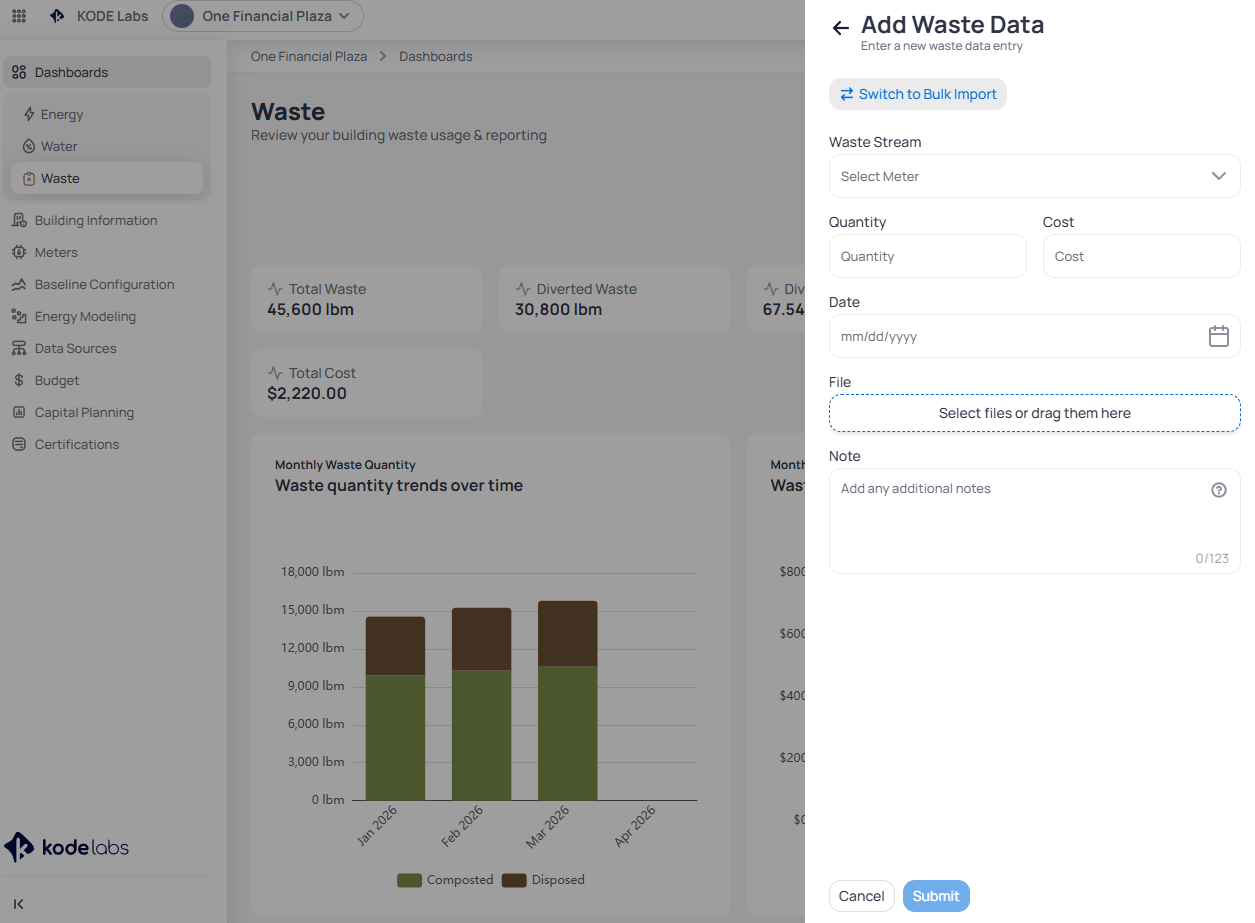 Choose the pickup date. EnerG allocates the amount to the pickup month.
Upload a PDF waste ticket, add **Note** text for anomalies, then click **Save**.
Confirm the pickup month matches the hauler invoice before you share diversion metrics.
Use **Switch to Bulk Import** in the **Add Waste Data** panel when you need to load many pickups from a spreadsheet.
Missing pickups understate diversion rates until you backfill the month. Plan monthly reviews when waste data is entered manually.
## Next steps
Create manual waste meters when streams are not tied to a utility feed.
Compare this building to portfolio totals and peer sites.
Review electricity and fuel usage for the same building.
Review water consumption and cost for the same building.
Choose the pickup date. EnerG allocates the amount to the pickup month.
Upload a PDF waste ticket, add **Note** text for anomalies, then click **Save**.
Confirm the pickup month matches the hauler invoice before you share diversion metrics.
Use **Switch to Bulk Import** in the **Add Waste Data** panel when you need to load many pickups from a spreadsheet.
Missing pickups understate diversion rates until you backfill the month. Plan monthly reviews when waste data is entered manually.
## Next steps
Create manual waste meters when streams are not tied to a utility feed.
Compare this building to portfolio totals and peer sites.
Review electricity and fuel usage for the same building.
Review water consumption and cost for the same building.