> ## Documentation Index
> Fetch the complete documentation index at: https://documentation.kodelabs.com/llms.txt
> Use this file to discover all available pages before exploring further.
# Baseline analysis overview
> Compare portfolio-wide usage and savings to baseline configurations with weather-normalized models
Compare usage and savings across your portfolio against a saved baseline configuration. Use the **Baseline Overview** page after you define configurations on the [Configurations](/products/energ/analytics/baseline-portfolio-configurations) page. To learn how baselines and weather normalization work, see [Baselines and weather normalization](/products/energ/concepts/baselines-and-weather-normalization).
At each building, set energy, water, and waste baseline windows on [Configure building baseline windows](/products/energ/analytics/baseline-portfolio-configurations#configure-building-baseline-windows). Open **Baseline Analysis** on the [Building Energy dashboard](/products/energ/analytics/building-dashboards-energy#baseline-analysis) to review charts for one site.
## Navigate to Baseline Overview
In the [portfolio view](/products/energ/get-started/navigation#portfolio-view), expand `Baseline analysis` in the left sidebar and select `Overview`.
 ## Choose filters
Use the filter row to scope the comparison.
| Filter | Purpose |
| -------------------------- | ------------------------------------------------------------------------------------------------- |
| **Date range** | Reporting window for actual and normalized usage |
| **Resource type** | Commodity group: `Energy`, `Water`, or `Waste` |
| **Service type** | Narrow within the resource type (for example, `Electric`, `Natural Gas`, or `Lighting`) |
| **Baseline configuration** | Saved portfolio configuration such as `2024 Baseline - WN`, `2024 WN Test`, or `Default Baseline` |
When **Resource type** is `Energy`, **Service type** lists commodities such as `District Steam`, `Electric`, `Electric on Site Solar`, `Lighting`, `Natural Gas`, and `Steam`. Options change when you switch to `Water` or `Waste`.
## Analysis tab
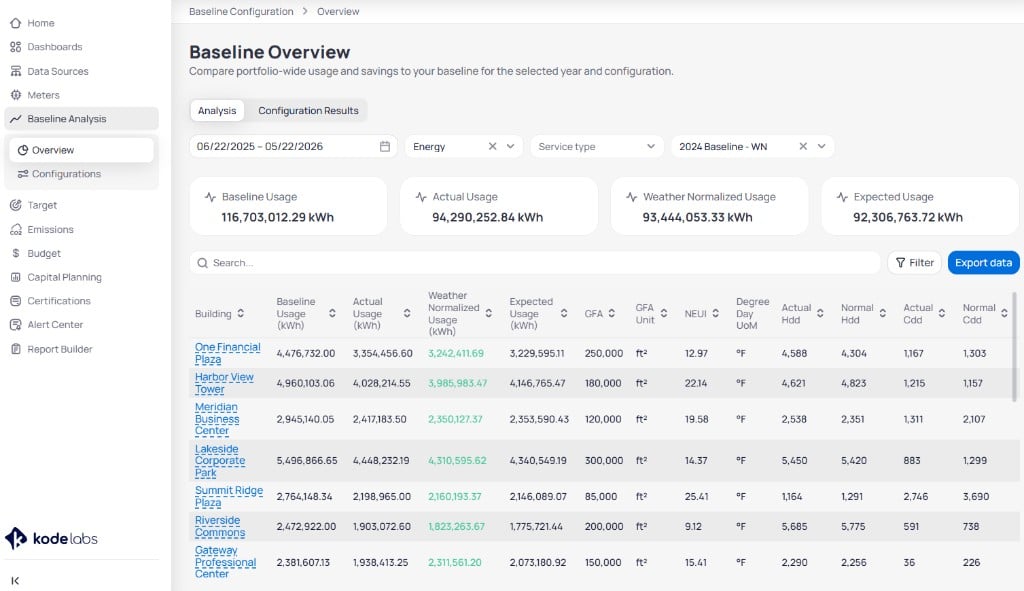
The **Analysis** tab summarizes portfolio totals and lists each building in a sortable table.
### Summary cards
Four cards roll up usage for the selected filters: **Baseline Usage**, **Actual Usage**, **Weather Normalized Usage**, and **Expected Usage**. For what each figure means, see [how normalized comparisons read](/products/energ/concepts/baselines-and-weather-normalization#how-normalized-comparisons-read).
### Building comparison table
The table lists one row per building. Click a **Building** name to open [Building information](/products/energ/buildings/building-information) for that site. Columns cover the four usage figures, gross floor area (`GFA`), normalized energy use intensity (`NEUI`), and actual versus normal heating and cooling degree days.
Use **Search** and **Filter** above the table to narrow the list. Click **Export data** to download the current view.
## Choose filters
Use the filter row to scope the comparison.
| Filter | Purpose |
| -------------------------- | ------------------------------------------------------------------------------------------------- |
| **Date range** | Reporting window for actual and normalized usage |
| **Resource type** | Commodity group: `Energy`, `Water`, or `Waste` |
| **Service type** | Narrow within the resource type (for example, `Electric`, `Natural Gas`, or `Lighting`) |
| **Baseline configuration** | Saved portfolio configuration such as `2024 Baseline - WN`, `2024 WN Test`, or `Default Baseline` |
When **Resource type** is `Energy`, **Service type** lists commodities such as `District Steam`, `Electric`, `Electric on Site Solar`, `Lighting`, `Natural Gas`, and `Steam`. Options change when you switch to `Water` or `Waste`.
## Analysis tab
The **Analysis** tab summarizes portfolio totals and lists each building in a sortable table.
### Summary cards
Four cards roll up usage for the selected filters: **Baseline Usage**, **Actual Usage**, **Weather Normalized Usage**, and **Expected Usage**. For what each figure means, see [how normalized comparisons read](/products/energ/concepts/baselines-and-weather-normalization#how-normalized-comparisons-read).
### Building comparison table
The table lists one row per building. Click a **Building** name to open [Building information](/products/energ/buildings/building-information) for that site. Columns cover the four usage figures, gross floor area (`GFA`), normalized energy use intensity (`NEUI`), and actual versus normal heating and cooling degree days.
Use **Search** and **Filter** above the table to narrow the list. Click **Export data** to download the current view.
 ## Configuration Results tab
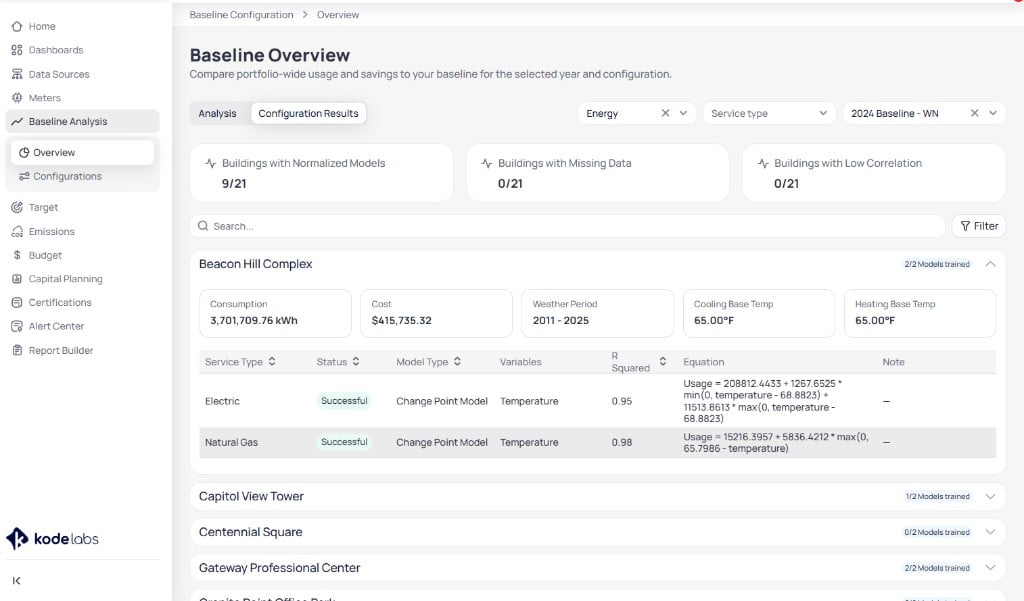
Switch to **Configuration Results** to review model training status and regression detail by building.
## Configuration Results tab
Switch to **Configuration Results** to review model training status and regression detail by building.
 ### Summary cards
| Card | What it shows |
| ------------------------------------ | ---------------------------------------------------------------------------- |
| **Buildings with Normalized Models** | Count of buildings with trained models versus buildings in the configuration |
| **Buildings with Missing Data** | Buildings that lack required inputs |
| **Buildings with Low Correlation** | Buildings where model correlation falls below tolerance |
### Building detail rows
Expand a building row to see consumption, cost, weather period, and base temperatures. The service-level table shows model type, variables, `R Squared`, and the regression equation for each service type, plus a note when training needs review. For model fit thresholds, see [model accuracy thresholds](/products/energ/reference/calculations-and-parameters#model-accuracy).
## Next steps
Create or edit portfolio baseline configurations and train weather models.
Return to portfolio rankings before you drill into baseline results.
Confirm meter completeness before you collect historical data for baselines.
Link reduction targets to the configurations you select on Overview.
### Summary cards
| Card | What it shows |
| ------------------------------------ | ---------------------------------------------------------------------------- |
| **Buildings with Normalized Models** | Count of buildings with trained models versus buildings in the configuration |
| **Buildings with Missing Data** | Buildings that lack required inputs |
| **Buildings with Low Correlation** | Buildings where model correlation falls below tolerance |
### Building detail rows
Expand a building row to see consumption, cost, weather period, and base temperatures. The service-level table shows model type, variables, `R Squared`, and the regression equation for each service type, plus a note when training needs review. For model fit thresholds, see [model accuracy thresholds](/products/energ/reference/calculations-and-parameters#model-accuracy).
## Next steps
Create or edit portfolio baseline configurations and train weather models.
Return to portfolio rankings before you drill into baseline results.
Confirm meter completeness before you collect historical data for baselines.
Link reduction targets to the configurations you select on Overview.