> ## Documentation Index
> Fetch the complete documentation index at: https://documentation.kodelabs.com/llms.txt
> Use this file to discover all available pages before exploring further.
# Baseline analysis configurations
> Create and manage portfolio baseline configurations with weather normalization for energy, water, and waste
Create and manage baseline configurations that you apply on [Baseline analysis overview](/products/energ/analytics/baseline-portfolio-overview). Each configuration selects buildings, service types, baseline periods, and optional weather normalization. To learn how baselines and weather normalization work, see [Baselines and weather normalization](/products/energ/concepts/baselines-and-weather-normalization).
## Navigate to Configurations
In the [portfolio view](/products/energ/get-started/navigation#portfolio-view), expand `Baseline analysis` in the left sidebar and select `Configurations`.
 ## Review existing configurations
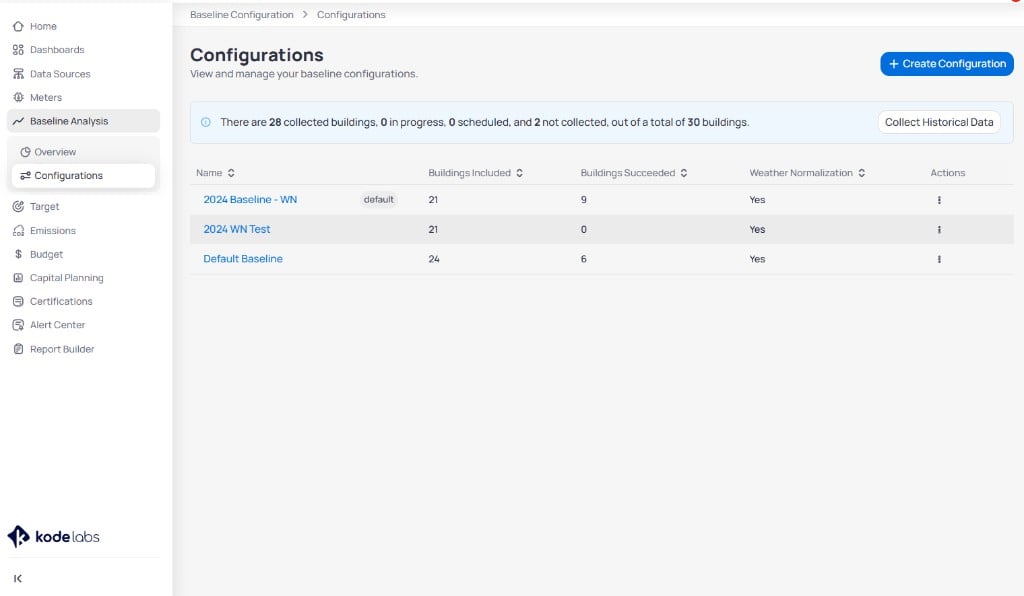
The table lists every saved configuration.
| Column | Description |
| ------------------------- | ----------------------------------------------------------------- |
| **Name** | Configuration label. A `default` tag marks the portfolio default. |
| **Buildings Included** | Buildings selected in the configuration |
| **Buildings Succeeded** | Buildings with successfully trained models |
| **Weather Normalization** | Whether weather normalization is enabled (`Yes` or `No`) |
| **Actions** | Menu to edit, collect data, or delete |
The status banner summarizes collection progress across the portfolio. Click **Collect Historical Data** when you need EnerG to refresh billing and interval history for buildings in the configuration.
## Create a configuration
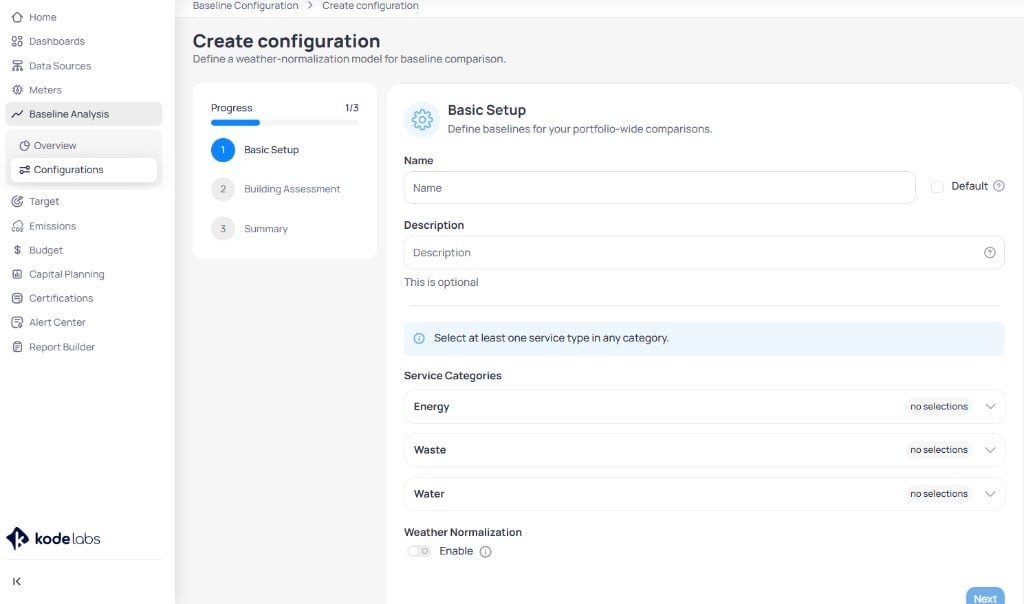
Click `+ Create Configuration` to open the three-step wizard.
### Step 1: Basic setup
Enter a name and optional description. Mark **Default** when this configuration should load first on the Overview page.
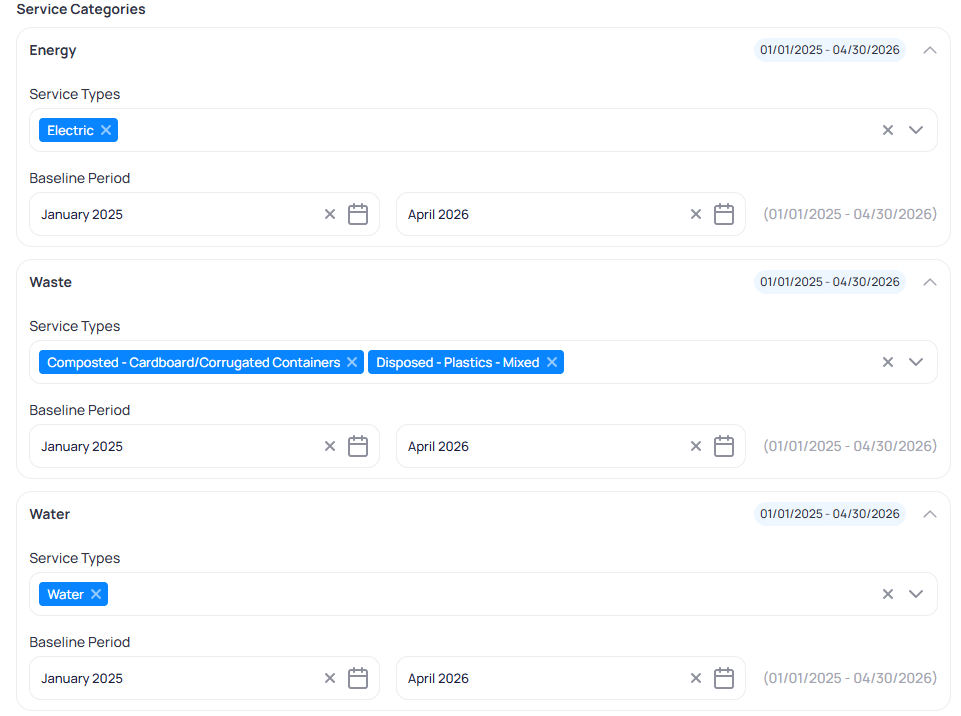
Select at least one service type in **Energy**, **Waste**, or **Water**. Expand each category to choose service types and set the **Baseline period** start and end months.
## Review existing configurations
The table lists every saved configuration.
| Column | Description |
| ------------------------- | ----------------------------------------------------------------- |
| **Name** | Configuration label. A `default` tag marks the portfolio default. |
| **Buildings Included** | Buildings selected in the configuration |
| **Buildings Succeeded** | Buildings with successfully trained models |
| **Weather Normalization** | Whether weather normalization is enabled (`Yes` or `No`) |
| **Actions** | Menu to edit, collect data, or delete |
The status banner summarizes collection progress across the portfolio. Click **Collect Historical Data** when you need EnerG to refresh billing and interval history for buildings in the configuration.
## Create a configuration
Click `+ Create Configuration` to open the three-step wizard.
### Step 1: Basic setup
Enter a name and optional description. Mark **Default** when this configuration should load first on the Overview page.
Select at least one service type in **Energy**, **Waste**, or **Water**. Expand each category to choose service types and set the **Baseline period** start and end months.
 #### Weather normalization
Enable **Weather Normalization** to train regression models that adjust usage for heating and cooling conditions.
#### Weather normalization
Enable **Weather Normalization** to train regression models that adjust usage for heating and cooling conditions.
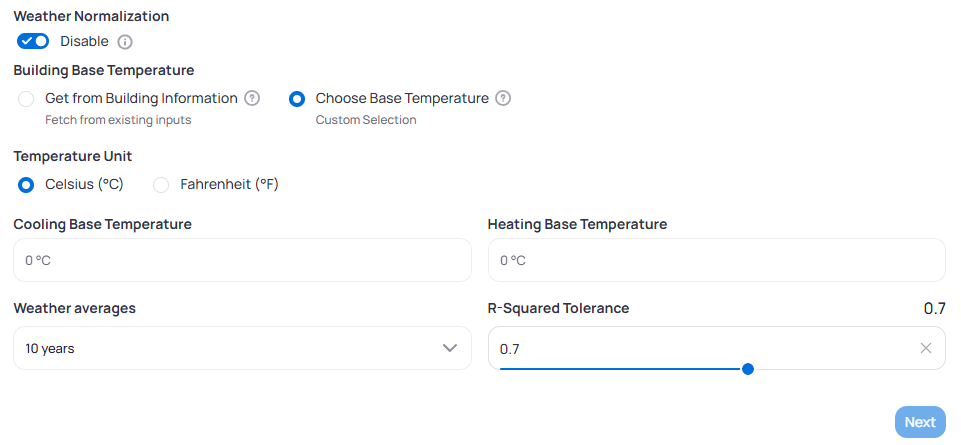 Set the base temperature source, temperature unit, cooling and heating base temperatures, weather averages lookback, and R-squared tolerance. For each setting, see [weather normalization settings](/products/energ/reference/calculations-and-parameters#weather-normalization).
Click `Next` when every required category has at least one service type selected.
### Step 2: Building assessment
Select buildings to include. The table shows eligibility, weather period, and base temperatures. Expand a building to review service-level completeness, baseline dates, consumption, and cost.
Set the base temperature source, temperature unit, cooling and heating base temperatures, weather averages lookback, and R-squared tolerance. For each setting, see [weather normalization settings](/products/energ/reference/calculations-and-parameters#weather-normalization).
Click `Next` when every required category has at least one service type selected.
### Step 2: Building assessment
Select buildings to include. The table shows eligibility, weather period, and base temperatures. Expand a building to review service-level completeness, baseline dates, consumption, and cost.
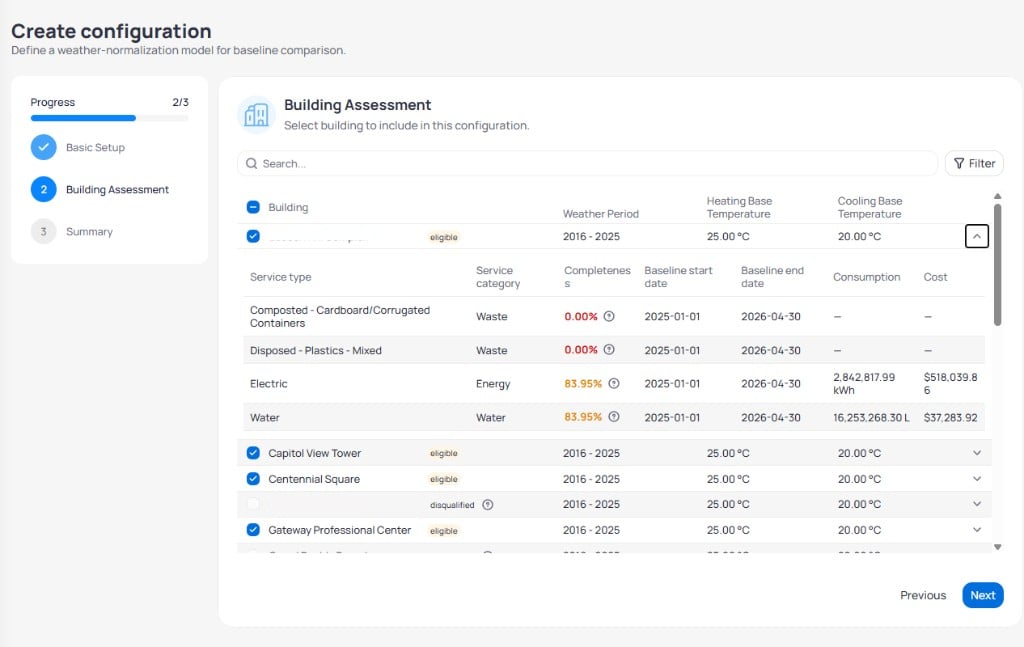 Buildings marked **disqualified** lack the data required for the selected service types. Repair meter gaps or widen the baseline period before you include them.
Click `Next` to review the summary.
### Step 3: Summary and model training
EnerG saves the configuration and trains weather normalization models for each building and service type. Training can take several minutes. The screen updates automatically when models finish.
Buildings marked **disqualified** lack the data required for the selected service types. Repair meter gaps or widen the baseline period before you include them.
Click `Next` to review the summary.
### Step 3: Summary and model training
EnerG saves the configuration and trains weather normalization models for each building and service type. Training can take several minutes. The screen updates automatically when models finish.
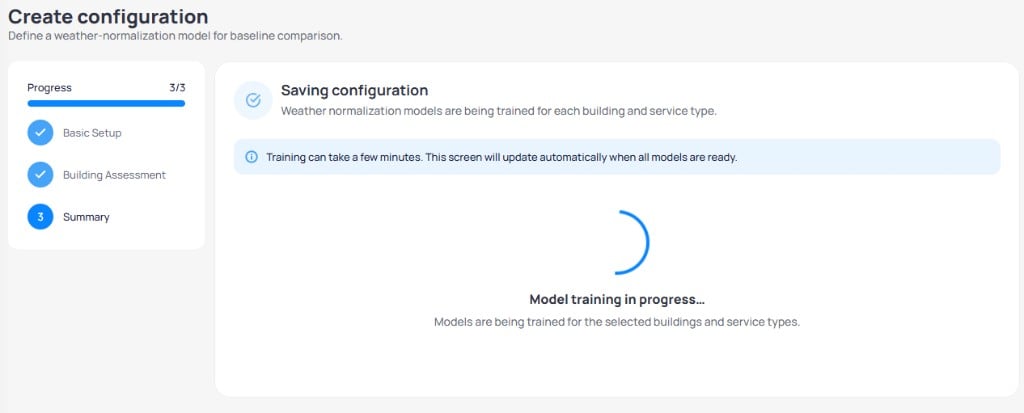 After training completes, open [Baseline analysis overview](/products/energ/analytics/baseline-portfolio-overview) and confirm buildings appear under **Configuration Results** with `Successful` status.
Portfolio configurations train weather-normalized models across many buildings. At each site, you also set **energy**, **water**, and **waste** baseline windows that drive targets, M\&V, and dashboard comparisons.
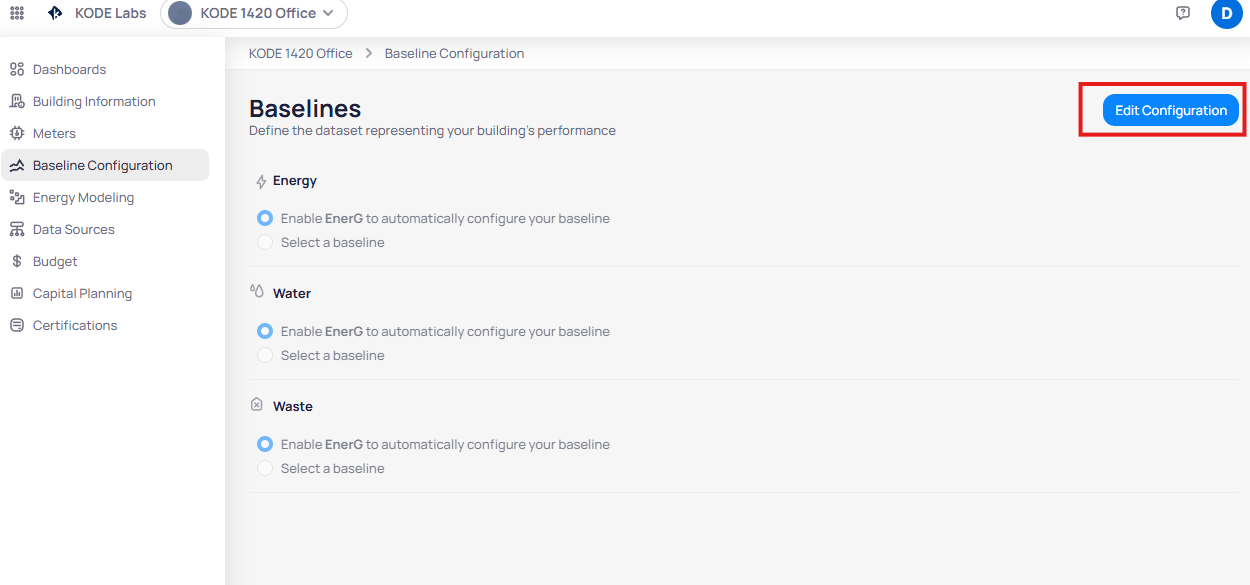
Open the building view from [Portfolio Home](/products/energ/analytics/benchmarking), then use **Dashboards** > **Energy** > **Baseline Analysis** on the [Building Energy dashboard](/products/energ/analytics/building-dashboards-energy#baseline-analysis). Click **Edit Configuration** in the top-right corner of the baseline page to configure categories.
### Read baseline status
The overview lists three service categories.
| Category | What the overview shows |
| ---------- | -------------------------------------------------------------------------------------- |
| **Energy** | Whether a baseline is configured and which period applies to electric and fuel streams |
| **Water** | Baseline status for water meters and billed usage |
| **Waste** | Baseline status for waste reporting categories |
Confirm each category is ready before you run targets, M\&V, or savings reports.
### Baseline length and purpose
Pick a one-year or two-year baseline depending on data stability and reporting policy. For guidance on choosing a length, see [baseline length](/products/energ/concepts/baselines-and-weather-normalization#baseline-length).
Close gaps in bills or interval feeds on [Building meters](/products/energ/buildings/meters) or through [Data completeness](/products/energ/data-quality/data-completeness) before you finalize a window. For qualification rules, see [baseline qualification](/products/energ/reference/calculations-and-parameters#baseline-qualification).
Partial months or missing commodities inside the span disqualify that period until you repair the data.
After training completes, open [Baseline analysis overview](/products/energ/analytics/baseline-portfolio-overview) and confirm buildings appear under **Configuration Results** with `Successful` status.
Portfolio configurations train weather-normalized models across many buildings. At each site, you also set **energy**, **water**, and **waste** baseline windows that drive targets, M\&V, and dashboard comparisons.
Open the building view from [Portfolio Home](/products/energ/analytics/benchmarking), then use **Dashboards** > **Energy** > **Baseline Analysis** on the [Building Energy dashboard](/products/energ/analytics/building-dashboards-energy#baseline-analysis). Click **Edit Configuration** in the top-right corner of the baseline page to configure categories.
### Read baseline status
The overview lists three service categories.
| Category | What the overview shows |
| ---------- | -------------------------------------------------------------------------------------- |
| **Energy** | Whether a baseline is configured and which period applies to electric and fuel streams |
| **Water** | Baseline status for water meters and billed usage |
| **Waste** | Baseline status for waste reporting categories |
Confirm each category is ready before you run targets, M\&V, or savings reports.
### Baseline length and purpose
Pick a one-year or two-year baseline depending on data stability and reporting policy. For guidance on choosing a length, see [baseline length](/products/energ/concepts/baselines-and-weather-normalization#baseline-length).
Close gaps in bills or interval feeds on [Building meters](/products/energ/buildings/meters) or through [Data completeness](/products/energ/data-quality/data-completeness) before you finalize a window. For qualification rules, see [baseline qualification](/products/energ/reference/calculations-and-parameters#baseline-qualification).
Partial months or missing commodities inside the span disqualify that period until you repair the data.
 ### Auto-configured baselines
EnerG can pick the earliest 12-month span where every required service type has complete data.
Use automatic configuration when utility coverage is complete and you need the earliest valid year.
On the building baseline page, click **Edit Configuration**.
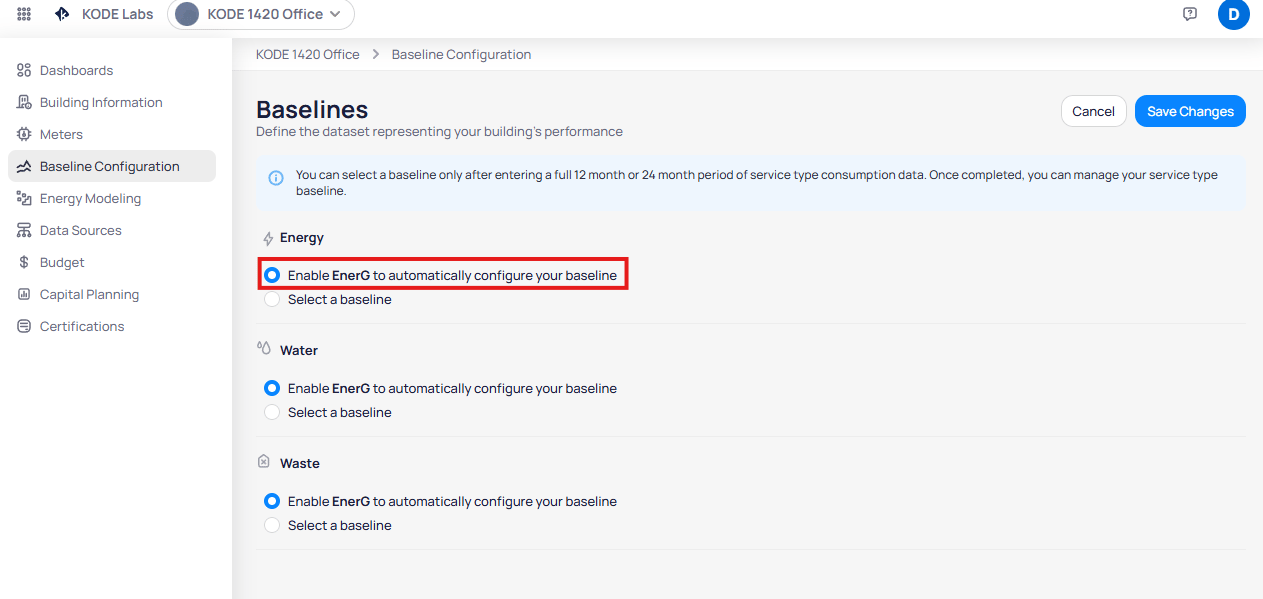
Select the auto-configure option that picks the earliest qualifying 12-month period.
### Auto-configured baselines
EnerG can pick the earliest 12-month span where every required service type has complete data.
Use automatic configuration when utility coverage is complete and you need the earliest valid year.
On the building baseline page, click **Edit Configuration**.
Select the auto-configure option that picks the earliest qualifying 12-month period.
 Confirm start and end months cover all energy, water, and waste feeds you expect.
Click **Save Changes**, then confirm. Baselines feed metrics across EnerG, including the [Building Energy Baseline Analysis](/products/energ/analytics/building-dashboards-energy#baseline-analysis) report.
### Manual baseline selection
Define the window when policy requires a specific end month or a two-year average. EnerG calculates the start month from your duration and ending month.
Month that closes the baseline window when you configure a manual baseline.
Choose a one-year or two-year baseline length.
Select the month that closes the baseline window.
Review the auto-calculated start month for the chosen duration.
Click **Save Changes** to store the manual baseline.
A 24-month baseline averages duplicate calendar months. Two January rows become one January value before comparisons run.
### Configure by service category
Energy, water, and waste can each use a different baseline period. Electric and fuel streams roll into **Energy**. Water and waste stay separate.
Confirm start and end months cover all energy, water, and waste feeds you expect.
Click **Save Changes**, then confirm. Baselines feed metrics across EnerG, including the [Building Energy Baseline Analysis](/products/energ/analytics/building-dashboards-energy#baseline-analysis) report.
### Manual baseline selection
Define the window when policy requires a specific end month or a two-year average. EnerG calculates the start month from your duration and ending month.
Month that closes the baseline window when you configure a manual baseline.
Choose a one-year or two-year baseline length.
Select the month that closes the baseline window.
Review the auto-calculated start month for the chosen duration.
Click **Save Changes** to store the manual baseline.
A 24-month baseline averages duplicate calendar months. Two January rows become one January value before comparisons run.
### Configure by service category
Energy, water, and waste can each use a different baseline period. Electric and fuel streams roll into **Energy**. Water and waste stay separate.
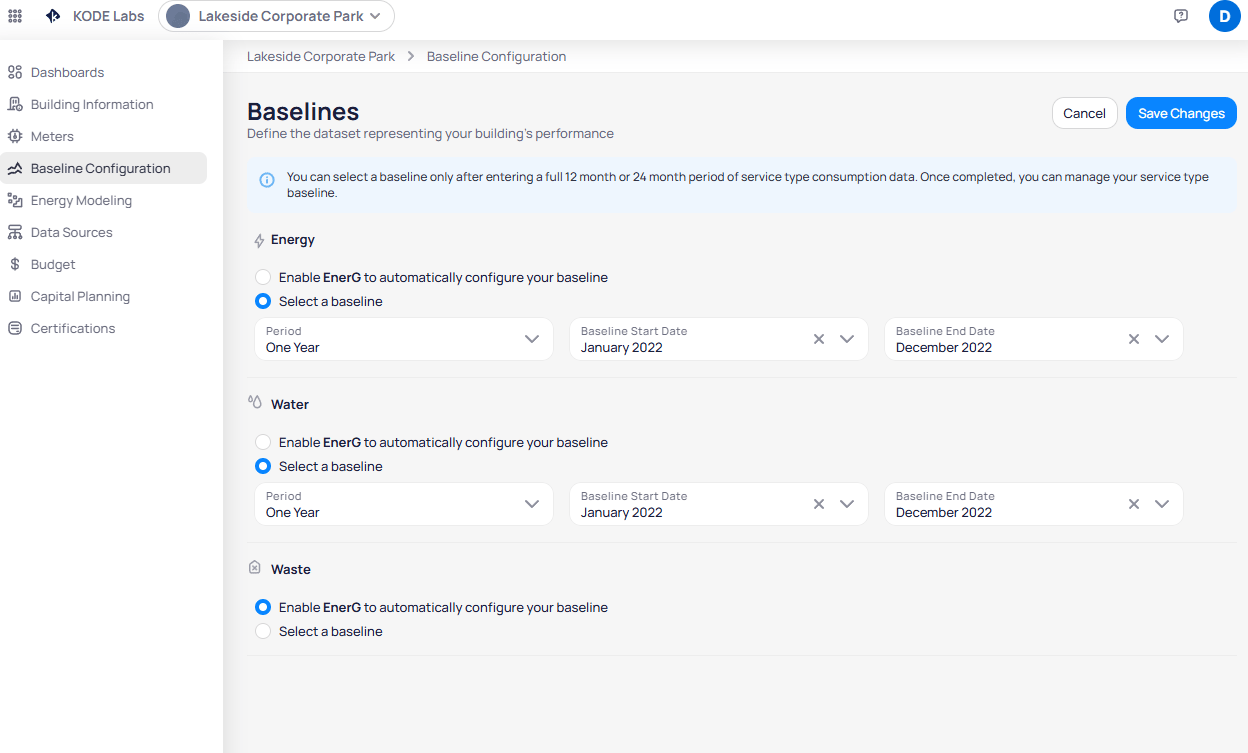 Align baseline windows with the meters that existed for each category during the same months.
## Next steps
Compare portfolio usage on the Analysis and Configuration Results tabs.
Review base temperatures and area data that feed weather normalization.
Improve completeness before you rerun Collect Historical Data.
Review baseline charts after you save building windows.
Use trained baselines in M\&V and forecasting workflows at the building level.
Align baseline windows with the meters that existed for each category during the same months.
## Next steps
Compare portfolio usage on the Analysis and Configuration Results tabs.
Review base temperatures and area data that feed weather normalization.
Improve completeness before you rerun Collect Historical Data.
Review baseline charts after you save building windows.
Use trained baselines in M\&V and forecasting workflows at the building level.