> ## Documentation Index
> Fetch the complete documentation index at: https://documentation.kodelabs.com/llms.txt
> Use this file to discover all available pages before exploring further.

# Build your first dashboard

> Build a Down Devices Building BI dashboard with Number (Target), bar, line, and pivot table widgets.

export const TutorialStep = ({tutorialId, id, number, title, stepIds = "", subStepIds = "", mediaLabel, children}) => {
  const progressEvent = "kode-tutorial-progress";
  const brandBlues = ["#015BFA", "#3A9AFF", "#7BB3FF", "#C5DBFF", "#E8F1FF"];
  const [complete, setComplete] = useState(false);
  const parseIds = value => {
    if (Array.isArray(value)) return value;
    if (typeof value === "string" && value.length > 0) {
      return value.split(",").map(stepId => stepId.trim()).filter(Boolean);
    }
    return [];
  };
  const hasSubsteps = parseIds(subStepIds).length > 0;
  const readProgress = () => {
    if (typeof window === "undefined") return {};
    try {
      return JSON.parse(localStorage.getItem(`kode-tutorial:${tutorialId}`) || "{}");
    } catch {
      return {};
    }
  };
  const writeProgress = next => {
    if (typeof window === "undefined") return;
    localStorage.setItem(`kode-tutorial:${tutorialId}`, JSON.stringify(next));
    window.dispatchEvent(new CustomEvent(progressEvent, {
      detail: {
        tutorialId,
        progress: next
      }
    }));
  };
  const computeComplete = current => {
    const subs = parseIds(subStepIds);
    if (subs.length > 0) {
      return subs.every(stepId => current[stepId] === true);
    }
    return current[id] === true;
  };
  const playConfetti = () => {
    if (typeof window === "undefined" || typeof document === "undefined") return;
    const canvas = document.createElement("canvas");
    canvas.className = "tutorial-confetti-canvas";
    canvas.width = window.innerWidth;
    canvas.height = window.innerHeight;
    document.body.appendChild(canvas);
    const ctx = canvas.getContext("2d");
    const pieces = Array.from({
      length: 80
    }, () => ({
      x: Math.random() * canvas.width,
      y: -20 - Math.random() * canvas.height * 0.35,
      w: 4 + Math.random() * 5,
      h: 6 + Math.random() * 8,
      color: brandBlues[Math.floor(Math.random() * brandBlues.length)],
      vy: 2.2 + Math.random() * 3.2,
      vx: -1.5 + Math.random() * 3,
      rot: Math.random() * Math.PI,
      vr: -0.12 + Math.random() * 0.24,
      alpha: 0.55 + Math.random() * 0.35
    }));
    let frame = 0;
    const maxFrames = 110;
    const draw = () => {
      frame += 1;
      ctx.clearRect(0, 0, canvas.width, canvas.height);
      pieces.forEach(piece => {
        piece.x += piece.vx;
        piece.y += piece.vy;
        piece.rot += piece.vr;
        piece.vy += 0.045;
        const fade = Math.max(0, 1 - frame / maxFrames);
        ctx.save();
        ctx.translate(piece.x, piece.y);
        ctx.rotate(piece.rot);
        ctx.globalAlpha = piece.alpha * fade;
        ctx.fillStyle = piece.color;
        ctx.fillRect(-piece.w / 2, -piece.h / 2, piece.w, piece.h);
        ctx.restore();
      });
      if (frame < maxFrames) {
        requestAnimationFrame(draw);
      } else {
        canvas.remove();
      }
    };
    requestAnimationFrame(draw);
  };
  useEffect(() => {
    const current = readProgress();
    setComplete(computeComplete(current));
    const onProgress = event => {
      if (event.detail?.tutorialId === tutorialId) {
        setComplete(computeComplete(event.detail.progress || ({})));
      }
    };
    window.addEventListener(progressEvent, onProgress);
    return () => window.removeEventListener(progressEvent, onProgress);
  }, [tutorialId, id, subStepIds]);
  const toggleComplete = () => {
    if (hasSubsteps) return;
    const current = readProgress();
    const nextValue = !current[id];
    const next = {
      ...current,
      [id]: nextValue
    };
    writeProgress(next);
    setComplete(nextValue);
    const topLevel = parseIds(stepIds);
    if (nextValue && topLevel.length > 0 && topLevel.every(stepId => next[stepId] === true)) {
      playConfetti();
    }
  };
  return <section id={`tutorial-step-${id}`} className={`tutorial-step-card${complete ? " is-complete" : ""}`}>
      <div className="tutorial-step-header">
        <div>
          <p className="tutorial-step-number">Step {number}</p>
          <h3 className="tutorial-step-title">{title}</h3>
        </div>
        <button type="button" className={`tutorial-complete-btn${complete ? " is-complete" : ""}${hasSubsteps ? " is-locked" : ""}`} onClick={toggleComplete} aria-pressed={complete} aria-label={hasSubsteps ? complete ? "All substeps complete" : "Complete all substeps first" : complete ? "Mark step incomplete" : "Mark step complete"} title={hasSubsteps ? complete ? "All substeps complete" : "Complete all substeps first" : complete ? "Mark incomplete" : "Mark complete"} disabled={hasSubsteps}>
          {complete ? "✓" : ""}
        </button>
      </div>

      {mediaLabel ? <div className="tutorial-media-slot" aria-label="Media placeholder">
          <div className="tutorial-media-placeholder">
            <span>{mediaLabel}</span>
            <span className="tutorial-media-hint">
              Replace this block with a Frame, image, or video when ready
            </span>
          </div>
        </div> : null}

      <div className="tutorial-step-body">{children}</div>

      <div className="tutorial-step-footer">
        {hasSubsteps ? <p className="tutorial-step-gate">
            {complete ? "All substeps complete" : "Mark each substep complete to finish this step"}
          </p> : <button type="button" className={`tutorial-mark-complete${complete ? " is-complete" : ""}`} onClick={toggleComplete}>
            {complete ? "Completed" : "Mark step complete"}
          </button>}
      </div>
    </section>;
};

export const TutorialProgress = ({tutorialId, steps = []}) => {
  const progressEvent = "kode-tutorial-progress";
  const [progress, setProgress] = useState({});
  const [activeId, setActiveId] = useState(steps[0]?.id || "");
  const parseSubsteps = step => {
    if (!step?.substeps) return [];
    if (Array.isArray(step.substeps)) return step.substeps;
    if (typeof step.substeps !== "string") return [];
    return step.substeps.split(";").map(entry => entry.trim()).filter(Boolean).map(entry => {
      const sep = entry.indexOf(":");
      if (sep === -1) return {
        id: entry,
        title: entry
      };
      return {
        id: entry.slice(0, sep).trim(),
        title: entry.slice(sep + 1).trim()
      };
    });
  };
  const isStepComplete = (step, current) => {
    const subs = parseSubsteps(step);
    if (subs.length > 0) {
      return subs.every(sub => current[sub.id] === true);
    }
    return current[step.id] === true;
  };
  const readProgress = () => {
    if (typeof window === "undefined") return {};
    try {
      return JSON.parse(localStorage.getItem(`kode-tutorial:${tutorialId}`) || "{}");
    } catch {
      return {};
    }
  };
  const resetProgress = () => {
    if (typeof window === "undefined") return;
    localStorage.removeItem(`kode-tutorial:${tutorialId}`);
    window.dispatchEvent(new CustomEvent(progressEvent, {
      detail: {
        tutorialId,
        progress: {}
      }
    }));
  };
  useEffect(() => {
    setProgress(readProgress());
    const onProgress = event => {
      if (event.detail?.tutorialId === tutorialId) {
        setProgress(event.detail.progress || ({}));
      }
    };
    window.addEventListener(progressEvent, onProgress);
    return () => window.removeEventListener(progressEvent, onProgress);
  }, [tutorialId]);
  useEffect(() => {
    const ids = [];
    steps.forEach(step => {
      ids.push(step.id);
      parseSubsteps(step).forEach(sub => ids.push(sub.id));
    });
    const nodes = ids.map(stepId => {
      return document.getElementById(`tutorial-step-${stepId}`) || document.getElementById(`tutorial-substep-${stepId}`);
    }).filter(Boolean);
    if (nodes.length === 0) return undefined;
    const observer = new IntersectionObserver(entries => {
      const visible = entries.filter(entry => entry.isIntersecting).sort((a, b) => b.intersectionRatio - a.intersectionRatio);
      if (visible[0]?.target?.id) {
        const raw = visible[0].target.id.replace("tutorial-substep-", "").replace("tutorial-step-", "");
        setActiveId(raw);
      }
    }, {
      rootMargin: "-20% 0px -55% 0px",
      threshold: [0.15, 0.4, 0.7]
    });
    nodes.forEach(node => observer.observe(node));
    return () => observer.disconnect();
  }, [tutorialId, steps.length]);
  const completedCount = steps.filter(step => isStepComplete(step, progress)).length;
  const done = steps.length > 0 && steps.every(step => isStepComplete(step, progress));
  const pct = steps.length ? Math.round(completedCount / steps.length * 100) : 0;
  return <aside className="tutorial-progress" aria-label="Tutorial progress">
      <div className="tutorial-progress-header">
        <p className="tutorial-progress-label">Progress</p>
        <p className="tutorial-progress-count">
          {completedCount} / {steps.length}
        </p>
      </div>

      <div className="tutorial-progress-bar" role="progressbar" aria-valuemin={0} aria-valuemax={steps.length} aria-valuenow={completedCount}>
        <div className="tutorial-progress-bar-fill" style={{
    width: `${pct}%`
  }} />
      </div>

      <ol className="tutorial-progress-list">
        {steps.map((step, index) => {
    const subs = parseSubsteps(step);
    const isComplete = isStepComplete(step, progress);
    const isActive = activeId === step.id || subs.some(sub => sub.id === activeId);
    return <li key={step.id} className="tutorial-progress-group">
              <a href={`#tutorial-step-${step.id}`} className={["tutorial-progress-item", isActive ? "is-active" : "", isComplete ? "is-complete" : ""].filter(Boolean).join(" ")}>
                <span className="tutorial-progress-marker" aria-hidden="true">
                  {isComplete ? "✓" : index}
                </span>
                <span className="tutorial-progress-title">{step.title}</span>
              </a>

              {subs.length > 0 ? <ol className="tutorial-progress-sublist">
                  {subs.map((sub, subIndex) => {
      const subComplete = progress[sub.id] === true;
      const subActive = activeId === sub.id;
      return <li key={sub.id}>
                        <a href={`#tutorial-substep-${sub.id}`} className={["tutorial-progress-item tutorial-progress-item--sub", subActive ? "is-active" : "", subComplete ? "is-complete" : ""].filter(Boolean).join(" ")}>
                              <span className="tutorial-progress-marker tutorial-progress-marker--sub" aria-hidden="true">
                            {subComplete ? "✓" : ""}
                          </span>
                          <span className="tutorial-progress-title">
                            {sub.title}
                          </span>
                        </a>
                      </li>;
    })}
                </ol> : null}
            </li>;
  })}
      </ol>

      <div className="tutorial-progress-footer">
        {done ? <p className="tutorial-progress-done">Tutorial complete</p> : null}

        {completedCount > 0 || Object.keys(progress).length > 0 ? <button type="button" className="tutorial-reset" onClick={resetProgress}>
            Reset progress
          </button> : null}
      </div>
    </aside>;
};

export const TutorialHero = ({eyebrow = "Tutorial", title, summary, time, level, imageSrc, imageAlt = "Tutorial preview"}) => {
  useEffect(() => {
    if (typeof document === "undefined") return undefined;
    document.documentElement.setAttribute("data-tutorial-layout", "true");
    const page = document.querySelector(".tutorial-page");
    if (page) {
      let sibling = page.previousElementSibling;
      while (sibling) {
        sibling.setAttribute("data-tutorial-hidden-header", "true");
        sibling = sibling.previousElementSibling;
      }
    }
    document.querySelectorAll("h1").forEach(heading => {
      if (heading.textContent.trim() !== title) return;
      heading.setAttribute("data-tutorial-hidden-header", "true");
      const prev = heading.previousElementSibling;
      if (prev) prev.setAttribute("data-tutorial-hidden-header", "true");
      const next = heading.nextElementSibling;
      if (next && next.tagName === "P") {
        next.setAttribute("data-tutorial-hidden-header", "true");
      }
    });
    return () => {
      document.documentElement.removeAttribute("data-tutorial-layout");
      document.querySelectorAll("[data-tutorial-hidden-header]").forEach(node => node.removeAttribute("data-tutorial-hidden-header"));
    };
  }, [title]);
  return <header className="tutorial-hero">
      <div className="tutorial-hero-glow" aria-hidden="true" />
      <div className="tutorial-hero-copy">
        <p className="tutorial-hero-eyebrow">{eyebrow}</p>
        <h2 className="tutorial-hero-title">{title}</h2>
        {summary ? <p className="tutorial-hero-summary">{summary}</p> : null}
        <div className="tutorial-hero-meta">
          {level ? <span className="tutorial-pill">{level}</span> : null}
          {time ? <span className="tutorial-pill">{time}</span> : null}
        </div>
      </div>
      <div className="tutorial-hero-media">
        {imageSrc ? <img src={imageSrc} alt={imageAlt} className="tutorial-hero-image" /> : <div className="tutorial-media-placeholder tutorial-media-placeholder--hero">
            <span>Add hero image</span>
            <span className="tutorial-media-hint">
              Drop a screenshot or still here
            </span>
          </div>}
      </div>
    </header>;
};

<div className="tutorial-page">
  <TutorialHero eyebrow="Building BI" title="Build your first dashboard" summary="Create a building-level Down Devices dashboard with a Number (Target) widget, bar chart, line chart, and pivot table." level="Beginner" time="About 30 min" imageSrc="/images/kode-os/building-bi/bbi-tutorial-final-layout.png" imageAlt="Completed Down Devices dashboard with Number (Target), bar chart, line chart, and pivot table widgets" />

  <div className="tutorial-body">
    <TutorialProgress
      tutorialId="bbi-first-dashboard"
      steps={[
    { id: "enable", title: "Enable Building BI" },
    { id: "create-dashboard", title: "Create a dashboard" },
    { id: "card-widget", title: "Card widget" },
    { id: "number-target", title: "Number (Target)" },
    { id: "bar-chart", title: "Bar chart" },
    { id: "line-chart", title: "Line chart" },
    { id: "pivot-table", title: "Pivot table" },
    { id: "final-styling", title: "Title and layout" },
  ]}
    />

    <div className="tutorial-steps">
      <TutorialStep tutorialId="bbi-first-dashboard" id="enable" number="0" title="Enable Building BI for your organization" stepIds="enable,create-dashboard,card-widget,number-target,bar-chart,line-chart,pivot-table,final-styling">
        <Frame>
          <img src="https://mintcdn.com/kodelabs/qpy9KTqZYAZmFRi5/images/kode-os/building-bi/bbi-tutorial-enable-building-bi.gif?s=d73d52511a6c551b32c3643deb19072e" alt="Building BI appearing in the left navigation after the module is enabled" width="497" height="306" data-path="images/kode-os/building-bi/bbi-tutorial-enable-building-bi.gif" />
        </Frame>

        Confirm that Building BI is available in the left navigation and that your role can open the module.

        Enable Building BI on the building `Modules` tab in Launchpad. KODE Support often does this for your organization. If you cannot see `Building BI`, contact [support@kodelabs.com](mailto:support@kodelabs.com) or ask your customer success manager (CSM). You can submit this as a support request or bug report.

        After the module is available, your role still needs the right permissions. See [Enable Building BI](/products/building-bi/overview#enable-building-bi) and [How Building BI permissions work](/products/building-bi/concepts/how-permissions-work).
      </TutorialStep>

      <TutorialStep tutorialId="bbi-first-dashboard" id="create-dashboard" number="1" title="Create a new dashboard" stepIds="enable,create-dashboard,card-widget,number-target,bar-chart,line-chart,pivot-table,final-styling">
        <Frame caption="">
          <img src="https://mintcdn.com/kodelabs/qpy9KTqZYAZmFRi5/images/kode-os/building-bi/bbi-tutorial-create-dashboard.png?fit=max&auto=format&n=qpy9KTqZYAZmFRi5&q=85&s=757423ca76f8c11f95d0153dd318df63" alt="New Dashboard dialog showing Down Devices as the title, a description field, and a timezone selector" width="1916" height="1270" data-path="images/kode-os/building-bi/bbi-tutorial-create-dashboard.png" />
        </Frame>

        Create an empty building-level dashboard. You fill it with widgets in the next steps.

        <Steps>
          <Step title="Open the New Dashboard dialog">
            Open `Collections and Dashboards` and select `+ New Dashboard`.
          </Step>

          <Step title="Choose the building level">
            Create the dashboard at the **building** level, not the portfolio level. Building-level dashboards scope to one building.
          </Step>

          <Step title="Name the dashboard">
            In the popup, set the name to `Down Devices`.
          </Step>

          <Step title="Add a description">
            Enter a short description such as `Track currently down devices by type, trend, and device detail.`
          </Step>

          <Step title="Set the timezone">
            Set the timezone to your building's timezone. See [Timezone configuration](/products/building-bi/reference/timezone-configuration).
          </Step>

          <Step title="Create the dashboard">
            Select `Create`, then open the dashboard and enter edit mode.
          </Step>
        </Steps>
      </TutorialStep>

      <TutorialStep tutorialId="bbi-first-dashboard" id="card-widget" number="2" title="Add a Card widget" stepIds="enable,create-dashboard,card-widget,number-target,bar-chart,line-chart,pivot-table,final-styling">
        Widget data can come from many sources. For this walkthrough, use two standard sources that appear in most KODE deployments:

        * [`Point Time Series Last Value Aggregated`](/products/building-bi/data-sources#key-data-sources) — last value each point reported. Use this so devices with different report intervals still appear.
        * [`Point Time Series Real Time`](/products/building-bi/data-sources#key-data-sources) — raw updates as soon as KODE receives them.

        Start with a [Card](/products/building-bi/reference/chart-types#card) that shows one value: the count of currently down devices.

        <Steps>
          <Step title="Drag a Card onto the canvas">
            From the chart list, drag a `Card` onto the canvas. Resize it as needed.

            <Frame caption="">
              <img className="tutorial-media-thumb" src="https://mintcdn.com/kodelabs/qpy9KTqZYAZmFRi5/images/kode-os/building-bi/bbi-tutorial-drag-card.gif?s=98d2febdcbf1a05e8d3fb2ac897fd61e" alt="Dragging a Card chart from the chart list onto the dashboard canvas" width="1916" height="1270" data-path="images/kode-os/building-bi/bbi-tutorial-drag-card.gif" />
            </Frame>
          </Step>

          <Step title="Choose the data source">
            Open the `Setup` tab. Select `Point Time Series Last Value Aggregated` so you read the last known device status.
          </Step>

          <Step title="Set the value">
            Set the value to the `device_id` column. Use **count distinct**. This counts unique devices. Count distinct is best practice even when each row should have one value.
          </Step>

          <Step title="Filter to down devices">
            Filter with the `cur_status` column. Set the operator to `in` and the value to `down`. See [Filter options](/products/building-bi/reference/filter-options).
          </Step>

          <Step title="Add a description">
            Open the `Style` tab. In `Description`, type `Currently Down Devices`. See [Chart styling options](/products/building-bi/reference/chart-styling-options#general).
          </Step>
        </Steps>

        Your Card should look like this:

        <Frame caption="">
          <img src="https://mintcdn.com/kodelabs/qpy9KTqZYAZmFRi5/images/kode-os/building-bi/bbi-tutorial-card-widget.png?fit=max&auto=format&n=qpy9KTqZYAZmFRi5&q=85&s=89b091a7dedef1b0047b622a79d97c66" alt="Card widget on the canvas showing a count of down devices with the Currently Down Devices description" width="483" height="347" data-path="images/kode-os/building-bi/bbi-tutorial-card-widget.png" />
        </Frame>
      </TutorialStep>

      <TutorialStep tutorialId="bbi-first-dashboard" id="number-target" number="3" title="Upgrade the Card to Number (Target)" stepIds="enable,create-dashboard,card-widget,number-target,bar-chart,line-chart,pivot-table,final-styling">
        <Frame caption="">
          <img src="https://mintcdn.com/kodelabs/qpy9KTqZYAZmFRi5/images/kode-os/building-bi/bbi-tutorial-number-target.png?fit=max&auto=format&n=qpy9KTqZYAZmFRi5&q=85&s=8870c925237cd6651fb26bdd30b11c0d" alt="Number (Target) widget showing down devices over total devices with Currently Down Devices as the description" width="468" height="335" data-path="images/kode-os/building-bi/bbi-tutorial-number-target.png" />
        </Frame>

        Convert the Card into a [Number (Target)](/products/building-bi/reference/chart-types#number-target) widget. The primary value stays filtered to down devices. The target shows the total device count for context.

        <Steps>
          <Step title="Change the chart type">
            In `Setup`, change the chart type from `Card` to `Number (Target)`. This adds a second metric next to the primary value.
          </Step>

          <Step title="Set the target value">
            Set `device_id` as the target value with **count distinct** and no filters. This shows down devices relative to total devices.
          </Step>

          <Step title="Emphasize the comparison">
            Open the `Style` tab. In `Target Metric`, change the color of the concatenation symbol and the metric so the comparison stands out. See [Chart styling options](/products/building-bi/reference/chart-styling-options).
          </Step>
        </Steps>
      </TutorialStep>

      <TutorialStep tutorialId="bbi-first-dashboard" id="bar-chart" number="4" title="Add a bar chart by device type" stepIds="enable,create-dashboard,card-widget,number-target,bar-chart,line-chart,pivot-table,final-styling">
        <Frame caption="">
          <img src="https://mintcdn.com/kodelabs/qpy9KTqZYAZmFRi5/images/kode-os/building-bi/bbi-tutorial-bar-chart.png?fit=max&auto=format&n=qpy9KTqZYAZmFRi5&q=85&s=c0e8df5eed6671448cb021d2407e7ec9" alt="Bar chart titled Currently Down Devices by Device Type with counts by mechanical type" width="809" height="332" data-path="images/kode-os/building-bi/bbi-tutorial-bar-chart.png" />
        </Frame>

        Build a [bar chart](/products/building-bi/reference/chart-types#bar) that shows down devices by device type. Use the same Last Value data source as the Number (Target) widget.

        <Steps>
          <Step title="Add the bar chart">
            Drag a `Bar` chart onto the canvas. Select `Point Time Series Last Value Aggregated`.
          </Step>

          <Step title="Filter to down devices">
            Set the filter on `cur_status` to `in` and `down`.
          </Step>

          <Step title="Configure the Y-axis">
            Use **count distinct** of `device_id`. This total should match your Number (Target) primary value.
          </Step>

          <Step title="Configure the X-axis">
            Use the `Device Mechanical Type Name` column. This ontology field returns types such as HVAC, AHU, or Water Meter.
          </Step>

          <Step title="Rename the axes">
            In `Setup`, open the dropdown for each column and set a display name. This updates the axis title and tooltip.
          </Step>

          <Step title="Style the chart">
            Open the `Style` tab and make these changes:

            * In [`General`](/products/building-bi/reference/chart-styling-options#general), set the title to `Currently Down Devices by Device Type`.
            * On the [`X-Axis`](/products/building-bi/reference/chart-styling-options#x-axis-and-y-axis) tab, adjust margin, interval, and value rotation so labels do not overlap.
            * In [`Data Labels`](/products/building-bi/reference/chart-styling-options#data-labels), enable labels with the eye icon. Set placement to `Outside`.
          </Step>
        </Steps>
      </TutorialStep>

      <TutorialStep tutorialId="bbi-first-dashboard" id="line-chart" number="5" title="Add a line chart over time" stepIds="enable,create-dashboard,card-widget,number-target,bar-chart,line-chart,pivot-table,final-styling">
        <Frame caption="">
          <img src="https://mintcdn.com/kodelabs/qpy9KTqZYAZmFRi5/images/kode-os/building-bi/bbi-tutorial-line-chart.png?fit=max&auto=format&n=qpy9KTqZYAZmFRi5&q=85&s=9c4b45d7ba8e6d862a8d3f4af92e64ab" alt="Line chart titled Down Devices in Last 7 Days with hourly counts on the X-axis" width="862" height="331" data-path="images/kode-os/building-bi/bbi-tutorial-line-chart.png" />
        </Frame>

        Create a [line chart](/products/building-bi/reference/chart-types#line) that shows down device counts over the last seven days.
        <Steps>
          <Step title="Add the line chart">
            Drag a `Line` chart onto the canvas. Select `Point Time Series Real Time`.
          </Step>

          <Step title="Limit the time range">
            Real Time includes every update, so start with a time filter. Set **Last time range** to **Last 7 Days**.
          </Step>

          <Step title="Set the X-axis">
            Put `date_time_local` on the X-axis. This is the localized time for the building. Change the granularity from `none` to **Date Hour** so each point is an hourly count.
          </Step>

          <Step title="Set the Y-axis">
            Use **count distinct** of `device_id`.
          </Step>

          <Step title="Style the chart">
            In [`Style` > `General`](/products/building-bi/reference/chart-styling-options#general), set the title to `Down Devices in Last 7 Days`. Rename the axes to `Down Devices` and `Date Hour` from `Setup` or the axis title fields in `Style`.
          </Step>
        </Steps>
      </TutorialStep>

      <TutorialStep tutorialId="bbi-first-dashboard" id="pivot-table" number="6" title="Add a pivot table with device links" stepIds="enable,create-dashboard,card-widget,number-target,bar-chart,line-chart,pivot-table,final-styling">
        <Frame caption="">
          <img src="https://mintcdn.com/kodelabs/qpy9KTqZYAZmFRi5/images/kode-os/building-bi/bbi-tutorial-pivot-table.gif?s=8def9d15d3f87f3c6289e8938d4b97ee" alt="Pivot table expanding device types to show device names linked to KODE OS device pages" width="567" height="467" data-path="images/kode-os/building-bi/bbi-tutorial-pivot-table.gif" />
        </Frame>

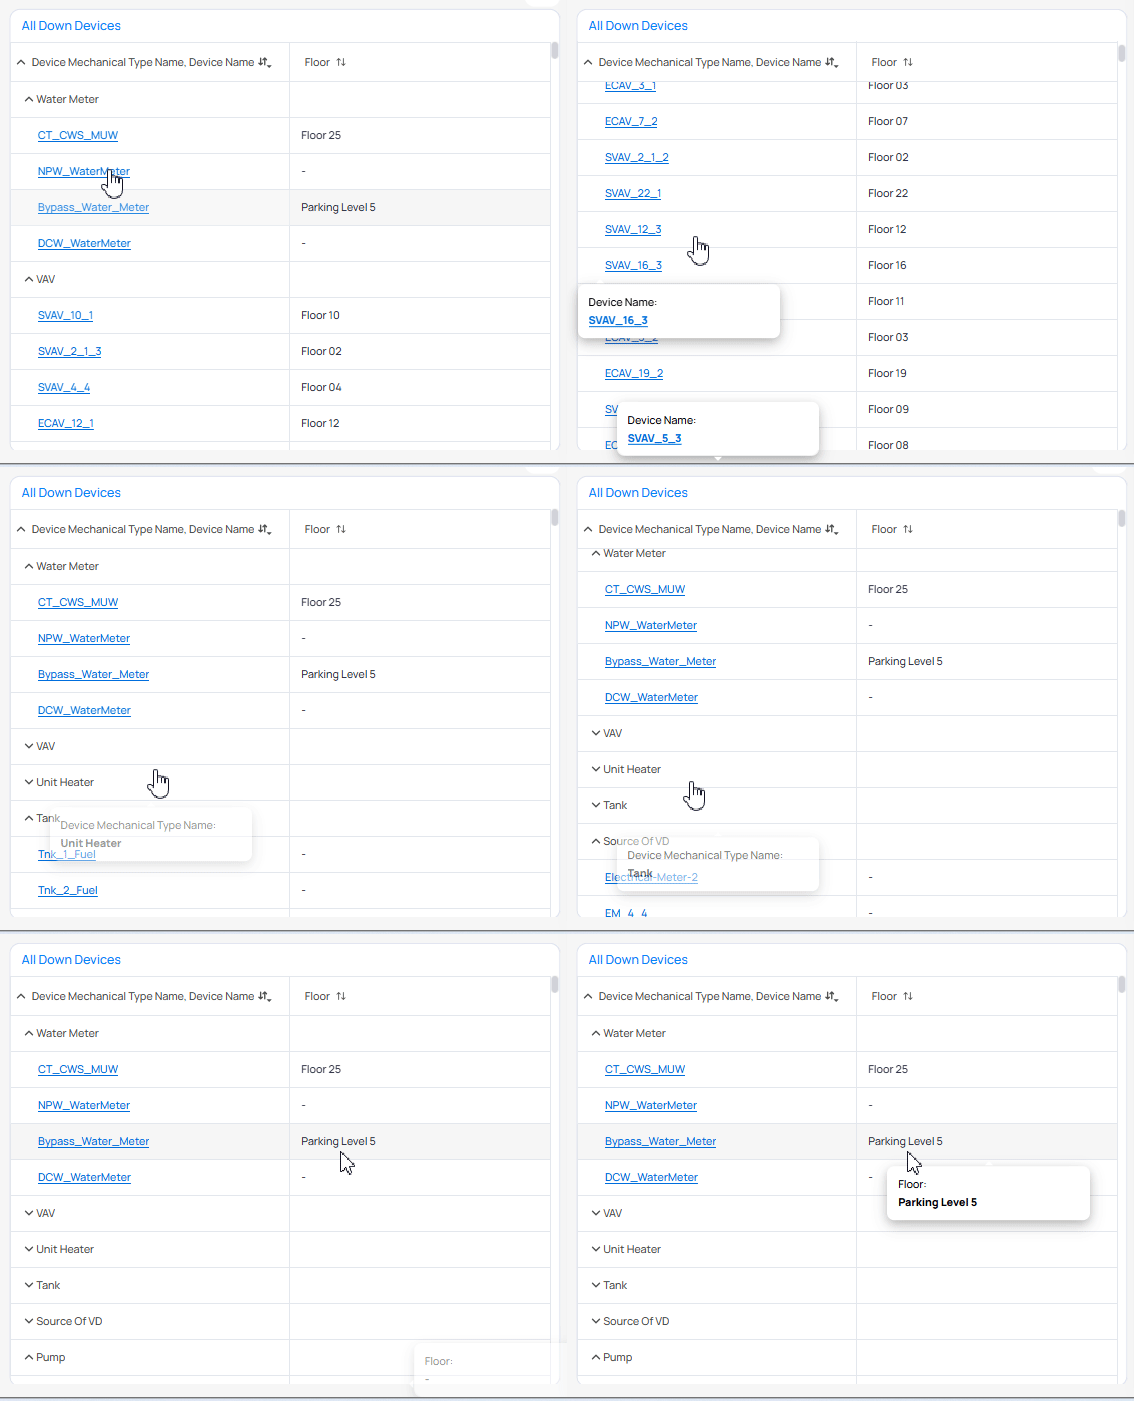
        Create a table that lists every down device by name and links to its device page. When the count is high, you can drill down without leaving the dashboard.

        Building BI offers three table types: Raw, Pivot, and Aggregated. For collapsible device counts, use a [Pivot table](/products/building-bi/reference/chart-types#table-pivot). See also [Table types](/products/building-bi/concepts/choosing-visualizations#table-types).
        <Steps>
          <Step title="Add the pivot table">
            Drag a `Table Pivot` onto the canvas. Select `Point Time Series Last Value Aggregated`.
          </Step>

          <Step title="Filter to down devices">
            Filter on `cur_status` with `in` and `down`, as in the earlier widgets.
          </Step>

          <Step title="Build the hierarchy">
            Pivot charts have Hierarchies, Pivoted Columns, Values, and Adjunct Metrics. For this dashboard, use only **Hierarchy** and **Adjunct Metrics**.

            In **Hierarchy**, add `Device Mechanical Type Name`, then `device_name`. You could use `area_name` instead if you want to group by floor.
          </Step>

          <Step title="Add floor context">
            Add an adjunct metric for `area_name` so each row shows the floor name.
          </Step>

          <Step title="Rename columns and add URLs">
            In `Style`, rename the hierarchy columns to `Device Type` and `Device Name`.

            Open the `Device Name` tab. In the **URLs** section, enable URLs and apply `Device URL`. Each device name becomes a link to its device page. See [Table widget sections](/products/building-bi/reference/chart-styling-options#table-widget-sections).
          </Step>
        </Steps>
      </TutorialStep>

      <TutorialStep tutorialId="bbi-first-dashboard" id="final-styling" number="7" title="Add a title and finish the layout" stepIds="enable,create-dashboard,card-widget,number-target,bar-chart,line-chart,pivot-table,final-styling">
        <Frame caption="">
          <img src="https://mintcdn.com/kodelabs/qpy9KTqZYAZmFRi5/images/kode-os/building-bi/bbi-tutorial-final-layout.png?fit=max&auto=format&n=qpy9KTqZYAZmFRi5&q=85&s=0d9f62282095323088f399399caaeaff" alt="Completed Down Devices dashboard with a title, Number (Target), bar chart, line chart, and pivot table" width="1825" height="1179" data-path="images/kode-os/building-bi/bbi-tutorial-final-layout.png" />
        </Frame>

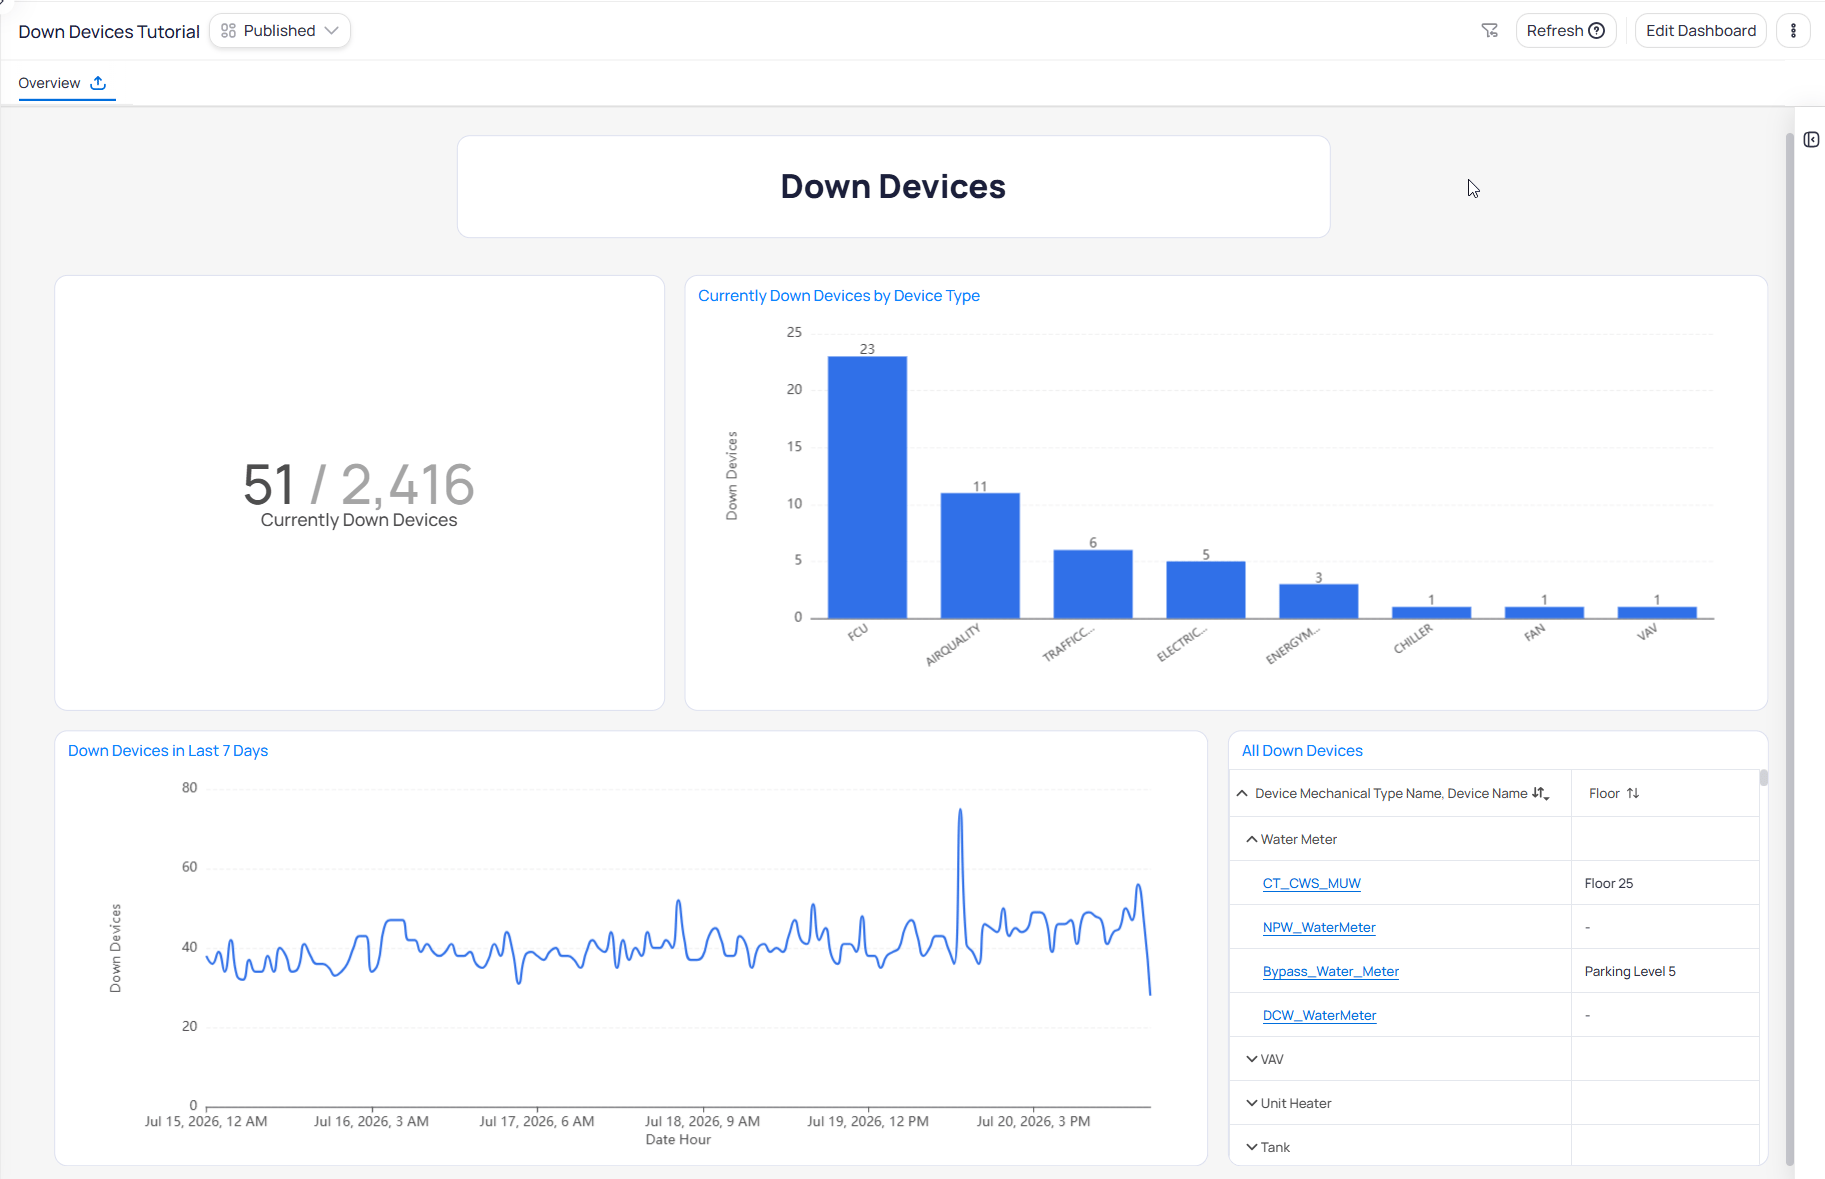
        Add a [Text](/products/building-bi/reference/chart-types#text) widget for the dashboard title, then arrange the canvas.

        <Steps>
          <Step title="Add a title">
            Add a text widget. Type `Down Devices`, set the text to title size, and place it in the top center of the dashboard.
          </Step>

          <Step title="Style the text">
            You can edit text styling in two places: the `Style` tab in chart configuration, or by selecting the text inside the widget. Selecting the text opens an inline editor for font size, weight, and alignment. For more styling options across widgets, see [Widget customization](/products/building-bi/widget-customization).

            <Frame caption="Inline text editor when you select text in the widget">
              <img src="https://mintcdn.com/kodelabs/qpy9KTqZYAZmFRi5/images/kode-os/building-bi/bbi-tutorial-text-widget-editor.png?fit=max&auto=format&n=qpy9KTqZYAZmFRi5&q=85&s=7812a917fa57dea5ddc9c32df6794ab4" alt="Text widget on the canvas with selected Down Devices text and the inline formatting toolbar" width="732" height="204" data-path="images/kode-os/building-bi/bbi-tutorial-text-widget-editor.png" />
            </Frame>
          </Step>

          <Step title="Arrange the widgets">
            Drag and resize widgets until the layout matches the completed dashboard above.
          </Step>
        </Steps>
      </TutorialStep>
    </div>
  </div>
</div>

## What you built

You created a building-level Down Devices dashboard with a Number (Target) widget, a bar chart by device type, a seven-day line chart, and a pivot table with links to each device.

## Related reading

<CardGroup cols={2}>
  <Card title="Choosing visualizations" icon="chart-column" href="/products/building-bi/concepts/choosing-visualizations" arrow={true}>
    Match chart types to the question you need to answer.
  </Card>

  <Card title="How filtering works" icon="filter" href="/products/building-bi/concepts/how-filtering-works" arrow={true}>
    Learn how filters interact across widgets and pages.
  </Card>

  <Card title="Chart types" icon="bar-chart-3" href="/products/building-bi/reference/chart-types" arrow={true}>
    Look up Setup requirements for every widget type.
  </Card>

  <Card title="Filter options" icon="list-filter" href="/products/building-bi/reference/filter-options" arrow={true}>
    Review operators, scopes, and filter configuration fields.
  </Card>
</CardGroup>

## Next steps

<CardGroup cols={2}>
  <Card title="Dashboards" icon="layout-dashboard" href="/products/building-bi/dashboards" arrow={true}>
    Learn dashboard editing, filters, and collaboration workflows.
  </Card>

  <Card title="Widget customization" icon="palette" href="/products/building-bi/widget-customization" arrow={true}>
    Style widgets, apply defaults, manage palettes, and go deeper on layout.
  </Card>

  <Card title="Data sources" icon="database" href="/products/building-bi/data-sources" arrow={true}>
    Connect dashboards to live building data from Cloud BMS.
  </Card>
</CardGroup>
