> ## Documentation Index
> Fetch the complete documentation index at: https://documentation.kodelabs.com/llms.txt
> Use this file to discover all available pages before exploring further.
# Chart types
> Lookup Setup requirements for every Building BI widget and chart type available from the Chart List.
Use [Dashboards](/products/building-bi/dashboards#add-widgets-and-charts) to add a chart to a dashboard. The widget/chart types available from the **Chart List** in dashboard edit mode are listed here. Each type has its own Setup requirements (see [Chart Setup Parameters](/products/building-bi/reference/chart-setup-parameters)) and a Style panel that varies by type (see [Chart Styling Options](/products/building-bi/reference/chart-styling-options)). Add a chart by dragging it onto the canvas or double-clicking it in the Chart List. For choosing a suitable visual, see [Choosing the Right Visualization](/products/building-bi/concepts/choosing-visualizations).
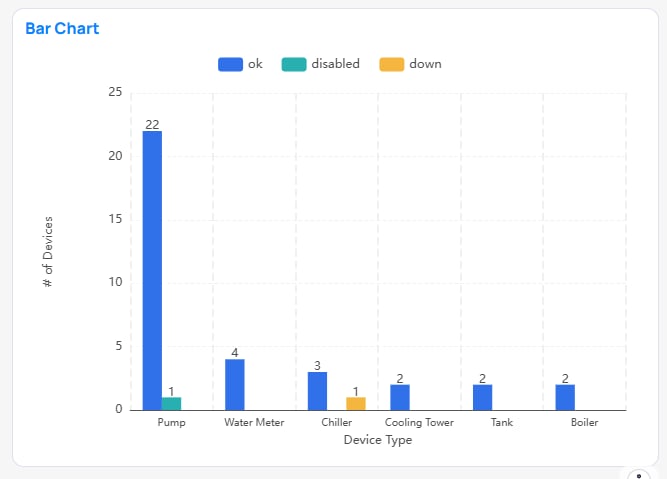
## Bar
Vertical bars comparing values between categories.
 | Parameter | Description | Required? |
| ----------------------------- | ------------------------------------------------------------------------------------------------------------------------------------------------------------------------------------------------------------------------------------------------------------------------------- | --------- |
| X-Axis & Y-Axis | The primary dimensions for the data. You can add multiple X-Axis dimensions that by default create additional subdivisions of the X-Axis. The Drill Down & Expand All toggles interact with additional X-Axis. | Yes |
| Drill Down | If you have multiple X-Axis dimensions Drill Down separates different dimensions into a hierarchy that are all compared against the Y-Axis dimension. Ex. AHU Run Hours per building, enabling drill down you can drill down into one building to see AHU Run Hours per floor. | No |
| Expand All | If you have multiple X-Axis dimensions Expand All merges the dimensions into many subdivisions. Ex. AHU Run Hours per Building & Floor. | No |
| Legend (Breakdown Categories) | Splits/categorizes information into adjacent bars per X-Axis dimension. (e.g. total energy usage broken down by floor). See [Chart Styling Options](/products/building-bi/reference/chart-styling-options) to adjust spacing and colors. | No |
| Y-Axis Limits | Dynamically adjusts min/max boundaries to change the visual scale of the bars. **Overrides the Style-tab Min/Max Range** (see [Chart Styling Options](/products/building-bi/reference/chart-styling-options)). | No |
| Filters & Top N Filters | Restricts the data shown or keeps only the highest performers. See [Filter Options](/products/building-bi/reference/filter-options). | No |
| Sort Order | Organizes the chart by a column's values and ranks order of impact. | No |
| Data Refresh Interval | How often the chart queries new data. Best practice: choose the **longest** acceptable interval to optimize load times. | Yes |
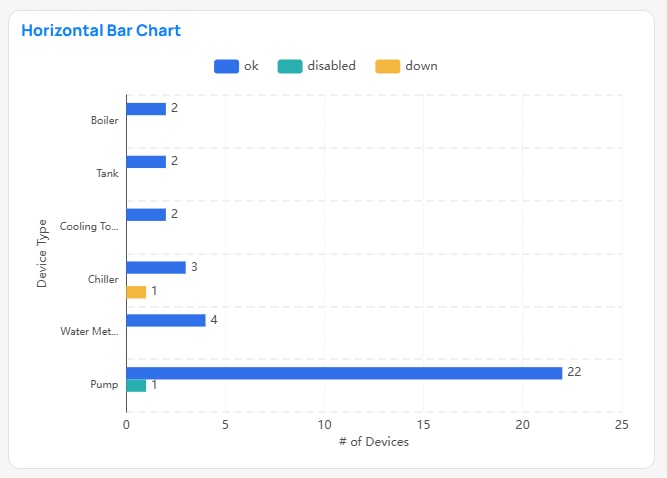
## Horizontal Bar
Horizontal bars comparing values between categories.
| Parameter | Description | Required? |
| ----------------------------- | ------------------------------------------------------------------------------------------------------------------------------------------------------------------------------------------------------------------------------------------------------------------------------- | --------- |
| X-Axis & Y-Axis | The primary dimensions for the data. You can add multiple X-Axis dimensions that by default create additional subdivisions of the X-Axis. The Drill Down & Expand All toggles interact with additional X-Axis. | Yes |
| Drill Down | If you have multiple X-Axis dimensions Drill Down separates different dimensions into a hierarchy that are all compared against the Y-Axis dimension. Ex. AHU Run Hours per building, enabling drill down you can drill down into one building to see AHU Run Hours per floor. | No |
| Expand All | If you have multiple X-Axis dimensions Expand All merges the dimensions into many subdivisions. Ex. AHU Run Hours per Building & Floor. | No |
| Legend (Breakdown Categories) | Splits/categorizes information into adjacent bars per X-Axis dimension. (e.g. total energy usage broken down by floor). See [Chart Styling Options](/products/building-bi/reference/chart-styling-options) to adjust spacing and colors. | No |
| Y-Axis Limits | Dynamically adjusts min/max boundaries to change the visual scale of the bars. **Overrides the Style-tab Min/Max Range** (see [Chart Styling Options](/products/building-bi/reference/chart-styling-options)). | No |
| Filters & Top N Filters | Restricts the data shown or keeps only the highest performers. See [Filter Options](/products/building-bi/reference/filter-options). | No |
| Sort Order | Organizes the chart by a column's values and ranks order of impact. | No |
| Data Refresh Interval | How often the chart queries new data. Best practice: choose the **longest** acceptable interval to optimize load times. | Yes |
## Horizontal Bar
Horizontal bars comparing values between categories.
 | Parameter | Description | Required? |
| ----------------------------- | ------------------------------------------------------------------------------------------------------------------------------------------------------------------------------------------------------------------------------------------------------------------------------- | --------- |
| X-Axis & Y-Axis | The primary dimensions for the data. You can add multiple Y-Axis dimensions that by default create additional subdivisions of the Y-Axis. The Drill Down & Expand All toggles interact with additional Y-Axis. | Yes |
| Drill Down | If you have multiple Y-Axis dimensions Drill Down separates different dimensions into a hierarchy that are all compared against the X-Axis dimension. Ex. AHU Run Hours per building, enabling drill down you can drill down into one building to see AHU Run Hours per floor. | No |
| Expand All | If you have multiple Y-Axis dimensions Expand All merges the dimensions into many subdivisions. Ex. AHU Run Hours per Building & Floor. | No |
| Legend (Breakdown Categories) | Splits/categorizes information into adjacent bars per Y-Axis dimension. (e.g. total energy usage broken down by floor). See [Chart Styling Options](/products/building-bi/reference/chart-styling-options) to adjust spacing and colors. | No |
| X-Axis Limits | Dynamically adjusts min/max boundaries to change the visual scale of the bars. **Overrides the Style-tab Min/Max Range** (see [Chart Styling Options](/products/building-bi/reference/chart-styling-options)). | No |
| Filters & Top N Filters | Restricts the data shown or keeps only the highest performers. See [Filter Options](/products/building-bi/reference/filter-options). | No |
| Sort Order | Organizes the chart by a column's values and ranks order of impact. | No |
| Data Refresh Interval | How often the chart queries new data. Best practice: choose the **longest** acceptable interval to optimize load times. | Yes |
## Stacked Bar
Vertical bars comparing values between categories. Legend categories stack values rather than creating new bars.
| Parameter | Description | Required? |
| ----------------------------- | ------------------------------------------------------------------------------------------------------------------------------------------------------------------------------------------------------------------------------------------------------------------------------- | --------- |
| X-Axis & Y-Axis | The primary dimensions for the data. You can add multiple Y-Axis dimensions that by default create additional subdivisions of the Y-Axis. The Drill Down & Expand All toggles interact with additional Y-Axis. | Yes |
| Drill Down | If you have multiple Y-Axis dimensions Drill Down separates different dimensions into a hierarchy that are all compared against the X-Axis dimension. Ex. AHU Run Hours per building, enabling drill down you can drill down into one building to see AHU Run Hours per floor. | No |
| Expand All | If you have multiple Y-Axis dimensions Expand All merges the dimensions into many subdivisions. Ex. AHU Run Hours per Building & Floor. | No |
| Legend (Breakdown Categories) | Splits/categorizes information into adjacent bars per Y-Axis dimension. (e.g. total energy usage broken down by floor). See [Chart Styling Options](/products/building-bi/reference/chart-styling-options) to adjust spacing and colors. | No |
| X-Axis Limits | Dynamically adjusts min/max boundaries to change the visual scale of the bars. **Overrides the Style-tab Min/Max Range** (see [Chart Styling Options](/products/building-bi/reference/chart-styling-options)). | No |
| Filters & Top N Filters | Restricts the data shown or keeps only the highest performers. See [Filter Options](/products/building-bi/reference/filter-options). | No |
| Sort Order | Organizes the chart by a column's values and ranks order of impact. | No |
| Data Refresh Interval | How often the chart queries new data. Best practice: choose the **longest** acceptable interval to optimize load times. | Yes |
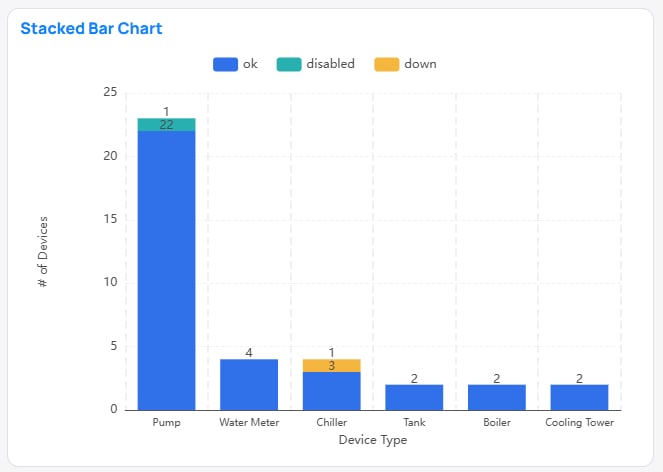
## Stacked Bar
Vertical bars comparing values between categories. Legend categories stack values rather than creating new bars.
 | Parameter | Description | Required? |
| ----------------------------- | ------------------------------------------------------------------------------------------------------------------------------------------------------------------------------------------------------------------------------------------------------------------------------- | --------- |
| X-Axis & Y-Axis | The primary dimensions for the data. You can add multiple X-Axis dimensions that by default create additional subdivisions of the X-Axis. The Drill Down & Expand All toggles interact with additional X-Axis. | Yes |
| Drill Down | If you have multiple X-Axis dimensions Drill Down separates different dimensions into a hierarchy that are all compared against the Y-Axis dimension. Ex. AHU Run Hours per building, enabling drill down you can drill down into one building to see AHU Run Hours per floor. | No |
| Expand All | If you have multiple X-Axis dimensions Expand All merges the dimensions into many subdivisions. Ex. AHU Run Hours per Building & Floor. | No |
| Legend (Breakdown Categories) | Splits/categorizes information into *stackedbars* per X-Axis dimension. (e.g. total energy usage broken down by floor). See [Chart Styling Options](/products/building-bi/reference/chart-styling-options) to adjust spacing and colors. | No |
| Y-Axis Limits | Dynamically adjusts min/max boundaries to change the visual scale of the bars. **Overrides the Style-tab Min/Max Range** (see [Chart Styling Options](/products/building-bi/reference/chart-styling-options)). | No |
| Filters & Top N Filters | Restricts the data shown or keeps only the highest performers. See [Filter Options](/products/building-bi/reference/filter-options). | No |
| Sort Order | Organizes the chart by a column's values and ranks order of impact. | No |
| Data Refresh Interval | How often the chart queries new data. Best practice: choose the **longest** acceptable interval to optimize load times. | Yes |
## Horizontal Stacked Bar
Horizontal bars comparing values between categories. Legend categories stack values rather than creating new bars.
| Parameter | Description | Required? |
| ----------------------------- | ------------------------------------------------------------------------------------------------------------------------------------------------------------------------------------------------------------------------------------------------------------------------------- | --------- |
| X-Axis & Y-Axis | The primary dimensions for the data. You can add multiple X-Axis dimensions that by default create additional subdivisions of the X-Axis. The Drill Down & Expand All toggles interact with additional X-Axis. | Yes |
| Drill Down | If you have multiple X-Axis dimensions Drill Down separates different dimensions into a hierarchy that are all compared against the Y-Axis dimension. Ex. AHU Run Hours per building, enabling drill down you can drill down into one building to see AHU Run Hours per floor. | No |
| Expand All | If you have multiple X-Axis dimensions Expand All merges the dimensions into many subdivisions. Ex. AHU Run Hours per Building & Floor. | No |
| Legend (Breakdown Categories) | Splits/categorizes information into *stackedbars* per X-Axis dimension. (e.g. total energy usage broken down by floor). See [Chart Styling Options](/products/building-bi/reference/chart-styling-options) to adjust spacing and colors. | No |
| Y-Axis Limits | Dynamically adjusts min/max boundaries to change the visual scale of the bars. **Overrides the Style-tab Min/Max Range** (see [Chart Styling Options](/products/building-bi/reference/chart-styling-options)). | No |
| Filters & Top N Filters | Restricts the data shown or keeps only the highest performers. See [Filter Options](/products/building-bi/reference/filter-options). | No |
| Sort Order | Organizes the chart by a column's values and ranks order of impact. | No |
| Data Refresh Interval | How often the chart queries new data. Best practice: choose the **longest** acceptable interval to optimize load times. | Yes |
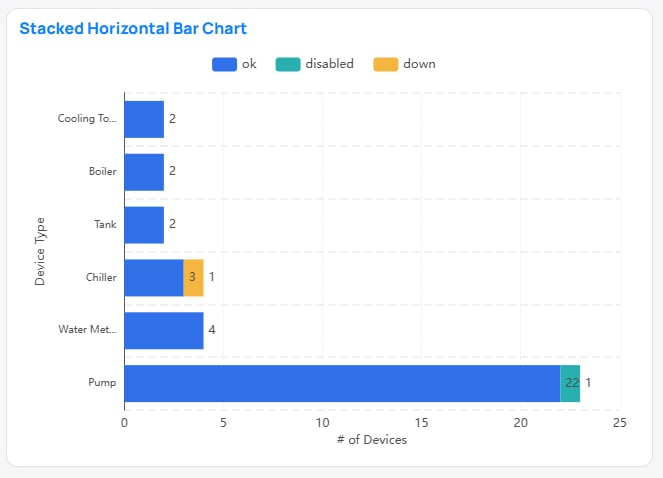
## Horizontal Stacked Bar
Horizontal bars comparing values between categories. Legend categories stack values rather than creating new bars.
 | Parameter | Description | Required? |
| ----------------------------- | ------------------------------------------------------------------------------------------------------------------------------------------------------------------------------------------------------------------------------------------------------------------------------- | --------- |
| X-Axis & Y-Axis | The primary dimensions for the data. You can add multiple Y-Axis dimensions that by default create additional subdivisions of the Y-Axis. The Drill Down & Expand All toggles interact with additional Y-Axis. | Yes |
| Drill Down | If you have multiple Y-Axis dimensions Drill Down separates different dimensions into a hierarchy that are all compared against the X-Axis dimension. Ex. AHU Run Hours per building, enabling drill down you can drill down into one building to see AHU Run Hours per floor. | No |
| Expand All | If you have multiple Y-Axis dimensions Expand All merges the dimensions into many subdivisions. Ex. AHU Run Hours per Building & Floor. | No |
| Legend (Breakdown Categories) | Splits/categorizes information into *stackedbars* per Y-Axis dimension. (e.g. total energy usage broken down by floor). See [Chart Styling Options](/products/building-bi/reference/chart-styling-options) to adjust spacing and colors. | No |
| X-Axis Limits | Dynamically adjusts min/max boundaries to change the visual scale of the bars. **Overrides the Style-tab Min/Max Range** (see [Chart Styling Options](/products/building-bi/reference/chart-styling-options)). | No |
| Filters & Top N Filters | Restricts the data shown or keeps only the highest performers. See [Filter Options](/products/building-bi/reference/filter-options). | No |
| Sort Order | Organizes the chart by a column's values and ranks order of impact. | No |
| Data Refresh Interval | How often the chart queries new data. Best practice: choose the **longest** acceptable interval to optimize load times. | Yes |
## Combo
Line(s) and Bar(s) over a shared axis. Bar(s) uses Primary Y-Axis and Line(s) Secondary Y-Axis
| Parameter | Description | Required? |
| ----------------------------- | ------------------------------------------------------------------------------------------------------------------------------------------------------------------------------------------------------------------------------------------------------------------------------- | --------- |
| X-Axis & Y-Axis | The primary dimensions for the data. You can add multiple Y-Axis dimensions that by default create additional subdivisions of the Y-Axis. The Drill Down & Expand All toggles interact with additional Y-Axis. | Yes |
| Drill Down | If you have multiple Y-Axis dimensions Drill Down separates different dimensions into a hierarchy that are all compared against the X-Axis dimension. Ex. AHU Run Hours per building, enabling drill down you can drill down into one building to see AHU Run Hours per floor. | No |
| Expand All | If you have multiple Y-Axis dimensions Expand All merges the dimensions into many subdivisions. Ex. AHU Run Hours per Building & Floor. | No |
| Legend (Breakdown Categories) | Splits/categorizes information into *stackedbars* per Y-Axis dimension. (e.g. total energy usage broken down by floor). See [Chart Styling Options](/products/building-bi/reference/chart-styling-options) to adjust spacing and colors. | No |
| X-Axis Limits | Dynamically adjusts min/max boundaries to change the visual scale of the bars. **Overrides the Style-tab Min/Max Range** (see [Chart Styling Options](/products/building-bi/reference/chart-styling-options)). | No |
| Filters & Top N Filters | Restricts the data shown or keeps only the highest performers. See [Filter Options](/products/building-bi/reference/filter-options). | No |
| Sort Order | Organizes the chart by a column's values and ranks order of impact. | No |
| Data Refresh Interval | How often the chart queries new data. Best practice: choose the **longest** acceptable interval to optimize load times. | Yes |
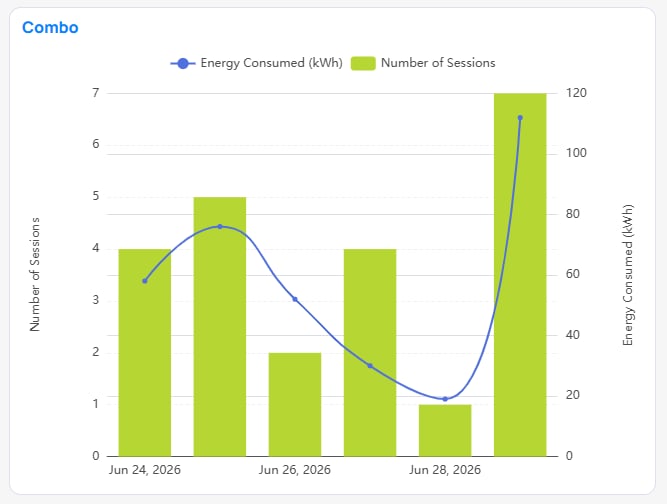
## Combo
Line(s) and Bar(s) over a shared axis. Bar(s) uses Primary Y-Axis and Line(s) Secondary Y-Axis
 | Parameter | Description | Required? |
| ----------------------------- | ------------------------------------------------------------------------------------------------------------------------------------------------------------------------------------------------------------------------------------------------------------------------------- | ------------------------------------------------------------ |
| X-Axis & Y-Axis | The primary dimensions for the data. The Y-Axis creates the bar. You can add multiple X-Axis dimensions that by default create additional subdivisions of the X-Axis. The Drill Down & Expand All toggles interact with additional X-Axis. | Yes — Either a Y-Axis and/or a Secondary Y-Axis is required. |
| Secondary Y-Axis | Additional Y-Axis for line values. Axis appears on right-hand side of chart. | Yes — Either a Y-Axis and/or a Secondary Y-Axis is required. |
| Drill Down | If you have multiple Y-Axis dimensions Drill Down separates different dimensions into a hierarchy that are all compared against the X-Axis dimension. Ex. AHU Run Hours per building, enabling drill down you can drill down into one building to see AHU Run Hours per floor. | No |
| Expand All | If you have multiple Y-Axis dimensions Expand All merges the dimensions into many subdivisions. Ex. AHU Run Hours per Building & Floor. | No |
| Legend (Breakdown Categories) | Splits/categorizes information into *adjacentbars* per Y-Axis dimension by default. (Ex, total energy usage broken down by floor). See [Chart Styling Options](/products/building-bi/reference/chart-styling-options) to make bars stack, adjust spacing, and colors. | No |
| X-Axis Limits | Dynamically adjusts min/max boundaries to change the visual scale of the bars. **Overrides the Style-tab Min/Max Range** (see [Chart Styling Options](/products/building-bi/reference/chart-styling-options)). | No |
| Filters & Top N Filters | Restricts the data shown or keeps only the highest performers. See [Filter Options](/products/building-bi/reference/filter-options). | No — BigQuery metric require a DateTime filter |
| Sort Order | Organizes the chart by a column's values and ranks order of impact. | No |
| Data Refresh Interval | How often the chart queries new data. Best practice: choose the **longest** acceptable interval to optimize load times. | Yes |
## Line
Line(s) over a continuous axis. Multiple lines will overlay on Y-Axis.
| Parameter | Description | Required? |
| ----------------------------- | ------------------------------------------------------------------------------------------------------------------------------------------------------------------------------------------------------------------------------------------------------------------------------- | ------------------------------------------------------------ |
| X-Axis & Y-Axis | The primary dimensions for the data. The Y-Axis creates the bar. You can add multiple X-Axis dimensions that by default create additional subdivisions of the X-Axis. The Drill Down & Expand All toggles interact with additional X-Axis. | Yes — Either a Y-Axis and/or a Secondary Y-Axis is required. |
| Secondary Y-Axis | Additional Y-Axis for line values. Axis appears on right-hand side of chart. | Yes — Either a Y-Axis and/or a Secondary Y-Axis is required. |
| Drill Down | If you have multiple Y-Axis dimensions Drill Down separates different dimensions into a hierarchy that are all compared against the X-Axis dimension. Ex. AHU Run Hours per building, enabling drill down you can drill down into one building to see AHU Run Hours per floor. | No |
| Expand All | If you have multiple Y-Axis dimensions Expand All merges the dimensions into many subdivisions. Ex. AHU Run Hours per Building & Floor. | No |
| Legend (Breakdown Categories) | Splits/categorizes information into *adjacentbars* per Y-Axis dimension by default. (Ex, total energy usage broken down by floor). See [Chart Styling Options](/products/building-bi/reference/chart-styling-options) to make bars stack, adjust spacing, and colors. | No |
| X-Axis Limits | Dynamically adjusts min/max boundaries to change the visual scale of the bars. **Overrides the Style-tab Min/Max Range** (see [Chart Styling Options](/products/building-bi/reference/chart-styling-options)). | No |
| Filters & Top N Filters | Restricts the data shown or keeps only the highest performers. See [Filter Options](/products/building-bi/reference/filter-options). | No — BigQuery metric require a DateTime filter |
| Sort Order | Organizes the chart by a column's values and ranks order of impact. | No |
| Data Refresh Interval | How often the chart queries new data. Best practice: choose the **longest** acceptable interval to optimize load times. | Yes |
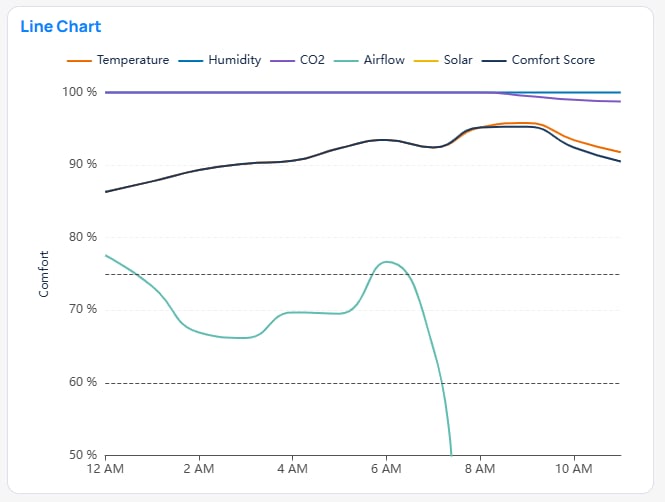
## Line
Line(s) over a continuous axis. Multiple lines will overlay on Y-Axis.
 | Parameter | Description |
| ----------------------- | ------------------------------------------------------------------------------------------------------------------------------------------------------------------------------------------------------------------------------------------------------------------------------------ |
| X-Axis & Y-Axis | The primary dimensions for the data. You can add multiple X-Axis dimensions and Y-Axis that by default create additional subdivisions. The Drill Down & Expand All toggles interact with the additional axes. |
| Drill Down | Toggle. If you have multiple axis dimensions Drill Down separates different dimensions into a hierarchy that are all compared against the other dimension. Ex. AHU Run Hours per building, enabling drill down you can drill down into one building to see AHU Run Hours per floor. |
| Expand All | Toggle. If you have multiple axis dimensions Expand All merges the dimensions into many subdivisions. Ex. AHU Run Hours per Building & Floor. |
| Legend | Splits/categorizes information into multiple Lines per X-Axis dimension. (e.g. total energy usage broken down by floor). |
| Y-Axis Limits | Dynamically adjusts min/max boundaries to change the visual scale of the bars. **Overrides the Style-tab Min/Max Range** (see [Chart Styling Options](/products/building-bi/reference/chart-styling-options)). |
| Filters & Top N Filters | Restricts the data shown or keeps only the highest performers. See [Filter Options](/products/building-bi/reference/filter-options). |
| Sort Order | Organizes the chart by a column's values and ranks order of impact. |
| Data Refresh Interval | How often the chart queries new data. Best practice: choose the **longest** acceptable interval to optimize load times. |
## Line Area
Line(s) over a continuous axis. Multiple lines will overlay on Y-Axis with the area under the line being shaded.
| Parameter | Description |
| ----------------------- | ------------------------------------------------------------------------------------------------------------------------------------------------------------------------------------------------------------------------------------------------------------------------------------ |
| X-Axis & Y-Axis | The primary dimensions for the data. You can add multiple X-Axis dimensions and Y-Axis that by default create additional subdivisions. The Drill Down & Expand All toggles interact with the additional axes. |
| Drill Down | Toggle. If you have multiple axis dimensions Drill Down separates different dimensions into a hierarchy that are all compared against the other dimension. Ex. AHU Run Hours per building, enabling drill down you can drill down into one building to see AHU Run Hours per floor. |
| Expand All | Toggle. If you have multiple axis dimensions Expand All merges the dimensions into many subdivisions. Ex. AHU Run Hours per Building & Floor. |
| Legend | Splits/categorizes information into multiple Lines per X-Axis dimension. (e.g. total energy usage broken down by floor). |
| Y-Axis Limits | Dynamically adjusts min/max boundaries to change the visual scale of the bars. **Overrides the Style-tab Min/Max Range** (see [Chart Styling Options](/products/building-bi/reference/chart-styling-options)). |
| Filters & Top N Filters | Restricts the data shown or keeps only the highest performers. See [Filter Options](/products/building-bi/reference/filter-options). |
| Sort Order | Organizes the chart by a column's values and ranks order of impact. |
| Data Refresh Interval | How often the chart queries new data. Best practice: choose the **longest** acceptable interval to optimize load times. |
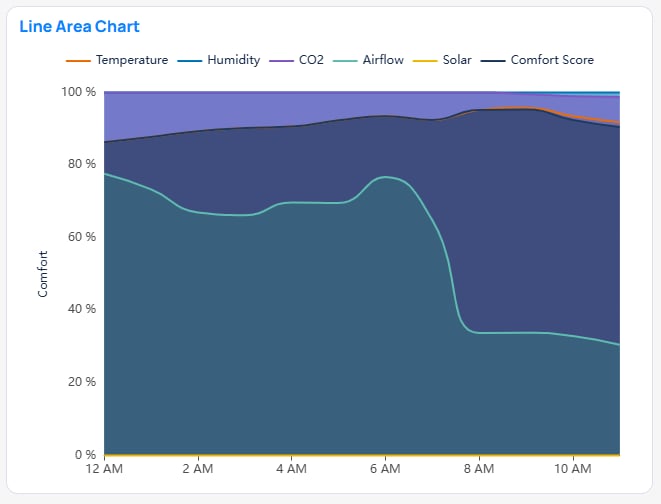
## Line Area
Line(s) over a continuous axis. Multiple lines will overlay on Y-Axis with the area under the line being shaded.
 | Parameter | Description |
| ----------------------- | ------------------------------------------------------------------------------------------------------------------------------------------------------------------------------------------------------------------------------------------------------------------------------------ |
| X-Axis & Y-Axis | The primary dimensions for the data. You can add multiple X-Axis dimensions and Y-Axis that by default create additional subdivisions. The Drill Down & Expand All toggles interact with the additional axes. |
| Drill Down | Toggle. If you have multiple axis dimensions Drill Down separates different dimensions into a hierarchy that are all compared against the other dimension. Ex. AHU Run Hours per building, enabling drill down you can drill down into one building to see AHU Run Hours per floor. |
| Expand All | Toggle. If you have multiple axis dimensions Expand All merges the dimensions into many subdivisions. Ex. AHU Run Hours per Building & Floor. |
| Legend | Splits/categorizes information into multiple Lines per X-Axis dimension. (e.g. total energy usage broken down by floor). |
| Y-Axis Limits | Dynamically adjusts min/max boundaries to change the visual scale of the bars. **Overrides the Style-tab Min/Max Range** (see [Chart Styling Options](/products/building-bi/reference/chart-styling-options)). |
| Filters & Top N Filters | Restricts the data shown or keeps only the highest performers. See [Filter Options](/products/building-bi/reference/filter-options). |
| Sort Order | Organizes the chart by a column's values and ranks order of impact. |
| Data Refresh Interval | How often the chart queries new data. Best practice: choose the **longest** acceptable interval to optimize load times. |
## Stacked Line
Line(s) over a continuous axis. Multiple lines will *sum* on Y-Axis.
| Parameter | Description |
| ----------------------- | ------------------------------------------------------------------------------------------------------------------------------------------------------------------------------------------------------------------------------------------------------------------------------------ |
| X-Axis & Y-Axis | The primary dimensions for the data. You can add multiple X-Axis dimensions and Y-Axis that by default create additional subdivisions. The Drill Down & Expand All toggles interact with the additional axes. |
| Drill Down | Toggle. If you have multiple axis dimensions Drill Down separates different dimensions into a hierarchy that are all compared against the other dimension. Ex. AHU Run Hours per building, enabling drill down you can drill down into one building to see AHU Run Hours per floor. |
| Expand All | Toggle. If you have multiple axis dimensions Expand All merges the dimensions into many subdivisions. Ex. AHU Run Hours per Building & Floor. |
| Legend | Splits/categorizes information into multiple Lines per X-Axis dimension. (e.g. total energy usage broken down by floor). |
| Y-Axis Limits | Dynamically adjusts min/max boundaries to change the visual scale of the bars. **Overrides the Style-tab Min/Max Range** (see [Chart Styling Options](/products/building-bi/reference/chart-styling-options)). |
| Filters & Top N Filters | Restricts the data shown or keeps only the highest performers. See [Filter Options](/products/building-bi/reference/filter-options). |
| Sort Order | Organizes the chart by a column's values and ranks order of impact. |
| Data Refresh Interval | How often the chart queries new data. Best practice: choose the **longest** acceptable interval to optimize load times. |
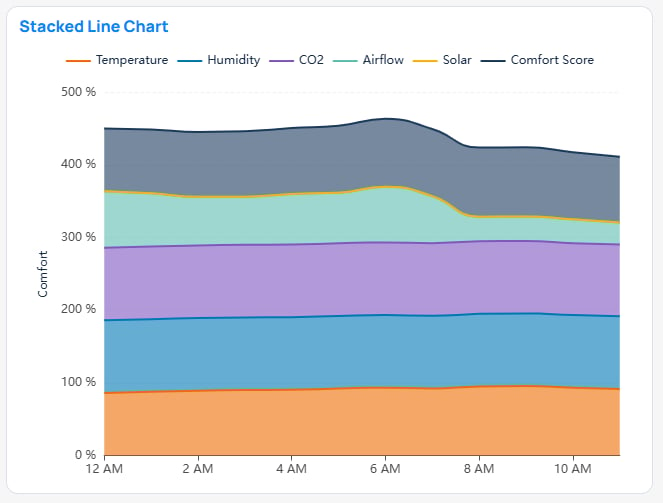
## Stacked Line
Line(s) over a continuous axis. Multiple lines will *sum* on Y-Axis.
 | Parameter | Description |
| ----------------------- | ------------------------------------------------------------------------------------------------------------------------------------------------------------------------------------------------------------------------------------------------------------------------------------ |
| X-Axis & Y-Axis | The primary dimensions for the data. You can add multiple X-Axis dimensions and Y-Axis that by default create additional subdivisions. The Drill Down & Expand All toggles interact with the additional axes. |
| Drill Down | Toggle. If you have multiple axis dimensions Drill Down separates different dimensions into a hierarchy that are all compared against the other dimension. Ex. AHU Run Hours per building, enabling drill down you can drill down into one building to see AHU Run Hours per floor. |
| Expand All | Toggle. If you have multiple axis dimensions Expand All merges the dimensions into many subdivisions. Ex. AHU Run Hours per Building & Floor. |
| Legend | Splits/categorizes information into multiple Lines per X-Axis dimension. (e.g. total energy usage broken down by floor). |
| Y-Axis Limits | Dynamically adjusts min/max boundaries to change the visual scale of the bars. **Overrides the Style-tab Min/Max Range** (see [Chart Styling Options](/products/building-bi/reference/chart-styling-options)). |
| Filters & Top N Filters | Restricts the data shown or keeps only the highest performers. See [Filter Options](/products/building-bi/reference/filter-options). |
| Sort Order | Organizes the chart by a column's values and ranks order of impact. |
| Data Refresh Interval | How often the chart queries new data. Best practice: choose the **longest** acceptable interval to optimize load times. |
## Pie
Proportional Categorical slices of total value
| Parameter | Description |
| ----------------------- | ------------------------------------------------------------------------------------------------------------------------------------------------------------------------------------------------------------------------------------------------------------------------------------ |
| X-Axis & Y-Axis | The primary dimensions for the data. You can add multiple X-Axis dimensions and Y-Axis that by default create additional subdivisions. The Drill Down & Expand All toggles interact with the additional axes. |
| Drill Down | Toggle. If you have multiple axis dimensions Drill Down separates different dimensions into a hierarchy that are all compared against the other dimension. Ex. AHU Run Hours per building, enabling drill down you can drill down into one building to see AHU Run Hours per floor. |
| Expand All | Toggle. If you have multiple axis dimensions Expand All merges the dimensions into many subdivisions. Ex. AHU Run Hours per Building & Floor. |
| Legend | Splits/categorizes information into multiple Lines per X-Axis dimension. (e.g. total energy usage broken down by floor). |
| Y-Axis Limits | Dynamically adjusts min/max boundaries to change the visual scale of the bars. **Overrides the Style-tab Min/Max Range** (see [Chart Styling Options](/products/building-bi/reference/chart-styling-options)). |
| Filters & Top N Filters | Restricts the data shown or keeps only the highest performers. See [Filter Options](/products/building-bi/reference/filter-options). |
| Sort Order | Organizes the chart by a column's values and ranks order of impact. |
| Data Refresh Interval | How often the chart queries new data. Best practice: choose the **longest** acceptable interval to optimize load times. |
## Pie
Proportional Categorical slices of total value
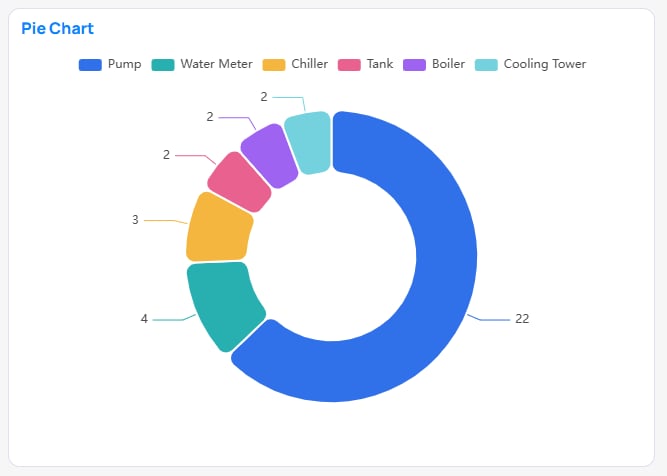 | Parameter | Description |
| ----------------------- | -------------------------------------------------------------------------------------------------------------------------------------------------------------------------------------------------------------------------------------------------------------------------------------------- |
| Legend | The primary dimensions for the data. Splits the *Value* in slices of the sum *Value*. Multiple columns can be added to the legend to create a hierarchy that by default create subdivisions. The Drill Down & Expand All toggles interact with additional hierarchies. |
| Drill Down | If you have multiple legends Drill Down separates different dimensions into a hierarchy that shows one dimension at a time. Ex. Count of occupied VAV per area vs unoccupied, enabling drill down you can drill down into one area to see all of the device names and their occupied status. |
| Expand All | If you have multiple dimensions Expand All merges the dimensions into many subdivisions. Ex. Count of occupied vs unoccupied VAVs per Building & Floor. |
| Value | The metric total that is subdivided by the legend. Must be numeric. |
| Filters & Top N Filters | Restricts the data shown or keeps only the highest performers. See [Filter Options](/products/building-bi/reference/filter-options). |
| Sort Order | Organizes the chart by a column's values and ranks order of impact. |
| Data Refresh Interval | How often the chart queries new data. Best practice: choose the **longest** acceptable interval to optimize load times. |
## Sunburst
Nested proportional Categorical slices of total value
| Parameter | Description |
| ----------------------- | -------------------------------------------------------------------------------------------------------------------------------------------------------------------------------------------------------------------------------------------------------------------------------------------- |
| Legend | The primary dimensions for the data. Splits the *Value* in slices of the sum *Value*. Multiple columns can be added to the legend to create a hierarchy that by default create subdivisions. The Drill Down & Expand All toggles interact with additional hierarchies. |
| Drill Down | If you have multiple legends Drill Down separates different dimensions into a hierarchy that shows one dimension at a time. Ex. Count of occupied VAV per area vs unoccupied, enabling drill down you can drill down into one area to see all of the device names and their occupied status. |
| Expand All | If you have multiple dimensions Expand All merges the dimensions into many subdivisions. Ex. Count of occupied vs unoccupied VAVs per Building & Floor. |
| Value | The metric total that is subdivided by the legend. Must be numeric. |
| Filters & Top N Filters | Restricts the data shown or keeps only the highest performers. See [Filter Options](/products/building-bi/reference/filter-options). |
| Sort Order | Organizes the chart by a column's values and ranks order of impact. |
| Data Refresh Interval | How often the chart queries new data. Best practice: choose the **longest** acceptable interval to optimize load times. |
## Sunburst
Nested proportional Categorical slices of total value
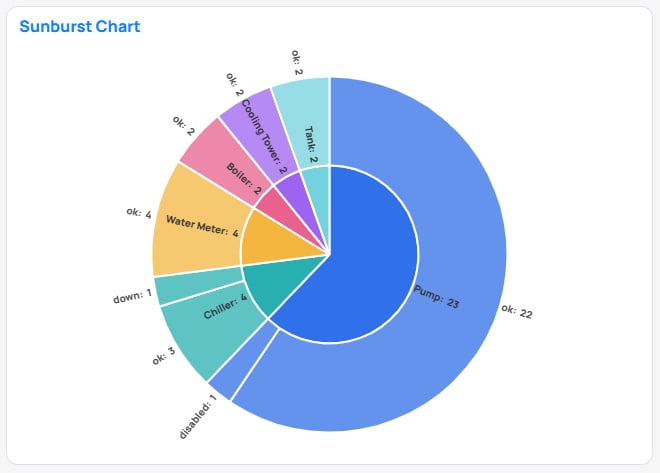 | Parameter | Description |
| ----------------------- | -------------------------------------------------------------------------------------------------------------------------------------------------------------------------------------------------- |
| Legend | The primary dimensions for the data. Splits the *Value* in slices of the sum *Value*. Multiple columns can be added to the legend to create a hierarchy whose rings are nested within one another. |
| Value | The metric total that is subdivided by the legend. Must be numeric. |
| Filters & Top N Filters | Restricts the data shown or keeps only the highest performers. See [Filter Options](/products/building-bi/reference/filter-options). |
| Sort Order | Organizes the chart by a column's values and ranks order of impact. |
| Data Refresh Interval | How often the chart queries new data. Best practice: choose the **longest** acceptable interval to optimize load times. |
## Multi-row Card
A compact display of many value(s) or label(s) across a dimension. Similar to a Table.
| Parameter | Description |
| ----------------------- | -------------------------------------------------------------------------------------------------------------------------------------------------------------------------------------------------- |
| Legend | The primary dimensions for the data. Splits the *Value* in slices of the sum *Value*. Multiple columns can be added to the legend to create a hierarchy whose rings are nested within one another. |
| Value | The metric total that is subdivided by the legend. Must be numeric. |
| Filters & Top N Filters | Restricts the data shown or keeps only the highest performers. See [Filter Options](/products/building-bi/reference/filter-options). |
| Sort Order | Organizes the chart by a column's values and ranks order of impact. |
| Data Refresh Interval | How often the chart queries new data. Best practice: choose the **longest** acceptable interval to optimize load times. |
## Multi-row Card
A compact display of many value(s) or label(s) across a dimension. Similar to a Table.
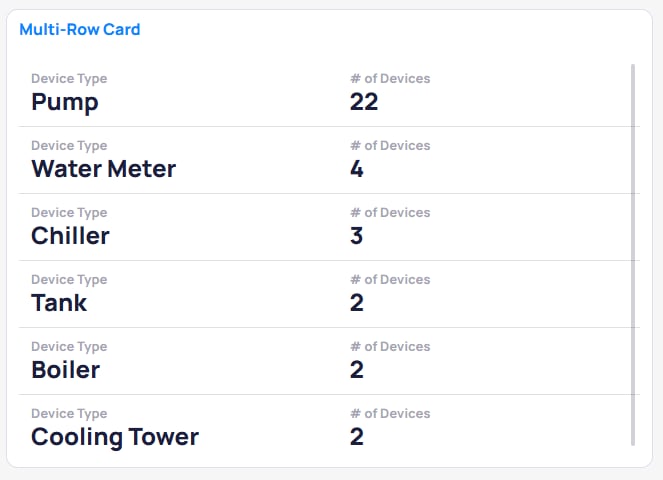 | Parameter | Description |
| ----------------------- | --------------------------------------------------------------------------------------------------------------------------------------------- |
| Category | The primary dimensions for the data. Splits the *Value* in sections for each degree of the dimension. You can have multiple category columns. |
| Value | The metric total that is split across each category |
| Filters & Top N Filters | Restricts the data shown or keeps only the highest performers. See [Filter Options](/products/building-bi/reference/filter-options). |
| Sort Order | Organizes the chart by a column's values and ranks order of impact. |
| Data Refresh Interval | How often the chart queries new data. Best practice: choose the **longest** acceptable interval to optimize load times. |
## Card
A compact display of one value or label.
| Parameter | Description |
| ----------------------- | --------------------------------------------------------------------------------------------------------------------------------------------- |
| Category | The primary dimensions for the data. Splits the *Value* in sections for each degree of the dimension. You can have multiple category columns. |
| Value | The metric total that is split across each category |
| Filters & Top N Filters | Restricts the data shown or keeps only the highest performers. See [Filter Options](/products/building-bi/reference/filter-options). |
| Sort Order | Organizes the chart by a column's values and ranks order of impact. |
| Data Refresh Interval | How often the chart queries new data. Best practice: choose the **longest** acceptable interval to optimize load times. |
## Card
A compact display of one value or label.
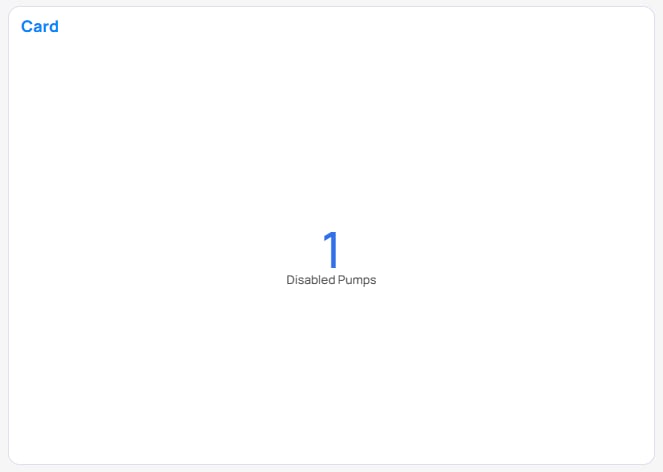 | Parameter | Description |
| --------------------- | ----------------------------------------------------------------------------------------------------------------------- |
| Value | The data displayed in the card |
| Filters | Restricts the data shown. See [Filter Options](/products/building-bi/reference/filter-options). |
| Data Refresh Interval | How often the chart queries new data. Best practice: choose the **longest** acceptable interval to optimize load times. |
## Number (Period)
A compact display of one metric value compared to the same metric value from a previous time period.
| Parameter | Description |
| --------------------- | ----------------------------------------------------------------------------------------------------------------------- |
| Value | The data displayed in the card |
| Filters | Restricts the data shown. See [Filter Options](/products/building-bi/reference/filter-options). |
| Data Refresh Interval | How often the chart queries new data. Best practice: choose the **longest** acceptable interval to optimize load times. |
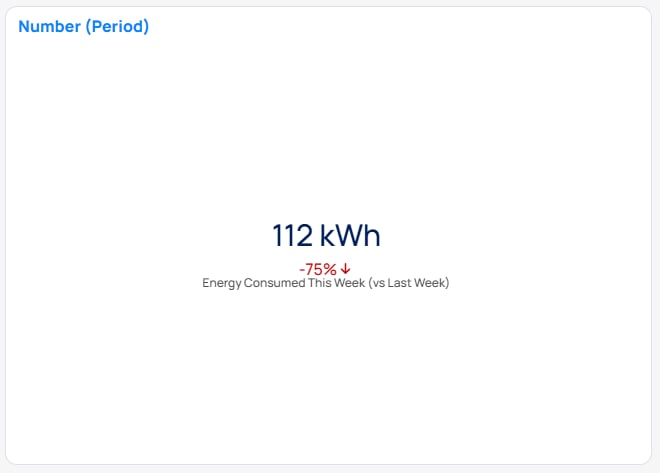
## Number (Period)
A compact display of one metric value compared to the same metric value from a previous time period.
 | Parameter | Description |
| --------------------- | -------------------------------------------------------------------------------------------------------------------------- |
| Value | The metric displayed in the card |
| Date Filter | Must be Date or DateTime type. Sets the metric time period that is the basis of comparison. |
| Comparison Method | Dropdown for scale of time periods in comparison. Options: Day over Day, Week over Week, Month over Month, Year over Year. |
| Filters | Restricts the *Value* shown. See [Filter Options](/products/building-bi/reference/filter-options). |
| Data Refresh Interval | How often the chart queries new data. Best practice: choose the **longest** acceptable interval to optimize load times. |
## Number (Target)
A compact display of one metric value being compared to a target metric value. Values are concatenated with a '/'.
| Parameter | Description |
| --------------------- | -------------------------------------------------------------------------------------------------------------------------- |
| Value | The metric displayed in the card |
| Date Filter | Must be Date or DateTime type. Sets the metric time period that is the basis of comparison. |
| Comparison Method | Dropdown for scale of time periods in comparison. Options: Day over Day, Week over Week, Month over Month, Year over Year. |
| Filters | Restricts the *Value* shown. See [Filter Options](/products/building-bi/reference/filter-options). |
| Data Refresh Interval | How often the chart queries new data. Best practice: choose the **longest** acceptable interval to optimize load times. |
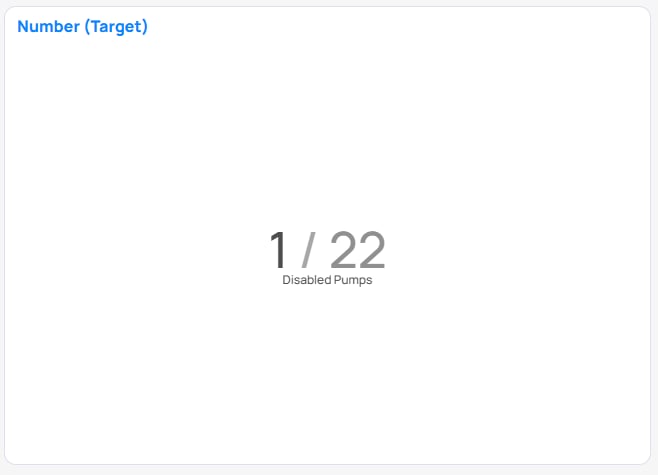
## Number (Target)
A compact display of one metric value being compared to a target metric value. Values are concatenated with a '/'.
 | Parameter | Description |
| --------------------- | ----------------------------------------------------------------------------------------------------------------------- |
| Value | The metric displayed in the card |
| Filters | Restricts the Value shown. See [Filter Options](/products/building-bi/reference/filter-options). |
| Target Value | The metric displayed in the card that is the target for the *Value* |
| Target Filters | Restricts the Target *Value* shown. See [Filter Options](/products/building-bi/reference/filter-options). |
| Data Refresh Interval | How often the chart queries new data. Best practice: choose the **longest** acceptable interval to optimize load times. |
## Number with Trend-line
A compact display of one metric value with a miniature visualization of that metric value trend across a time period.
| Parameter | Description |
| --------------------- | ----------------------------------------------------------------------------------------------------------------------- |
| Value | The metric displayed in the card |
| Filters | Restricts the Value shown. See [Filter Options](/products/building-bi/reference/filter-options). |
| Target Value | The metric displayed in the card that is the target for the *Value* |
| Target Filters | Restricts the Target *Value* shown. See [Filter Options](/products/building-bi/reference/filter-options). |
| Data Refresh Interval | How often the chart queries new data. Best practice: choose the **longest** acceptable interval to optimize load times. |
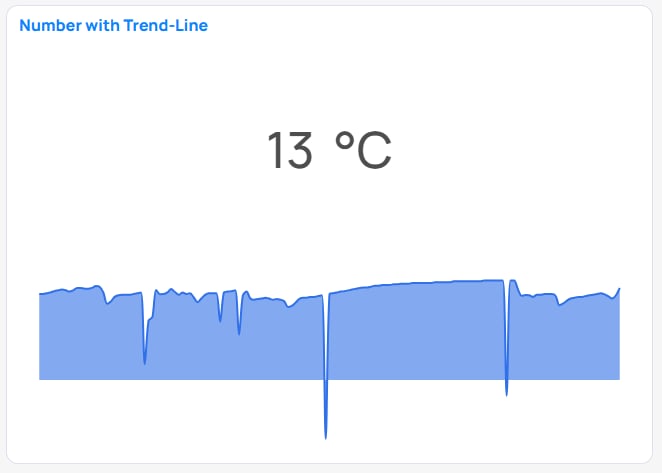
## Number with Trend-line
A compact display of one metric value with a miniature visualization of that metric value trend across a time period.
 | Parameter | Description |
| --------------------- | ----------------------------------------------------------------------------------------------------------------------- |
| Value | The metric displayed in the card |
| Trend Axis | Must be Date or DateTime type. Displays value over that time period. |
| Filters | Restricts the Value shown. See [Filter Options](/products/building-bi/reference/filter-options). |
| Data Refresh Interval | How often the chart queries new data. Best practice: choose the **longest** acceptable interval to optimize load times. |
## Heatmap
A grid that encodes a value as cell color across two axes (X and Y) — the color is the "third axis."
| Parameter | Description |
| --------------------- | ----------------------------------------------------------------------------------------------------------------------- |
| Value | The metric displayed in the card |
| Trend Axis | Must be Date or DateTime type. Displays value over that time period. |
| Filters | Restricts the Value shown. See [Filter Options](/products/building-bi/reference/filter-options). |
| Data Refresh Interval | How often the chart queries new data. Best practice: choose the **longest** acceptable interval to optimize load times. |
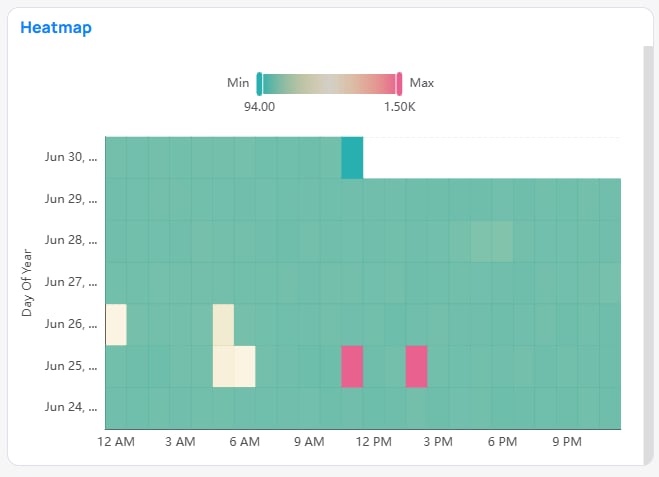
## Heatmap
A grid that encodes a value as cell color across two axes (X and Y) — the color is the "third axis."
 | Parameter | Description |
| ------------------------- | ---------------------------------------------------------------------------------------------------------------------------------------------------------------------------------------------------------------- |
| X-Axis & Y-Axis Dimension | The primary dimensions for the data. Creates a matrix across both axes, one cell per combination. You can use multiple columns for both the X-Axis and Y-Axis dimensions. |
| Value | The metric displayed for each dimension represented by color. See [Chart Styling Options](/products/building-bi/reference/chart-styling-options) and [Color Tools](/products/building-bi/reference/color-tools). |
| Filters & Top N Filters | Restricts the data shown or keeps only the highest performers. See [Filter Options](/products/building-bi/reference/filter-options). |
| Sort Order | Organizes the chart by a column's values and ranks order of impact. |
| Data Refresh Interval | How often the chart queries new data. Best practice: choose the **longest** acceptable interval to optimize load times. |
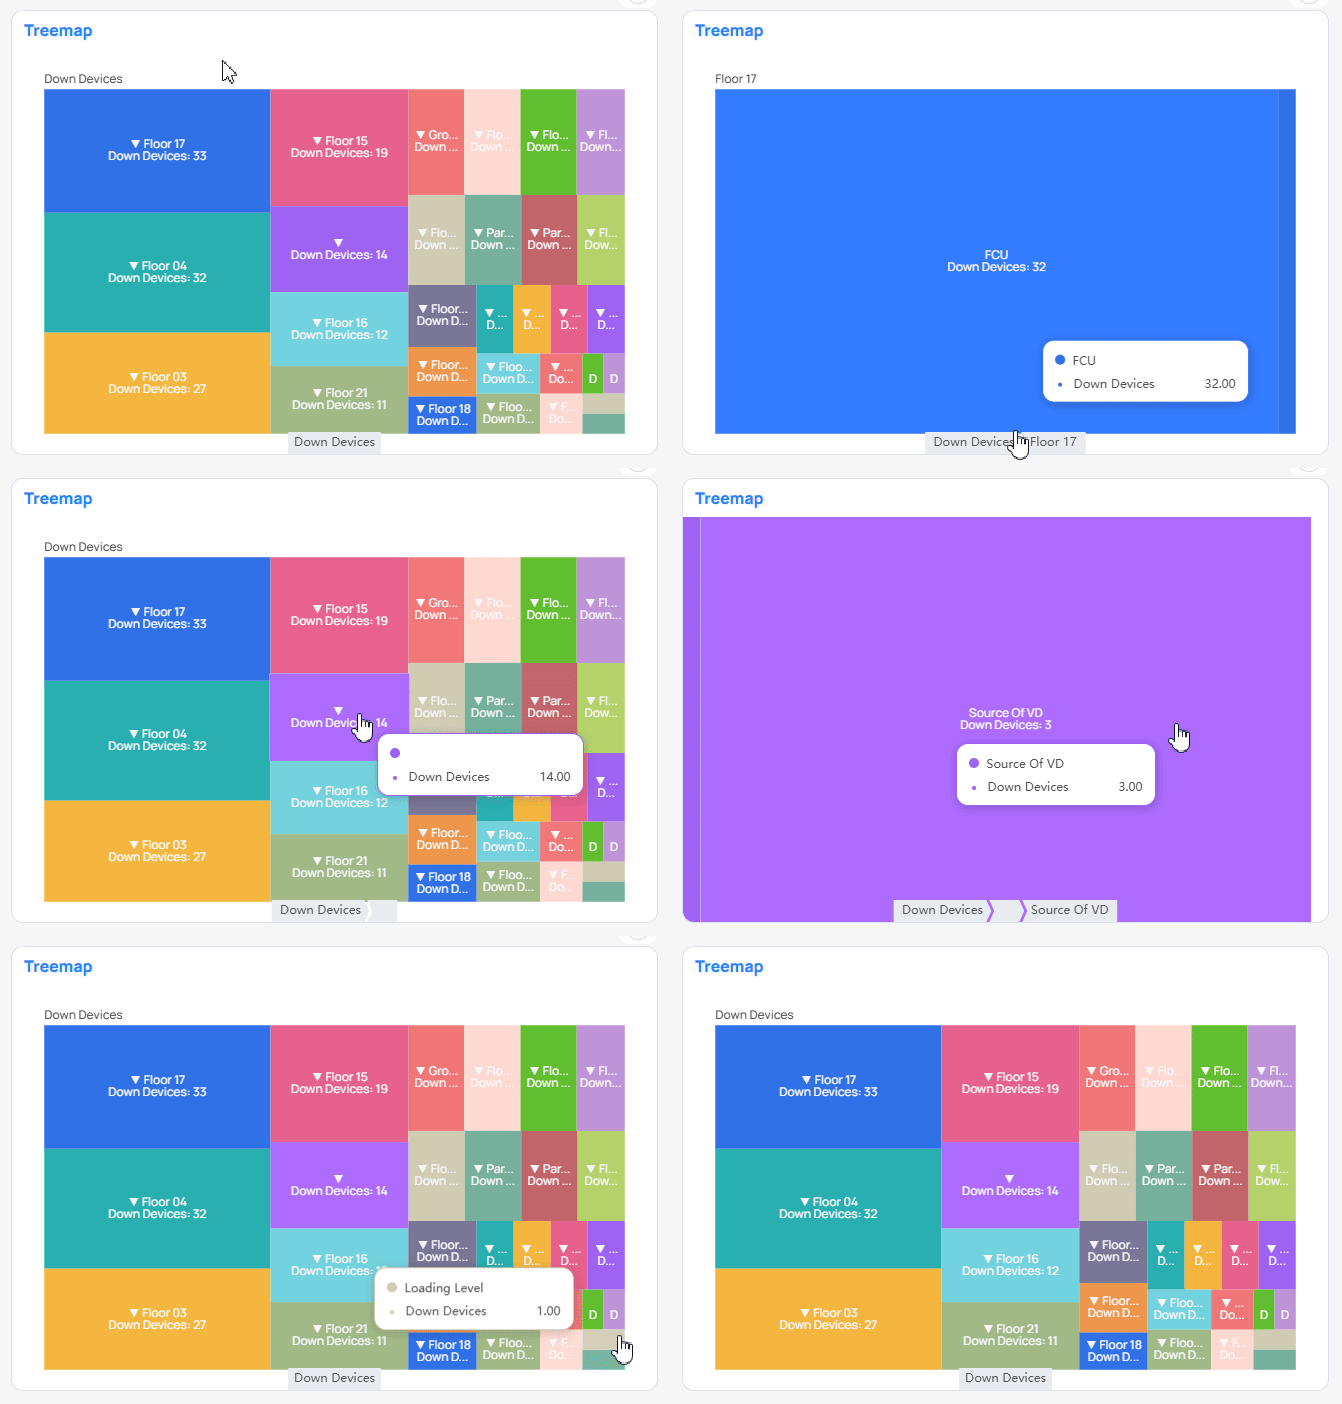
## Treemap
Nested rectangles sized by value; click an area to break it into smaller divisions.
| Parameter | Description |
| ------------------------- | ---------------------------------------------------------------------------------------------------------------------------------------------------------------------------------------------------------------- |
| X-Axis & Y-Axis Dimension | The primary dimensions for the data. Creates a matrix across both axes, one cell per combination. You can use multiple columns for both the X-Axis and Y-Axis dimensions. |
| Value | The metric displayed for each dimension represented by color. See [Chart Styling Options](/products/building-bi/reference/chart-styling-options) and [Color Tools](/products/building-bi/reference/color-tools). |
| Filters & Top N Filters | Restricts the data shown or keeps only the highest performers. See [Filter Options](/products/building-bi/reference/filter-options). |
| Sort Order | Organizes the chart by a column's values and ranks order of impact. |
| Data Refresh Interval | How often the chart queries new data. Best practice: choose the **longest** acceptable interval to optimize load times. |
## Treemap
Nested rectangles sized by value; click an area to break it into smaller divisions.
 | Parameter | Description |
| ----------------------- | ---------------------------------------------------------------------------------------------------------------------------------------------------------------------------------------------------------------------------------------------------------------------------------------------------------------------------------- |
| Hierarchy | The primary dimensions for the data. Creates the categorization that splits the area. Multiple *Hierarchy* values are required to allow for the drill-down properties of the TreeMap. Edit the properties of the drill-down see the style tab (see [Chart Styling Options](/products/building-bi/reference/chart-styling-options)) |
| Value | The metric displayed for each dimension represented by area. |
| Additional Value | Additional metrics that are displayed on a chart tooltip or data labels. Many metrics can be added. |
| Filters & Top N Filters | Restricts the data shown or keeps only the highest performers. See [Filter Options](/products/building-bi/reference/filter-options). |
| Sort Order | Organizes the chart by a column's values and ranks order of impact. |
| Data Refresh Interval | How often the chart queries new data. Best practice: choose the **longest** acceptable interval to optimize load times. |
## Scatter
Data points plotted against two **metric** axes — used to reveal correlation or clustering between two measures.
| Parameter | Description |
| ----------------------- | ---------------------------------------------------------------------------------------------------------------------------------------------------------------------------------------------------------------------------------------------------------------------------------------------------------------------------------- |
| Hierarchy | The primary dimensions for the data. Creates the categorization that splits the area. Multiple *Hierarchy* values are required to allow for the drill-down properties of the TreeMap. Edit the properties of the drill-down see the style tab (see [Chart Styling Options](/products/building-bi/reference/chart-styling-options)) |
| Value | The metric displayed for each dimension represented by area. |
| Additional Value | Additional metrics that are displayed on a chart tooltip or data labels. Many metrics can be added. |
| Filters & Top N Filters | Restricts the data shown or keeps only the highest performers. See [Filter Options](/products/building-bi/reference/filter-options). |
| Sort Order | Organizes the chart by a column's values and ranks order of impact. |
| Data Refresh Interval | How often the chart queries new data. Best practice: choose the **longest** acceptable interval to optimize load times. |
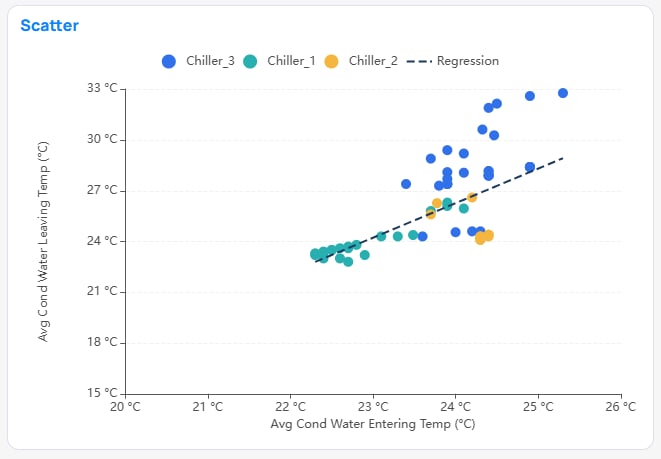
## Scatter
Data points plotted against two **metric** axes — used to reveal correlation or clustering between two measures.
 | Parameter | Description | Required? |
| ----------------------- | ------------------------------------------------------------------------------------------------------------------------------------ | --------- |
| X-Axis & Y-Axis | The two metrics that position each point (e.g. a generator run's peak temperature vs. its runtime). | Yes |
| Category | The group being plotted (e.g. "generator runs"). Each row in the category becomes a point. | Yes |
| Legend | Splits the points into colored series (e.g. set the Legend to Device Name to separate each device's runs). | No |
| Filters & Top N Filters | Restricts the data shown or keeps only the highest performers. See [Filter Options](/products/building-bi/reference/filter-options). | No |
| Data Refresh Interval | How often the chart queries new data. Best practice: choose the **longest** acceptable interval to optimize load times. | Yes |
Scatter vs Advanced Scatter Standard Scatter plots two **metrics**. [Advanced Scatter](#advanced-scatter) plots two **dimensions** and sizes each symbol by a metric.
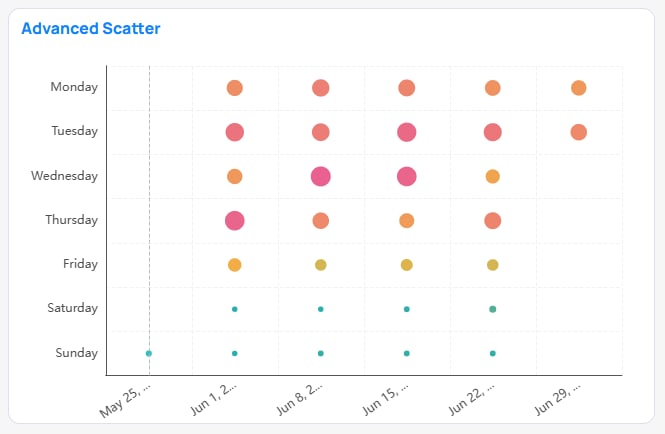
## Advanced Scatter
Array of data points whose axes are **dimensions** (not metrics, which is what distinguishes it from the standard [Scatter](#scatter)), with each symbol sized by a metric value. Useful for visualizing distribution across categorical breakdowns.
| Parameter | Description | Required? |
| ----------------------- | ------------------------------------------------------------------------------------------------------------------------------------ | --------- |
| X-Axis & Y-Axis | The two metrics that position each point (e.g. a generator run's peak temperature vs. its runtime). | Yes |
| Category | The group being plotted (e.g. "generator runs"). Each row in the category becomes a point. | Yes |
| Legend | Splits the points into colored series (e.g. set the Legend to Device Name to separate each device's runs). | No |
| Filters & Top N Filters | Restricts the data shown or keeps only the highest performers. See [Filter Options](/products/building-bi/reference/filter-options). | No |
| Data Refresh Interval | How often the chart queries new data. Best practice: choose the **longest** acceptable interval to optimize load times. | Yes |
Scatter vs Advanced Scatter Standard Scatter plots two **metrics**. [Advanced Scatter](#advanced-scatter) plots two **dimensions** and sizes each symbol by a metric.
## Advanced Scatter
Array of data points whose axes are **dimensions** (not metrics, which is what distinguishes it from the standard [Scatter](#scatter)), with each symbol sized by a metric value. Useful for visualizing distribution across categorical breakdowns.
 | Parameter | Description | Required? |
| ----------------------- | -------------------------------------------------------------------------------------------------------------------------------------------------------------------------------------------------------------------------------------------- | --------- |
| X-Axis | One or more **dimension** columns plotted on the X-Axis. Supports Single or Multiple X-Axis (set by the *Single Axis / Multiple Axis* toggle). | Yes |
| Y-Axis | One or more **dimension** columns plotted on the Y-Axis. | Yes |
| Metric | A single metric column whose values drive both the symbol rendering and symbol size. | Yes |
| Tooltips | One or more metric columns (with aggregate function) shown in the tooltip. | No |
| Filters & Top N Filters | Restricts the data shown or keeps only the highest performers. Filters set in chart configuration are always applied and cannot be unselected from the dashboard view. See [Filter Options](/products/building-bi/reference/filter-options). | No |
| Sort Order | Sort by the key column or by tooltip columns. See [Chart Setup Parameters](/products/building-bi/reference/chart-setup-parameters). | No |
| Data Refresh Interval | How often the chart queries new data. Best practice: choose the **longest** acceptable interval to optimize load times. | Yes |
## Boxplot
Visualizes the distribution (median, quartiles, and outliers) of numerical values on the Y-Axis across categorical X-Axis values.
| Parameter | Description | Required? |
| ----------------------- | -------------------------------------------------------------------------------------------------------------------------------------------------------------------------------------------------------------------------------------------- | --------- |
| X-Axis | One or more **dimension** columns plotted on the X-Axis. Supports Single or Multiple X-Axis (set by the *Single Axis / Multiple Axis* toggle). | Yes |
| Y-Axis | One or more **dimension** columns plotted on the Y-Axis. | Yes |
| Metric | A single metric column whose values drive both the symbol rendering and symbol size. | Yes |
| Tooltips | One or more metric columns (with aggregate function) shown in the tooltip. | No |
| Filters & Top N Filters | Restricts the data shown or keeps only the highest performers. Filters set in chart configuration are always applied and cannot be unselected from the dashboard view. See [Filter Options](/products/building-bi/reference/filter-options). | No |
| Sort Order | Sort by the key column or by tooltip columns. See [Chart Setup Parameters](/products/building-bi/reference/chart-setup-parameters). | No |
| Data Refresh Interval | How often the chart queries new data. Best practice: choose the **longest** acceptable interval to optimize load times. | Yes |
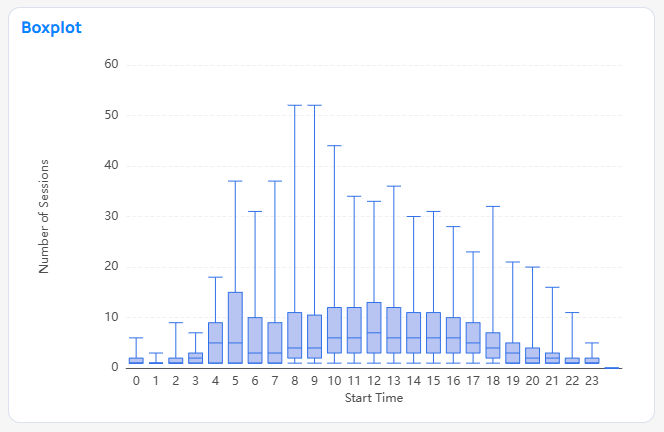
## Boxplot
Visualizes the distribution (median, quartiles, and outliers) of numerical values on the Y-Axis across categorical X-Axis values.
 | Parameter | Description |
| ----------------------- | ---------------------------------------------------------------------------------------------------------------------------------------------------------------------------------------- |
| Y-Axis | The numerical axis of what values you are trying to show the distribution of values. Ex. The distribution of FCU Air Temperature per floor. The Air Temperature would be the *Y-Axis*. |
| Distributed Across | The category whose values build the distribution graphic. Ex. The distribution of FCU Air Temperature per floor. The FCUs (likely their device names) would be the *Distributed Across*. |
| X-Axis | The categorical axis of what groups you are trying to show the distribution of values. Ex. The distribution of FCU Air Temperature per floor. The floor would be the *X-Axis*. |
| Filters & Top N Filters | Restricts the data shown or keeps only the highest performers. See [Filter Options](/products/building-bi/reference/filter-options). |
| Data Refresh Interval | How often the chart queries new data. Best practice: choose the **longest** acceptable interval to optimize load times. |
## Horizontal Boxplot
Horizontally visualizes the distribution of numerical values on a X-Axis along some categorical Y-Axis Values.
| Parameter | Description |
| ----------------------- | ---------------------------------------------------------------------------------------------------------------------------------------------------------------------------------------- |
| Y-Axis | The numerical axis of what values you are trying to show the distribution of values. Ex. The distribution of FCU Air Temperature per floor. The Air Temperature would be the *Y-Axis*. |
| Distributed Across | The category whose values build the distribution graphic. Ex. The distribution of FCU Air Temperature per floor. The FCUs (likely their device names) would be the *Distributed Across*. |
| X-Axis | The categorical axis of what groups you are trying to show the distribution of values. Ex. The distribution of FCU Air Temperature per floor. The floor would be the *X-Axis*. |
| Filters & Top N Filters | Restricts the data shown or keeps only the highest performers. See [Filter Options](/products/building-bi/reference/filter-options). |
| Data Refresh Interval | How often the chart queries new data. Best practice: choose the **longest** acceptable interval to optimize load times. |
## Horizontal Boxplot
Horizontally visualizes the distribution of numerical values on a X-Axis along some categorical Y-Axis Values.
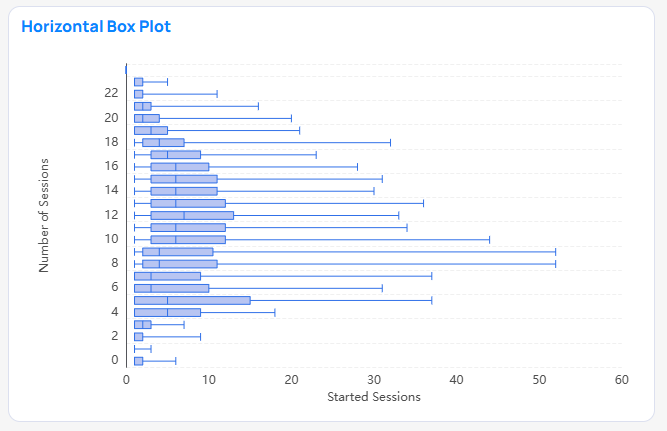 | Parameter | Description |
| ----------------------- | ---------------------------------------------------------------------------------------------------------------------------------------------------------------------------------------- |
| Y-Axis | The categorical axis of what groups you are trying to show the distribution of values. Ex. The distribution of FCU Air Temperature per floor. The floor would be the *Y-Axis*. |
| Distributed Across | The category whose values build the distribution graphic. Ex. The distribution of FCU Air Temperature per floor. The FCUs (likely their device names) would be the *Distributed Across*. |
| X-Axis | The numerical axis of what values you are trying to show the distribution of values. Ex. The distribution of FCU Air Temperature per floor. The Air Temperature would be the *X-Axis*. |
| Filters & Top N Filters | Restricts the data shown or keeps only the highest performers. See [Filter Options](/products/building-bi/reference/filter-options). |
| Data Refresh Interval | How often the chart queries new data. Best practice: choose the **longest** acceptable interval to optimize load times. |
## Gauge
A compact display of one metric value being compared to a target metric value. The proportion between the value and target value is visualized by a curved progress bar.
| Parameter | Description |
| ----------------------- | ---------------------------------------------------------------------------------------------------------------------------------------------------------------------------------------- |
| Y-Axis | The categorical axis of what groups you are trying to show the distribution of values. Ex. The distribution of FCU Air Temperature per floor. The floor would be the *Y-Axis*. |
| Distributed Across | The category whose values build the distribution graphic. Ex. The distribution of FCU Air Temperature per floor. The FCUs (likely their device names) would be the *Distributed Across*. |
| X-Axis | The numerical axis of what values you are trying to show the distribution of values. Ex. The distribution of FCU Air Temperature per floor. The Air Temperature would be the *X-Axis*. |
| Filters & Top N Filters | Restricts the data shown or keeps only the highest performers. See [Filter Options](/products/building-bi/reference/filter-options). |
| Data Refresh Interval | How often the chart queries new data. Best practice: choose the **longest** acceptable interval to optimize load times. |
## Gauge
A compact display of one metric value being compared to a target metric value. The proportion between the value and target value is visualized by a curved progress bar.
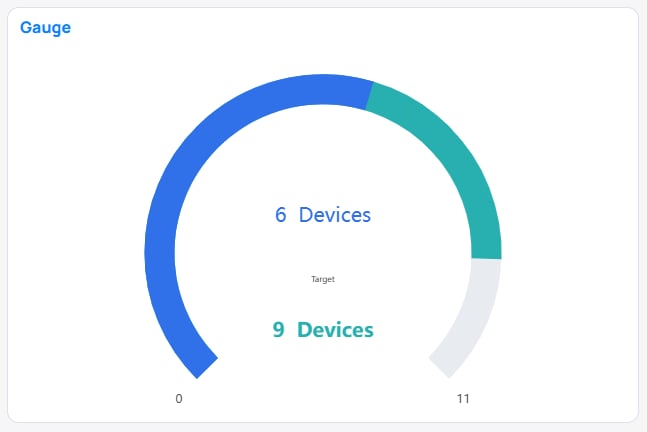 | Parameter | Description |
| ------------------------ | -------------------------------------------------------------------------------------------------------------------------------------------------------------------------------------------------------------------------------------------------------------------------------------------------------------- |
| Value | The metric displayed in the card |
| Target Value | The metric that is the limit of the gauge that is affected by the same *Filters* as *Value*. This parameter overrides any hardcoded min/max axis in the style settings (see [Chart Styling Options](/products/building-bi/reference/chart-styling-options)) |
| Filters | Restricts the data of the *Value* and *Target Value*. See [Filter Options](/products/building-bi/reference/filter-options). |
| Scale Upper/ Lower Limit | Metric values that are the minimum/maximum values of the gauge that is affected by its own *Scale Filters*, a detached filter from the *Value*. This parameter overrides any hardcoded min/max axis in the style settings (see [Chart Styling Options](/products/building-bi/reference/chart-styling-options)) |
| Scale Filter | Restricts the data of *Scale Upper/ Lower Limit*. See [Filter Options](/products/building-bi/reference/filter-options). |
| Data Refresh Interval | How often the chart queries new data. Best practice: choose the **longest** acceptable interval to optimize load times. |
## Table Raw
Rows and columns of raw values from the selected Building BI `Data Source`. See [Table types](/products/building-bi/concepts/choosing-visualizations#table-types).
| Parameter | Description |
| ------------------------ | -------------------------------------------------------------------------------------------------------------------------------------------------------------------------------------------------------------------------------------------------------------------------------------------------------------- |
| Value | The metric displayed in the card |
| Target Value | The metric that is the limit of the gauge that is affected by the same *Filters* as *Value*. This parameter overrides any hardcoded min/max axis in the style settings (see [Chart Styling Options](/products/building-bi/reference/chart-styling-options)) |
| Filters | Restricts the data of the *Value* and *Target Value*. See [Filter Options](/products/building-bi/reference/filter-options). |
| Scale Upper/ Lower Limit | Metric values that are the minimum/maximum values of the gauge that is affected by its own *Scale Filters*, a detached filter from the *Value*. This parameter overrides any hardcoded min/max axis in the style settings (see [Chart Styling Options](/products/building-bi/reference/chart-styling-options)) |
| Scale Filter | Restricts the data of *Scale Upper/ Lower Limit*. See [Filter Options](/products/building-bi/reference/filter-options). |
| Data Refresh Interval | How often the chart queries new data. Best practice: choose the **longest** acceptable interval to optimize load times. |
## Table Raw
Rows and columns of raw values from the selected Building BI `Data Source`. See [Table types](/products/building-bi/concepts/choosing-visualizations#table-types).
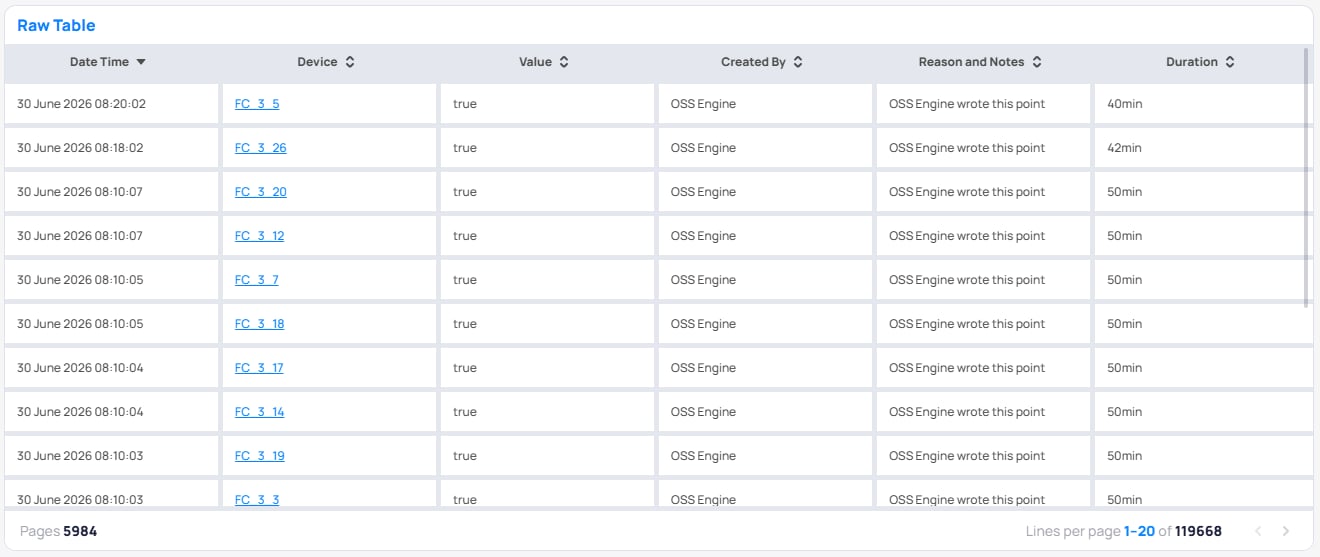 | Parameter | Description |
| --------------------- | ----------------------------------------------------------------------------------------------------------------------- |
| Columns | Column values from the selected `Data Source` to show in the table |
| Filters | Restricts the data of the *Columns*. See [Filter Options](/products/building-bi/reference/filter-options). |
| Rows per Page | Dropdown, select how many rows show prior to pagination. Options: 5, 10, 20 (default). 50. |
| Sort Order | Organizes the chart by a column's values and ranks order of impact. |
| Data Refresh Interval | How often the chart queries new data. Best practice: choose the **longest** acceptable interval to optimize load times. |
## Table Pivot
A cross-tab table: rows come from a hierarchy, columns are pivoted from a dimension's distinct values, and each cell holds an aggregated value. See [Table types](/products/building-bi/concepts/choosing-visualizations#table-types).
| Parameter | Description |
| --------------------- | ----------------------------------------------------------------------------------------------------------------------- |
| Columns | Column values from the selected `Data Source` to show in the table |
| Filters | Restricts the data of the *Columns*. See [Filter Options](/products/building-bi/reference/filter-options). |
| Rows per Page | Dropdown, select how many rows show prior to pagination. Options: 5, 10, 20 (default). 50. |
| Sort Order | Organizes the chart by a column's values and ranks order of impact. |
| Data Refresh Interval | How often the chart queries new data. Best practice: choose the **longest** acceptable interval to optimize load times. |
## Table Pivot
A cross-tab table: rows come from a hierarchy, columns are pivoted from a dimension's distinct values, and each cell holds an aggregated value. See [Table types](/products/building-bi/concepts/choosing-visualizations#table-types).
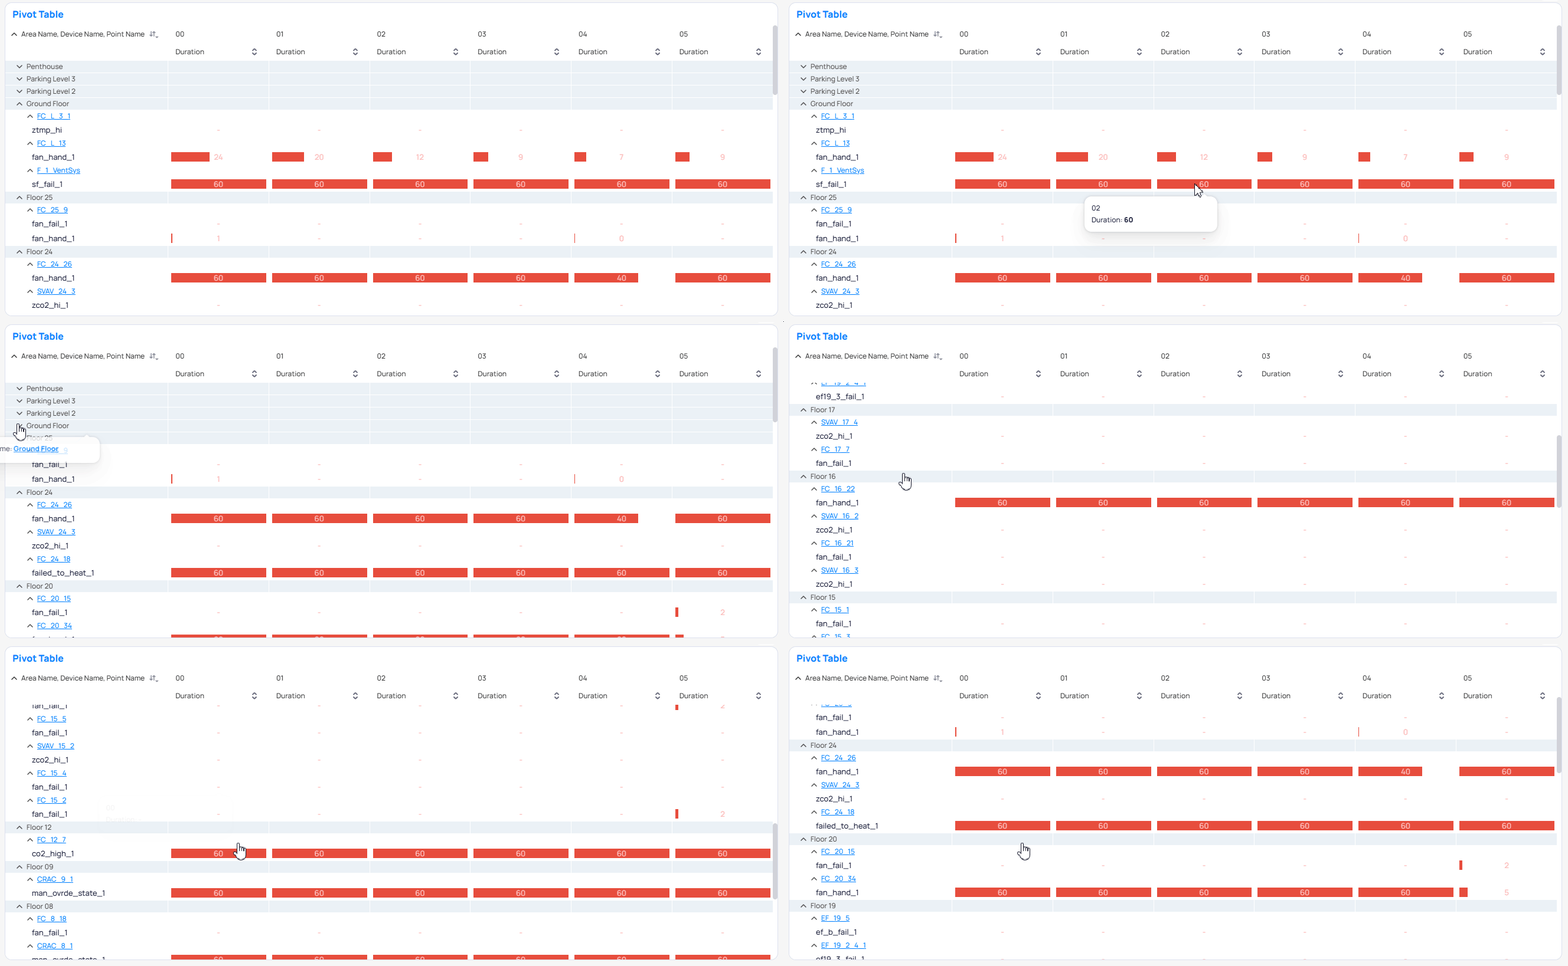 | Parameter | Description |
| ----------------------- | ------------------------------------------------------------------------------------------------------------------------------------------------------------------------------------------------------------------------------------------------------------------------------------------------------------------------------------------------------------------------------------------ |
| Hierarchy | What rows you want the pivoted table to be mapped too. Adding multiple Hierarchy elements nests the columns into dropdowns by default. Ex. A table for run hours per device that drops down to shows the run hours per day. Device Name and Date would be the hierarchy columns. |
| Pivoted Columns | The columns that *Values* aggregates data from then pivots to the Hierarchy. |
| Values | Applies aggregation functions (count, sum, first, last, etc.) to the column values for each category of the *Pivoted Column*. Ex. If your *Hierarchy* is devices, *Pivoted Column* is Hours of Day, and your *Value* is sum of running minutes. You would get a table with a row for each device and columns for each hour of the day and each cell would have the sum of running minutes. |
| Adjunct Metrics | Additional columns appended to the table. |
| Filters & Top N Filters | Restricts the data shown or keeps only the highest performers. See [Filter Options](/products/building-bi/reference/filter-options). |
| Sort Order | Organizes the chart by a column's values and ranks order of impact. |
| Data Refresh Interval | How often the chart queries new data. Best practice: choose the **longest** acceptable interval to optimize load times. |
## Table Aggregated
Columns and values aggregated to those points. See [Table types](/products/building-bi/concepts/choosing-visualizations#table-types).
| Parameter | Description |
| ----------------------- | ------------------------------------------------------------------------------------------------------------------------------------------------------------------------------------------------------------------------------------------------------------------------------------------------------------------------------------------------------------------------------------------ |
| Hierarchy | What rows you want the pivoted table to be mapped too. Adding multiple Hierarchy elements nests the columns into dropdowns by default. Ex. A table for run hours per device that drops down to shows the run hours per day. Device Name and Date would be the hierarchy columns. |
| Pivoted Columns | The columns that *Values* aggregates data from then pivots to the Hierarchy. |
| Values | Applies aggregation functions (count, sum, first, last, etc.) to the column values for each category of the *Pivoted Column*. Ex. If your *Hierarchy* is devices, *Pivoted Column* is Hours of Day, and your *Value* is sum of running minutes. You would get a table with a row for each device and columns for each hour of the day and each cell would have the sum of running minutes. |
| Adjunct Metrics | Additional columns appended to the table. |
| Filters & Top N Filters | Restricts the data shown or keeps only the highest performers. See [Filter Options](/products/building-bi/reference/filter-options). |
| Sort Order | Organizes the chart by a column's values and ranks order of impact. |
| Data Refresh Interval | How often the chart queries new data. Best practice: choose the **longest** acceptable interval to optimize load times. |
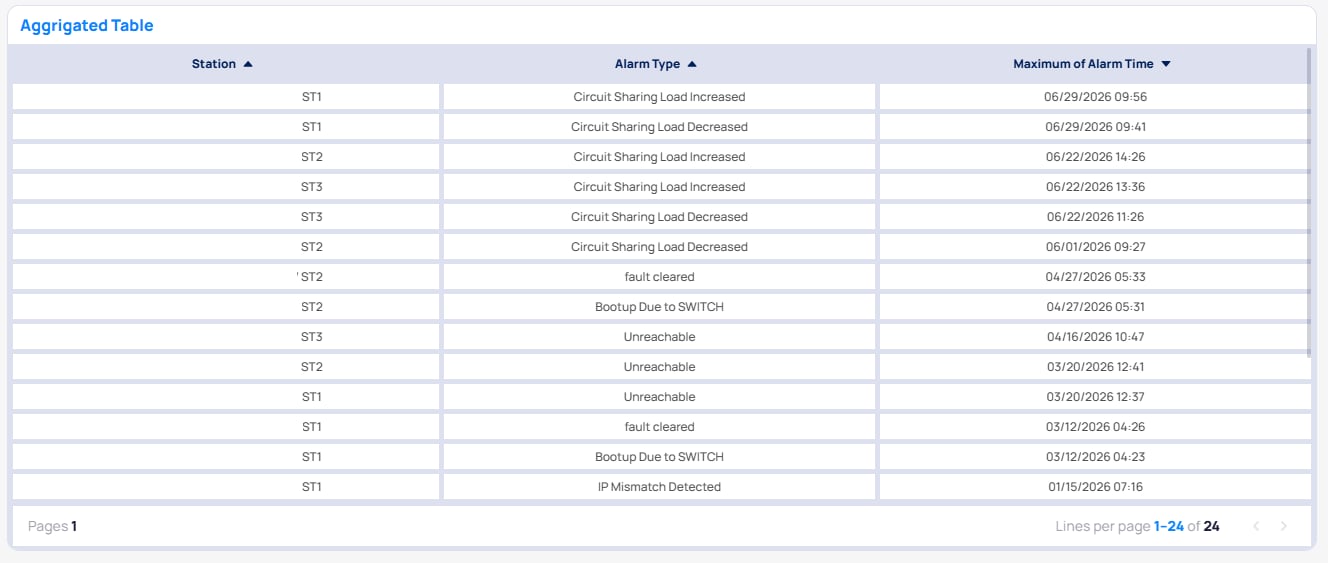
## Table Aggregated
Columns and values aggregated to those points. See [Table types](/products/building-bi/concepts/choosing-visualizations#table-types).
 | Parameter | Description |
| --------------------- | ----------------------------------------------------------------------------------------------------------------------- |
| Columns | Column values from the selected `Data Source` to show in the table |
| Aggregated Columns | Metric values aggregated (sum, max, count, last, etc.) for each column value. |
| Filters | Restricts the data of the *Columns*. See [Filter Options](/products/building-bi/reference/filter-options). |
| Rows per Page | Dropdown, select how many rows show prior to pagination. Options: 5, 10, 20 (default). 50. |
| Sort Order | Organizes the chart by a column's values and ranks order of impact. |
| Data Refresh Interval | How often the chart queries new data. Best practice: choose the **longest** acceptable interval to optimize load times. |
## Text
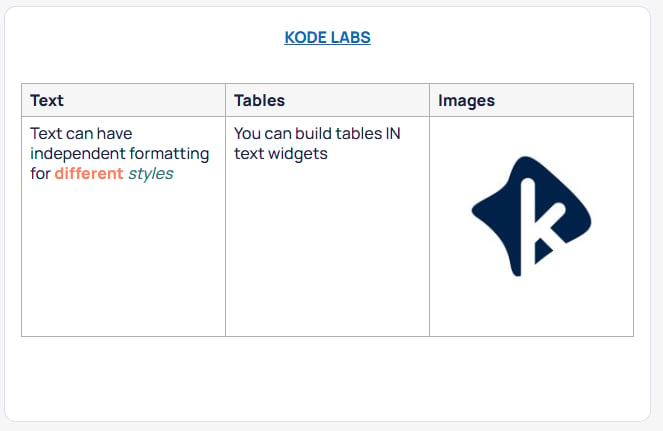
A widget that holds stylized text — titles, notes, commentary, or section dividers. It has no Setup parameters; you type directly into the widget and style it from the side panel. The Text widget supports: Font Family, Font Size, Line Height, text/background Color, **Insert Picture** (images auto-fit the widget), Background styling (color or transparent), and Padding & Alignment. A **bubble menu** appears on text selection for quick inline formatting (font size/family, bold, italic, underline, alignment, bulleted/numbered lists). Insert options such as pictures are only in the side panel, not the bubble menu. See [Chart Styling Options](/products/building-bi/reference/chart-styling-options).
| Parameter | Description |
| --------------------- | ----------------------------------------------------------------------------------------------------------------------- |
| Columns | Column values from the selected `Data Source` to show in the table |
| Aggregated Columns | Metric values aggregated (sum, max, count, last, etc.) for each column value. |
| Filters | Restricts the data of the *Columns*. See [Filter Options](/products/building-bi/reference/filter-options). |
| Rows per Page | Dropdown, select how many rows show prior to pagination. Options: 5, 10, 20 (default). 50. |
| Sort Order | Organizes the chart by a column's values and ranks order of impact. |
| Data Refresh Interval | How often the chart queries new data. Best practice: choose the **longest** acceptable interval to optimize load times. |
## Text
A widget that holds stylized text — titles, notes, commentary, or section dividers. It has no Setup parameters; you type directly into the widget and style it from the side panel. The Text widget supports: Font Family, Font Size, Line Height, text/background Color, **Insert Picture** (images auto-fit the widget), Background styling (color or transparent), and Padding & Alignment. A **bubble menu** appears on text selection for quick inline formatting (font size/family, bold, italic, underline, alignment, bulleted/numbered lists). Insert options such as pictures are only in the side panel, not the bubble menu. See [Chart Styling Options](/products/building-bi/reference/chart-styling-options).
 ## IFrame
Embeds an external web page (an iframe) by URL.
| Parameter | Description |
| ---------- | --------------------------- |
| Source URL | What URL is being embedded. |
## Weather
Shows the current and forecasted weather at a specific building. In portfolio view you must select a building. Editing this widget is done through styling options. See [Chart Styling Options](/products/building-bi/reference/chart-styling-options)
## IFrame
Embeds an external web page (an iframe) by URL.
| Parameter | Description |
| ---------- | --------------------------- |
| Source URL | What URL is being embedded. |
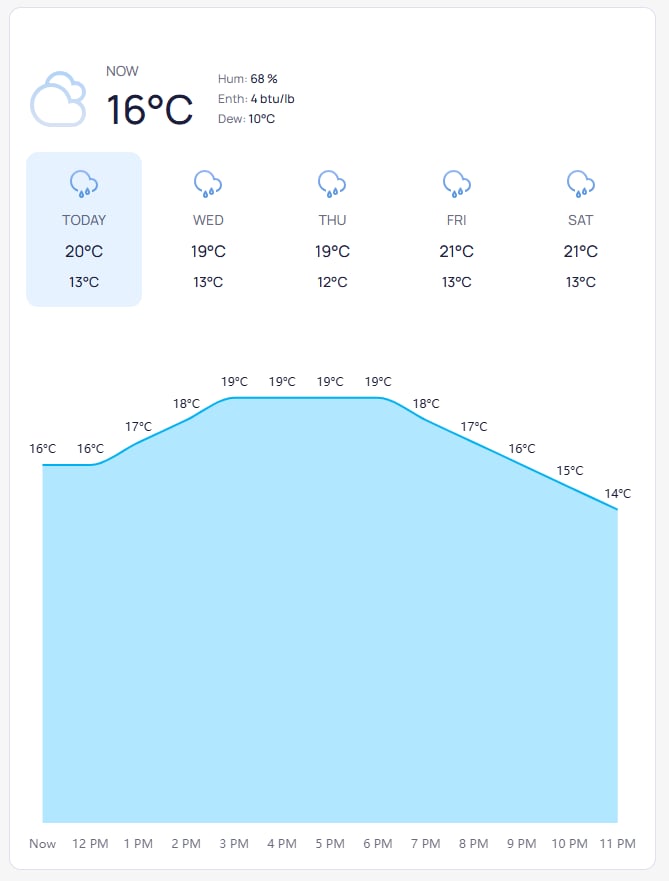
## Weather
Shows the current and forecasted weather at a specific building. In portfolio view you must select a building. Editing this widget is done through styling options. See [Chart Styling Options](/products/building-bi/reference/chart-styling-options)
 | Parameter | Description |
| --------- | ------------------------------------------------ |
| Building | Building which the weather location is based on. |
## Sankey
A flow diagram where the width of each link is proportional to the quantity flowing between stages.
| Parameter | Description |
| --------- | ------------------------------------------------ |
| Building | Building which the weather location is based on. |
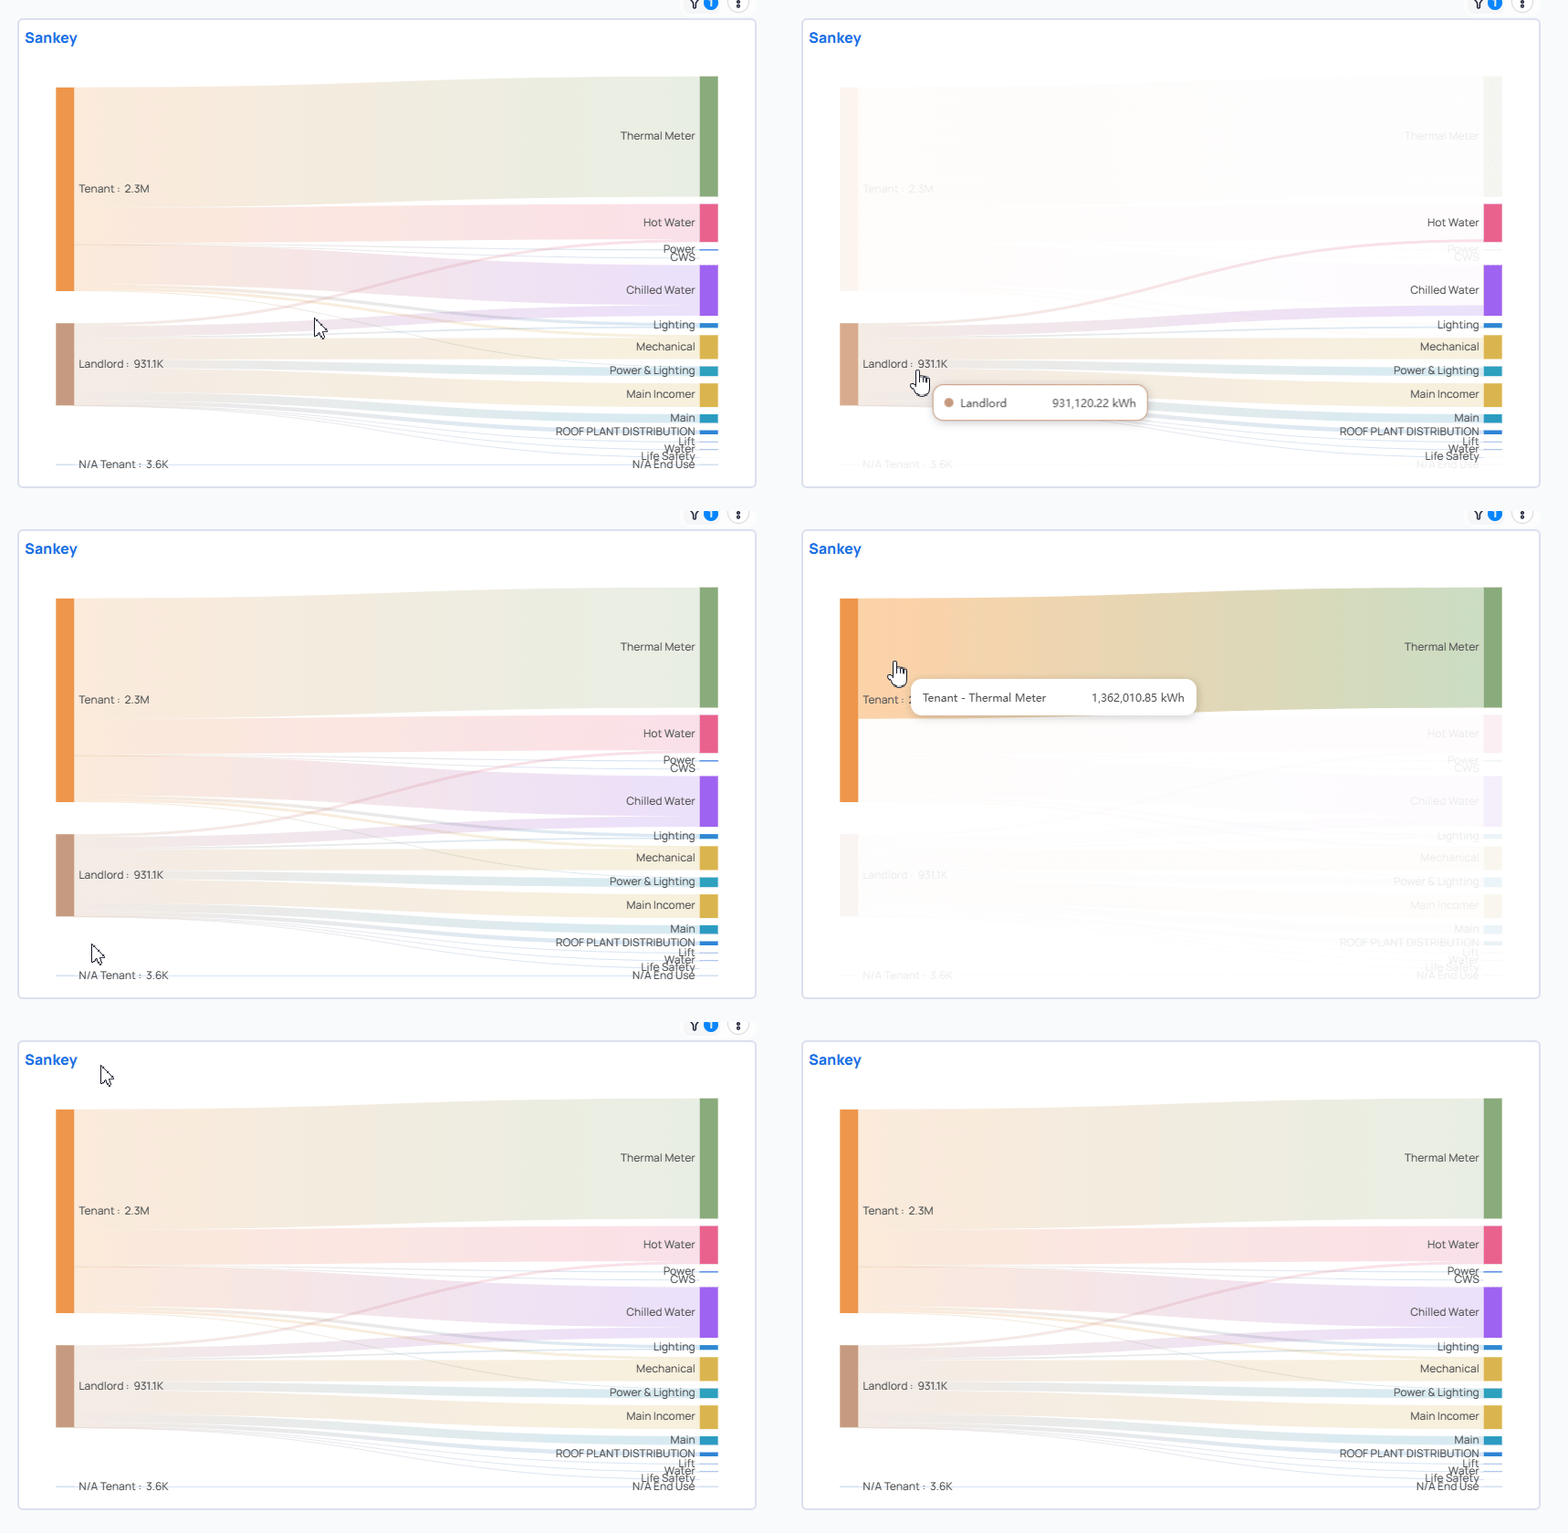
## Sankey
A flow diagram where the width of each link is proportional to the quantity flowing between stages.
 | Parameter | Description | Required? |
| --------------------- | -------------------------------------------------------------------------------------------------------------------------------------------------------------- | --------- |
| Hierarchy | At least two columns are required. Each column becomes a stage (band) in the flow; the order sets the left-to-right sequence (e.g. Source → Sub-meter → Load). | Yes |
| Value | The metric that sizes each flow, aggregated (sum, max, count, last, etc.) per link. | Yes |
| Filters | Restricts the data shown. See [Filter Options](/products/building-bi/reference/filter-options). | No |
| Sort Order | Organizes the chart by a column's values and ranks order of impact. | No |
| Data Refresh Interval | How often the chart queries new data. Best practice: choose the **longest** acceptable interval to optimize load times. | Yes |
## Slicer
An on-canvas, interactive filter control bound to a single column. Viewers change the selection to filter the widgets in its scope. The display adapts to the column's data type (dropdown/flat for strings and booleans, a min/max slider for numbers, and date-range pickers for dates). For the full configuration (data types, selection modes, display options) see [Slicer Widget](/products/building-bi/reference/slicer-widget); for how slicer filters interact with other filters see [Filter Options](/products/building-bi/reference/filter-options) and [Filter scopes](/products/building-bi/reference/filter-options#filter-scope-hierarchy).
| Parameter | Description | Required? |
| --------------------- | -------------------------------------------------------------------------------------------------------------------------------------------------------------- | --------- |
| Hierarchy | At least two columns are required. Each column becomes a stage (band) in the flow; the order sets the left-to-right sequence (e.g. Source → Sub-meter → Load). | Yes |
| Value | The metric that sizes each flow, aggregated (sum, max, count, last, etc.) per link. | Yes |
| Filters | Restricts the data shown. See [Filter Options](/products/building-bi/reference/filter-options). | No |
| Sort Order | Organizes the chart by a column's values and ranks order of impact. | No |
| Data Refresh Interval | How often the chart queries new data. Best practice: choose the **longest** acceptable interval to optimize load times. | Yes |
## Slicer
An on-canvas, interactive filter control bound to a single column. Viewers change the selection to filter the widgets in its scope. The display adapts to the column's data type (dropdown/flat for strings and booleans, a min/max slider for numbers, and date-range pickers for dates). For the full configuration (data types, selection modes, display options) see [Slicer Widget](/products/building-bi/reference/slicer-widget); for how slicer filters interact with other filters see [Filter Options](/products/building-bi/reference/filter-options) and [Filter scopes](/products/building-bi/reference/filter-options#filter-scope-hierarchy).
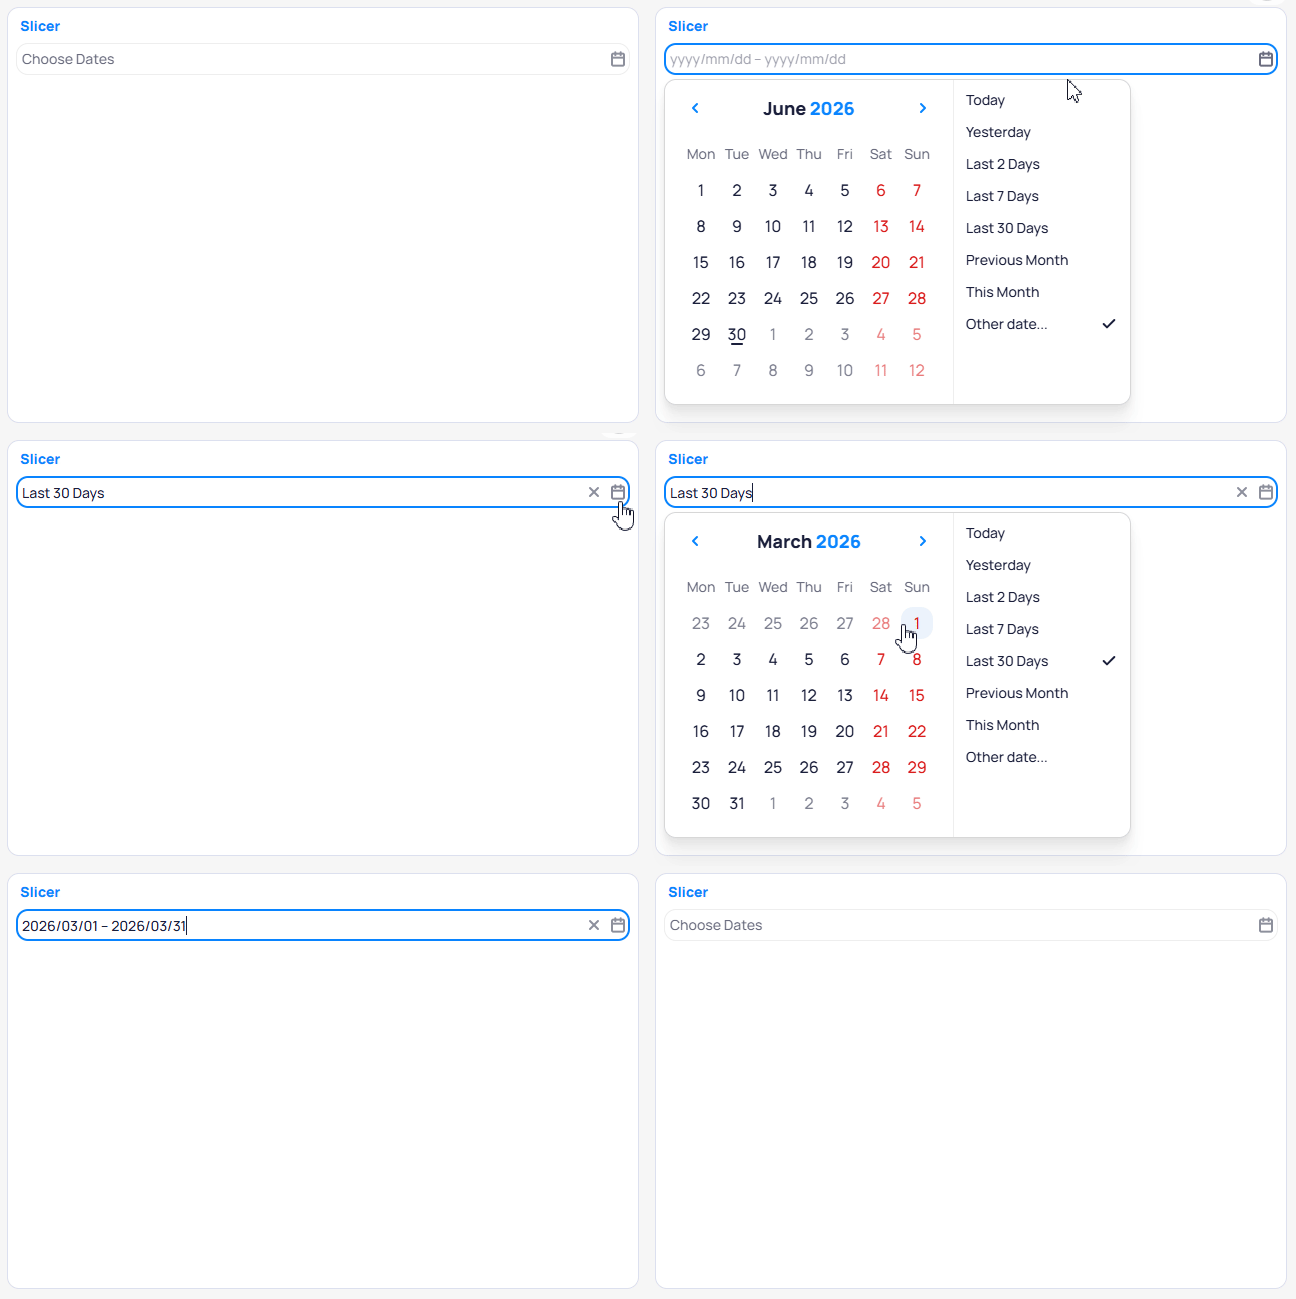 ## Polar Bar
Radial or Polar bars comparing values between categories
## Polar Bar
Radial or Polar bars comparing values between categories
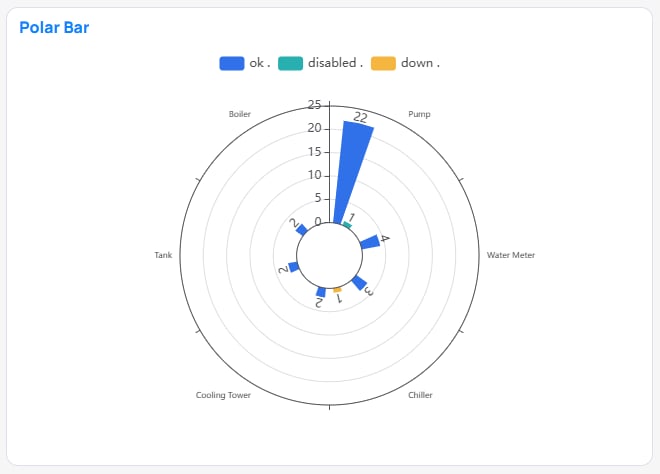 | Parameter | Description |
| ----------------------- | ------------------------------------------------------------------------------------------------------------------------------------------------------------------------------------------------------------------------------------------------------------------------------------ |
| Radial Axis | The primary dimensions for the data, categorical groups the bars are split into. You can add multiple Radial Axis dimensions that by default create additional subdivisions of the Radial Axis. The Drill Down & Expand All toggles interact with additional Radial Axis. |
| Drill Down | If you have multiple Radial Axis dimensions Drill Down separates different dimensions into a hierarchy that are all compared against the Y-Axis dimension. Ex. AHU Run Hours per building, enabling drill down you can drill down into one building to see AHU Run Hours per floor. |
| Expand All | If you have multiple Radial Axis dimensions Expand All merges the dimensions into many subdivisions. Ex. AHU Run Hours per Building & Floor. |
| Legend | Splits/categorizes information into adjacent bars per X-Axis dimension. (e.g. total energy usage broken down by floor). See [Chart Styling Options](/products/building-bi/reference/chart-styling-options) to adjust spacing and colors. |
| Metrics (Value Axis) | Metric column(s) drawn as bars from the center outward; each metric adds a bar (≥1 required). Internal spec term *Metrics*. |
| Filters & Top N Filters | Restricts the data shown or keeps only the highest performers. See [Filter Options](/products/building-bi/reference/filter-options). |
| Sort Order | Organizes the chart by a column's values and ranks order of impact. |
| Data Refresh Interval | How often the chart queries new data. Best practice: choose the **longest** acceptable interval to optimize load times. |
## Stacked Polar Bar
Radial or Polar bars comparing values between categories. Legend categories stack values rather than creating new bars.
| Parameter | Description |
| ----------------------- | ------------------------------------------------------------------------------------------------------------------------------------------------------------------------------------------------------------------------------------------------------------------------------------ |
| Radial Axis | The primary dimensions for the data, categorical groups the bars are split into. You can add multiple Radial Axis dimensions that by default create additional subdivisions of the Radial Axis. The Drill Down & Expand All toggles interact with additional Radial Axis. |
| Drill Down | If you have multiple Radial Axis dimensions Drill Down separates different dimensions into a hierarchy that are all compared against the Y-Axis dimension. Ex. AHU Run Hours per building, enabling drill down you can drill down into one building to see AHU Run Hours per floor. |
| Expand All | If you have multiple Radial Axis dimensions Expand All merges the dimensions into many subdivisions. Ex. AHU Run Hours per Building & Floor. |
| Legend | Splits/categorizes information into adjacent bars per X-Axis dimension. (e.g. total energy usage broken down by floor). See [Chart Styling Options](/products/building-bi/reference/chart-styling-options) to adjust spacing and colors. |
| Metrics (Value Axis) | Metric column(s) drawn as bars from the center outward; each metric adds a bar (≥1 required). Internal spec term *Metrics*. |
| Filters & Top N Filters | Restricts the data shown or keeps only the highest performers. See [Filter Options](/products/building-bi/reference/filter-options). |
| Sort Order | Organizes the chart by a column's values and ranks order of impact. |
| Data Refresh Interval | How often the chart queries new data. Best practice: choose the **longest** acceptable interval to optimize load times. |
## Stacked Polar Bar
Radial or Polar bars comparing values between categories. Legend categories stack values rather than creating new bars.
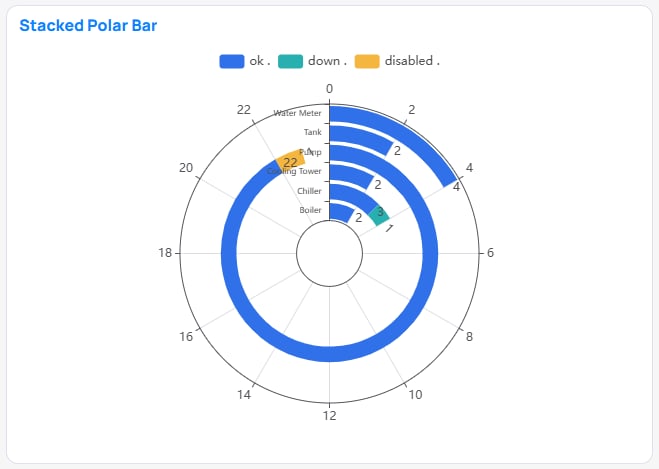 | Parameter | Description |
| ----------------------- | ------------------------------------------------------------------------------------------------------------------------------------------------------------------------------------------------------------------------------------------------------------------------------------ |
| Radial Axis | The primary dimensions for the data, categorical groups the bars are split into. You can add multiple Radial Axis dimensions that by default create additional subdivisions of the Radial Axis. The Drill Down & Expand All toggles interact with additional Radial Axis. |
| Drill Down | If you have multiple Radial Axis dimensions Drill Down separates different dimensions into a hierarchy that are all compared against the Y-Axis dimension. Ex. AHU Run Hours per building, enabling drill down you can drill down into one building to see AHU Run Hours per floor. |
| Expand All | If you have multiple Radial Axis dimensions Expand All merges the dimensions into many subdivisions. Ex. AHU Run Hours per Building & Floor. |
| Legend | Splits/categorizes information into adjacent bars per X-Axis dimension. (e.g. total energy usage broken down by floor). See [Chart Styling Options](/products/building-bi/reference/chart-styling-options) to adjust spacing and colors. |
| Metrics (Value Axis) | Metric column(s) drawn as bars from the center outward; each metric adds a bar (≥1 required). Internal spec term *Metrics*. |
| Filters & Top N Filters | Restricts the data shown or keeps only the highest performers. See [Filter Options](/products/building-bi/reference/filter-options). |
| Sort Order | Organizes the chart by a column's values and ranks order of impact. |
| Data Refresh Interval | How often the chart queries new data. Best practice: choose the **longest** acceptable interval to optimize load times. |
## Navigation
A button widget that navigates the viewer to another page. Clicking anywhere inside the widget (except the title) triggers navigation.
| Parameter | Description | Required? |
| ----------- | ------------------------------------------------------------------------------------------------------------ | --------- |
| Navigate to | Single-select dropdown of pages to navigate to. Supports a "no page selected" state (clicking does nothing). | Yes |
Style options: button **Text** (defaults to the page name), **Font**, **Alignment**, and **Wrap text** (up to 3 rows). If the page name is longer than the button, it is truncated with `…` and shown in full on hover. The Navigation widget **cannot be exported or shared**. If its target page is removed, it reverts to the no-page-selected state.
## Time Series
Visualizes how a value or state changes over time — when each change occurred and how long it held — drawn as colored spans, one row per category. Works best on raw Point Time Series (Real-Time) data.
| Parameter | Description |
| ----------------------- | ------------------------------------------------------------------------------------------------------------------------------------------------------------------------------------------------------------------------------------------------------------------------------------ |
| Radial Axis | The primary dimensions for the data, categorical groups the bars are split into. You can add multiple Radial Axis dimensions that by default create additional subdivisions of the Radial Axis. The Drill Down & Expand All toggles interact with additional Radial Axis. |
| Drill Down | If you have multiple Radial Axis dimensions Drill Down separates different dimensions into a hierarchy that are all compared against the Y-Axis dimension. Ex. AHU Run Hours per building, enabling drill down you can drill down into one building to see AHU Run Hours per floor. |
| Expand All | If you have multiple Radial Axis dimensions Expand All merges the dimensions into many subdivisions. Ex. AHU Run Hours per Building & Floor. |
| Legend | Splits/categorizes information into adjacent bars per X-Axis dimension. (e.g. total energy usage broken down by floor). See [Chart Styling Options](/products/building-bi/reference/chart-styling-options) to adjust spacing and colors. |
| Metrics (Value Axis) | Metric column(s) drawn as bars from the center outward; each metric adds a bar (≥1 required). Internal spec term *Metrics*. |
| Filters & Top N Filters | Restricts the data shown or keeps only the highest performers. See [Filter Options](/products/building-bi/reference/filter-options). |
| Sort Order | Organizes the chart by a column's values and ranks order of impact. |
| Data Refresh Interval | How often the chart queries new data. Best practice: choose the **longest** acceptable interval to optimize load times. |
## Navigation
A button widget that navigates the viewer to another page. Clicking anywhere inside the widget (except the title) triggers navigation.
| Parameter | Description | Required? |
| ----------- | ------------------------------------------------------------------------------------------------------------ | --------- |
| Navigate to | Single-select dropdown of pages to navigate to. Supports a "no page selected" state (clicking does nothing). | Yes |
Style options: button **Text** (defaults to the page name), **Font**, **Alignment**, and **Wrap text** (up to 3 rows). If the page name is longer than the button, it is truncated with `…` and shown in full on hover. The Navigation widget **cannot be exported or shared**. If its target page is removed, it reverts to the no-page-selected state.
## Time Series
Visualizes how a value or state changes over time — when each change occurred and how long it held — drawn as colored spans, one row per category. Works best on raw Point Time Series (Real-Time) data.
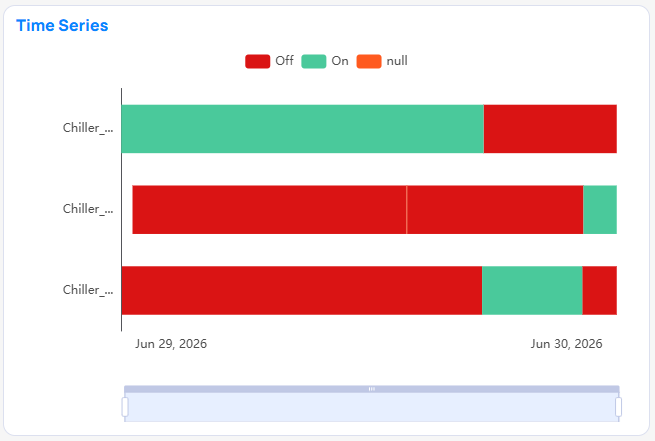 | Parameter | Description |
| ----------------------- | ------------------------------------------------------------------------------------------------------------------------------------------------------------------------------------------------------------------ |
| Date Axis | Must be a DateTime value and works best in Point Time Series Real Time. This is the time axis the data is shown across. Most often you will use the column DateTimeLocal. To restrict this axis use *Date Filter*. |
| Legend | The Y-Axis categories displayed across the *Date Axis*. Use *filters* to reduce down to a single device or point. |
| Y-Axis | The metric shown on the values. Use *Filters* to reduce to a single point value to show accurate changes. |
| Date Filter | The filter specifically for the *Date Axis* |
| Tooltips | Additional metrics to include in the chart tooltip on the hover. |
| Filters & Top N Filters | Restricts the data shown or keeps only the highest performers. See [Filter Options](/products/building-bi/reference/filter-options). |
| Sort Order | Organizes the chart by a column's values and ranks order of impact. |
| Data Refresh Interval | How often the chart queries new data. Best practice: choose the **longest** acceptable interval to optimize load times. |
## Graphics
Embeds a KODE Graphics layout (floor plan / device / system graphic) inside a dashboard, with the advantage that BI filters drive what the graphic shows. For example, a `device_name` page filter automatically focuses the graphic on that device.
| Parameter | Description |
| ----------------------- | ------------------------------------------------------------------------------------------------------------------------------------------------------------------------------------------------------------------ |
| Date Axis | Must be a DateTime value and works best in Point Time Series Real Time. This is the time axis the data is shown across. Most often you will use the column DateTimeLocal. To restrict this axis use *Date Filter*. |
| Legend | The Y-Axis categories displayed across the *Date Axis*. Use *filters* to reduce down to a single device or point. |
| Y-Axis | The metric shown on the values. Use *Filters* to reduce to a single point value to show accurate changes. |
| Date Filter | The filter specifically for the *Date Axis* |
| Tooltips | Additional metrics to include in the chart tooltip on the hover. |
| Filters & Top N Filters | Restricts the data shown or keeps only the highest performers. See [Filter Options](/products/building-bi/reference/filter-options). |
| Sort Order | Organizes the chart by a column's values and ranks order of impact. |
| Data Refresh Interval | How often the chart queries new data. Best practice: choose the **longest** acceptable interval to optimize load times. |
## Graphics
Embeds a KODE Graphics layout (floor plan / device / system graphic) inside a dashboard, with the advantage that BI filters drive what the graphic shows. For example, a `device_name` page filter automatically focuses the graphic on that device.
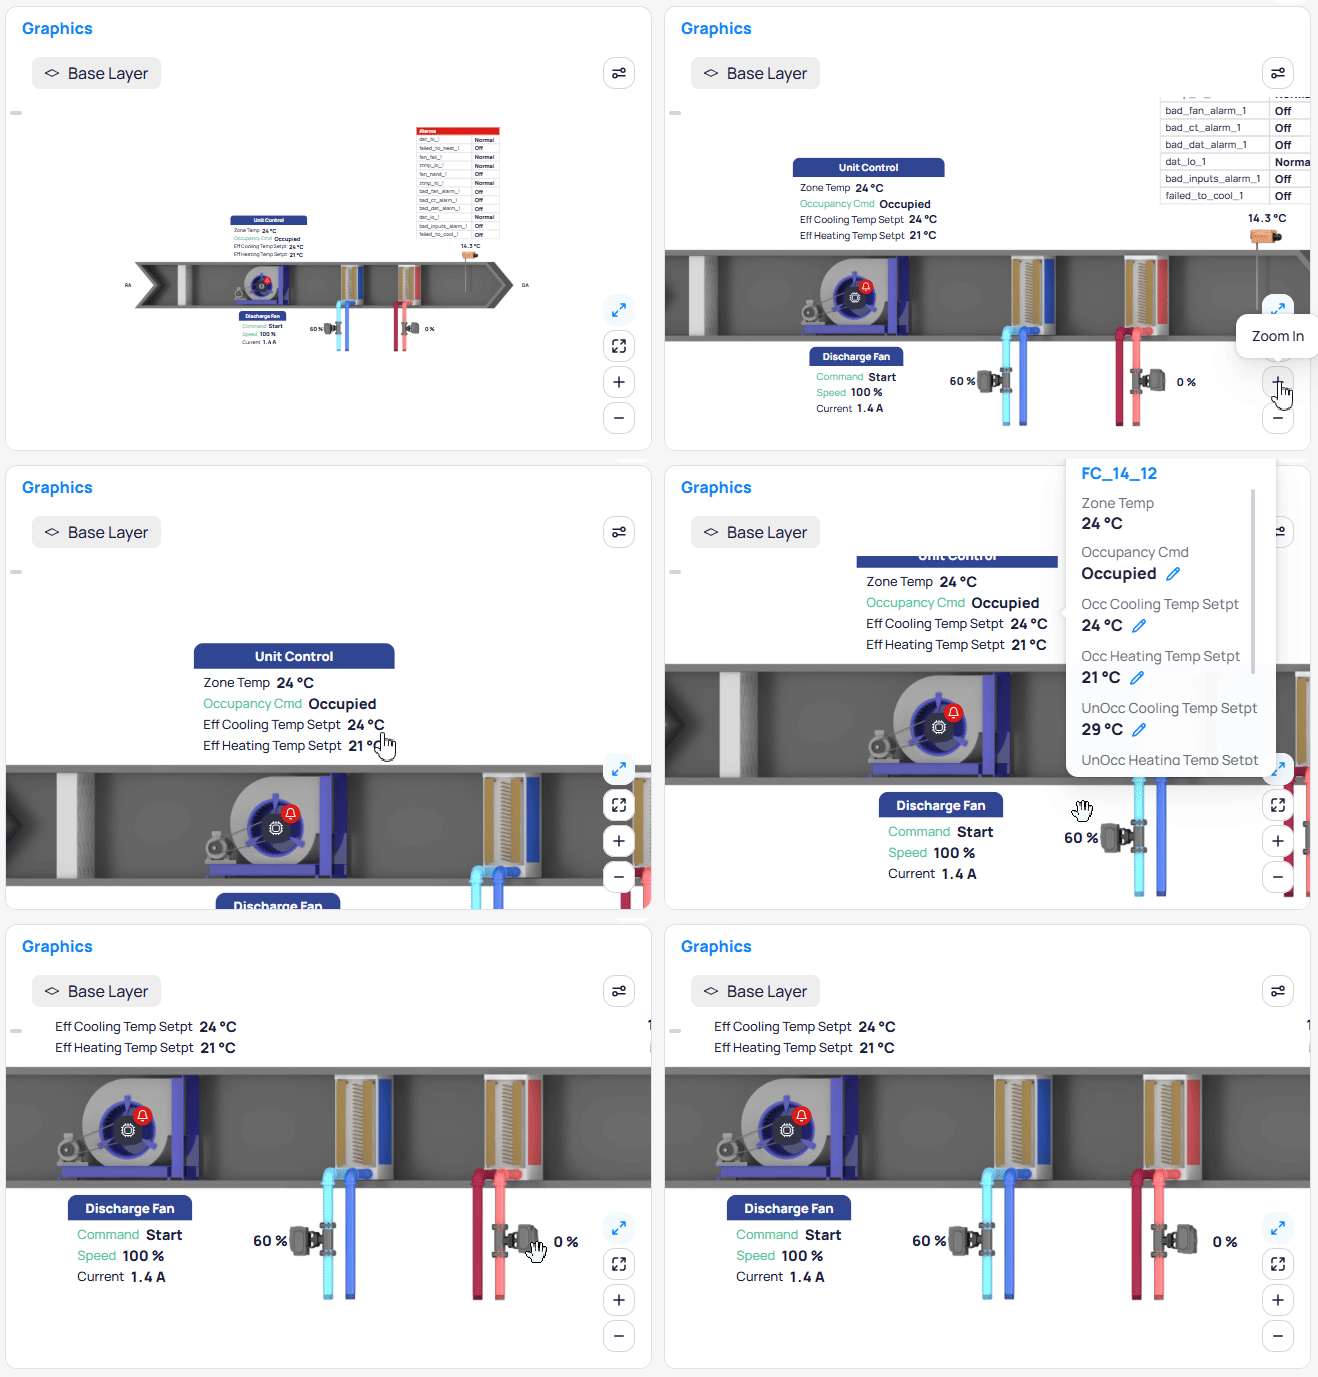 | Parameter | Description | Required? |
| ------------ | ------------------------------------------------------------------------------------------------------------------------------------------------------------------------------------------------------------------------------------------ | -------------------------------- |
| Graphic Type | Dropdown of graphic types: `AREA`, `DEVICE`, `SYSTEM`. Single select. | Yes |
| Building | Dropdown of buildings that have graphics of the selected type. Single select. | Yes |
| Entity | Dropdown of entities for the selected graphic type (e.g. for `DEVICE`, the list of devices that have graphics). Can also be filled from a BI page filter such as `device_name`; selecting an entity in the widget overrides the BI filter. | ✓ if not supplied by a BI filter |
| Device Types | Dropdown of device types used in the layout's layers; used to filter out specific layers. Multiple select. | No |
| Layout Name | For an Area graphic with multiple layouts, a dropdown to pick which layout to show. Not exposed as a configuration filter — only appears at render time when multiple layouts exist. | conditional |
Graphic Type and Building form a required group: the other filters stay disabled until both are set. Once rendered, the graphic's markers and data points are filtered by all active dashboard, page, widget, slicer, drill-through, and cross filters (only `EQUALS` / `IN` string filters on mapped columns such as `device_name`, `device_id`, `point_name`, `point_id`, and ontology fields are applied).
## Timeline
A Gantt-style chart that draws each row as a horizontal bar spanning a start and end date — useful for visualizing when a state, task, or event was active and for how long.
| Parameter | Description | Required? |
| --------------------- | ------------------------------------------------------------------------------------------------------------------------------------------------------------------------------------------------------- | --------- |
| Key | The column used to group data; rendered on the Y-Axis (one row per key). | Yes |
| Start Date | The column that sets each bar's start point on the X-Axis. Must be a Date / DateTime column. | Yes |
| End Date | The column that sets each bar's end point on the X-Axis. Must be a Date / DateTime column. | Yes |
| Bar Label | A single column (no aggregate) shown as a label inside each bar. Cannot be used for sorting. | No |
| Tooltips | One or more columns (no aggregate) shown in the tooltip. | No |
| Filters | Restricts the data shown. Filters set in chart configuration are always applied and cannot be unselected from the dashboard view. See [Filter Options](/products/building-bi/reference/filter-options). | No |
| Sort Order | Sort by the Key column or by tooltip columns. Start Date, End Date, and Bar Label cannot be used for sorting. See [Chart Setup Parameters](/products/building-bi/reference/chart-setup-parameters). | No |
| Data Refresh Interval | How often the chart queries new data. Best practice: choose the **longest** acceptable interval to optimize load times. | Yes |
## Tree
Branching nodes for nested hierarchies. You can change the orientation and the layout (Radial vs Orthogonal) in the style tab.
| Parameter | Description | Required? |
| ------------ | ------------------------------------------------------------------------------------------------------------------------------------------------------------------------------------------------------------------------------------------ | -------------------------------- |
| Graphic Type | Dropdown of graphic types: `AREA`, `DEVICE`, `SYSTEM`. Single select. | Yes |
| Building | Dropdown of buildings that have graphics of the selected type. Single select. | Yes |
| Entity | Dropdown of entities for the selected graphic type (e.g. for `DEVICE`, the list of devices that have graphics). Can also be filled from a BI page filter such as `device_name`; selecting an entity in the widget overrides the BI filter. | ✓ if not supplied by a BI filter |
| Device Types | Dropdown of device types used in the layout's layers; used to filter out specific layers. Multiple select. | No |
| Layout Name | For an Area graphic with multiple layouts, a dropdown to pick which layout to show. Not exposed as a configuration filter — only appears at render time when multiple layouts exist. | conditional |
Graphic Type and Building form a required group: the other filters stay disabled until both are set. Once rendered, the graphic's markers and data points are filtered by all active dashboard, page, widget, slicer, drill-through, and cross filters (only `EQUALS` / `IN` string filters on mapped columns such as `device_name`, `device_id`, `point_name`, `point_id`, and ontology fields are applied).
## Timeline
A Gantt-style chart that draws each row as a horizontal bar spanning a start and end date — useful for visualizing when a state, task, or event was active and for how long.
| Parameter | Description | Required? |
| --------------------- | ------------------------------------------------------------------------------------------------------------------------------------------------------------------------------------------------------- | --------- |
| Key | The column used to group data; rendered on the Y-Axis (one row per key). | Yes |
| Start Date | The column that sets each bar's start point on the X-Axis. Must be a Date / DateTime column. | Yes |
| End Date | The column that sets each bar's end point on the X-Axis. Must be a Date / DateTime column. | Yes |
| Bar Label | A single column (no aggregate) shown as a label inside each bar. Cannot be used for sorting. | No |
| Tooltips | One or more columns (no aggregate) shown in the tooltip. | No |
| Filters | Restricts the data shown. Filters set in chart configuration are always applied and cannot be unselected from the dashboard view. See [Filter Options](/products/building-bi/reference/filter-options). | No |
| Sort Order | Sort by the Key column or by tooltip columns. Start Date, End Date, and Bar Label cannot be used for sorting. See [Chart Setup Parameters](/products/building-bi/reference/chart-setup-parameters). | No |
| Data Refresh Interval | How often the chart queries new data. Best practice: choose the **longest** acceptable interval to optimize load times. | Yes |
## Tree
Branching nodes for nested hierarchies. You can change the orientation and the layout (Radial vs Orthogonal) in the style tab.
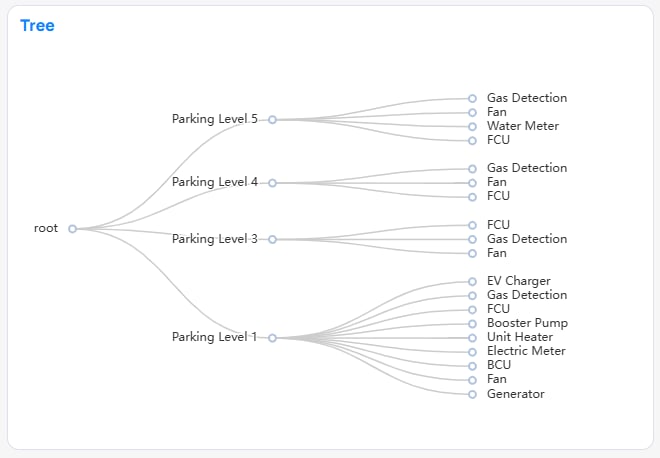 | Parameter | Description | Required? |
| --------------------- | ------------------------------------------------------------------------------------------------------------------------------------------------------------------------------------------------------- | --------- |
| Hierarchy | The nodes on display. The column order sets the nesting order. E.g. a hierarchy of Area Name → Device Type yields a node per area, each leading to a node per device type in that area. | Yes |
| Tooltips | One or more columns shown in the tooltip of each node. | No |
| Filters | Restricts the data shown. Filters set in chart configuration are always applied and cannot be unselected from the dashboard view. See [Filter Options](/products/building-bi/reference/filter-options). | No |
| Sort Order | Sort by hierarchy or tooltip columns. See [Chart Setup Parameters](/products/building-bi/reference/chart-setup-parameters). | No |
| Data Refresh Interval | How often the chart queries new data. Best practice: choose the **longest** acceptable interval to optimize load times. | Yes |
## Picture
Show a picture from a file or external URL
## Building Date Time
Shows the local building time. You can adjust the visuals in the Style tab.
| Parameter | Description | Required? |
| --------------------- | ------------------------------------------------------------------------------------------------------------------------------------------------------------------------------------------------------- | --------- |
| Hierarchy | The nodes on display. The column order sets the nesting order. E.g. a hierarchy of Area Name → Device Type yields a node per area, each leading to a node per device type in that area. | Yes |
| Tooltips | One or more columns shown in the tooltip of each node. | No |
| Filters | Restricts the data shown. Filters set in chart configuration are always applied and cannot be unselected from the dashboard view. See [Filter Options](/products/building-bi/reference/filter-options). | No |
| Sort Order | Sort by hierarchy or tooltip columns. See [Chart Setup Parameters](/products/building-bi/reference/chart-setup-parameters). | No |
| Data Refresh Interval | How often the chart queries new data. Best practice: choose the **longest** acceptable interval to optimize load times. | Yes |
## Picture
Show a picture from a file or external URL
## Building Date Time
Shows the local building time. You can adjust the visuals in the Style tab.
 | Parameter | Description |
| --------- | ------------------------------------ |
| Building | Building which the time is based on. |
## Feature support by type
Not every interaction or style feature is available on every chart type. For the full list of Style sections by chart type, see [Chart Styling Options](/products/building-bi/reference/chart-styling-options).
| Feature | Available on |
| -------------------------------------------------------------------------- | ---------------------------------------------------------------------------------------------------------------------------------------------------------------------- |
| Drill-down / hierarchies | Tree-map (best), Bar, Line, Pie, Sunburst |
| Cross-filtering (click a segment to filter the page) | Pie, Bar (chart segments generally) |
| Drill-through (right-click a data point to open a filtered page/dashboard) | The same widgets that support cross-filtering; not metric-only charts. See [Drill-Through Filters](/products/building-bi/concepts/drill-through-filters). |
| Navigate to KODE OS (right-click a data point or a linked column) | Tables (Raw, Aggregated, Pivot), Bar (all), Line (all, at a marker), Pie, Sunburst, Heat-map, Tree-map, Scatter, Boxplot, Sankey (nodes), Polar Bar (all), Time-series |
| Zoom & Scroll | Line, Bar, Combo, Boxplot, Polar Bar, Tree, Sankey, Advanced Scatter, Heat-map, Scatter |
| Bar Configuration (thickness/spacing) | Bar (all), Combo |
| Line Styles & Markers | Line (all), Combo; markers also on Scatter and Advanced Scatter |
| Mark Areas (shade an X- or Y-axis range) | Line, Bar, Combo, Scatter, Boxplot. See [Chart Styling Options](/products/building-bi/reference/chart-styling-options). |
| Reference Lines | Line, Bar, Combo, Scatter, Boxplot |
| Confidence Bands (uncertainty band around a series) | Line charts only. See [Chart Styling Options](/products/building-bi/reference/chart-styling-options). |
| Regression Line (trend line) | Scatter only. See [Chart Styling Options](/products/building-bi/reference/chart-styling-options). |
| Data Bars (in-cell bars) | Table Raw, Table Aggregated, Table Pivot (lowest level only). See [Chart Styling Options](/products/building-bi/reference/chart-styling-options). |
| Donut mode | Pie |
| Sort by another data-source column | See per-type support in [Chart Setup Parameters](/products/building-bi/reference/chart-setup-parameters). |
## See also
* Set up data for a chart: [Chart Setup Parameters](/products/building-bi/reference/chart-setup-parameters)
* Style a chart: [Chart Styling Options](/products/building-bi/reference/chart-styling-options) · [Color Tools](/products/building-bi/reference/color-tools)
* The interactive filter widget: [Slicer Widget](/products/building-bi/reference/slicer-widget)
* Drilling from a chart into a filtered view: [Drill-Through Filters](/products/building-bi/concepts/drill-through-filters)
* The concept behind choosing a chart: [Choosing the Right Visualization](/products/building-bi/concepts/choosing-visualizations)
* Task guide: [Dashboards](/products/building-bi/dashboards)
## Next steps
Browse concept guides and reference pages for Building BI.
Create and configure interactive dashboards with charts and widgets.
## Related reading
* [Configure charts on a dashboard](/products/building-bi/dashboards#add-widgets-and-charts)
* [Chart setup parameters](/products/building-bi/reference/chart-setup-parameters)
* [Chart styling options](/products/building-bi/reference/chart-styling-options)
* [Choosing the right visualization](/products/building-bi/concepts/choosing-visualizations)
| Parameter | Description |
| --------- | ------------------------------------ |
| Building | Building which the time is based on. |
## Feature support by type
Not every interaction or style feature is available on every chart type. For the full list of Style sections by chart type, see [Chart Styling Options](/products/building-bi/reference/chart-styling-options).
| Feature | Available on |
| -------------------------------------------------------------------------- | ---------------------------------------------------------------------------------------------------------------------------------------------------------------------- |
| Drill-down / hierarchies | Tree-map (best), Bar, Line, Pie, Sunburst |
| Cross-filtering (click a segment to filter the page) | Pie, Bar (chart segments generally) |
| Drill-through (right-click a data point to open a filtered page/dashboard) | The same widgets that support cross-filtering; not metric-only charts. See [Drill-Through Filters](/products/building-bi/concepts/drill-through-filters). |
| Navigate to KODE OS (right-click a data point or a linked column) | Tables (Raw, Aggregated, Pivot), Bar (all), Line (all, at a marker), Pie, Sunburst, Heat-map, Tree-map, Scatter, Boxplot, Sankey (nodes), Polar Bar (all), Time-series |
| Zoom & Scroll | Line, Bar, Combo, Boxplot, Polar Bar, Tree, Sankey, Advanced Scatter, Heat-map, Scatter |
| Bar Configuration (thickness/spacing) | Bar (all), Combo |
| Line Styles & Markers | Line (all), Combo; markers also on Scatter and Advanced Scatter |
| Mark Areas (shade an X- or Y-axis range) | Line, Bar, Combo, Scatter, Boxplot. See [Chart Styling Options](/products/building-bi/reference/chart-styling-options). |
| Reference Lines | Line, Bar, Combo, Scatter, Boxplot |
| Confidence Bands (uncertainty band around a series) | Line charts only. See [Chart Styling Options](/products/building-bi/reference/chart-styling-options). |
| Regression Line (trend line) | Scatter only. See [Chart Styling Options](/products/building-bi/reference/chart-styling-options). |
| Data Bars (in-cell bars) | Table Raw, Table Aggregated, Table Pivot (lowest level only). See [Chart Styling Options](/products/building-bi/reference/chart-styling-options). |
| Donut mode | Pie |
| Sort by another data-source column | See per-type support in [Chart Setup Parameters](/products/building-bi/reference/chart-setup-parameters). |
## See also
* Set up data for a chart: [Chart Setup Parameters](/products/building-bi/reference/chart-setup-parameters)
* Style a chart: [Chart Styling Options](/products/building-bi/reference/chart-styling-options) · [Color Tools](/products/building-bi/reference/color-tools)
* The interactive filter widget: [Slicer Widget](/products/building-bi/reference/slicer-widget)
* Drilling from a chart into a filtered view: [Drill-Through Filters](/products/building-bi/concepts/drill-through-filters)
* The concept behind choosing a chart: [Choosing the Right Visualization](/products/building-bi/concepts/choosing-visualizations)
* Task guide: [Dashboards](/products/building-bi/dashboards)
## Next steps
Browse concept guides and reference pages for Building BI.
Create and configure interactive dashboards with charts and widgets.
## Related reading
* [Configure charts on a dashboard](/products/building-bi/dashboards#add-widgets-and-charts)
* [Chart setup parameters](/products/building-bi/reference/chart-setup-parameters)
* [Chart styling options](/products/building-bi/reference/chart-styling-options)
* [Choosing the right visualization](/products/building-bi/concepts/choosing-visualizations)