> ## Documentation Index
> Fetch the complete documentation index at: https://documentation.kodelabs.com/llms.txt
> Use this file to discover all available pages before exploring further.
# Physical vs virtual data sources
> Compare physical and virtual Building BI data sources and choose where transformations should run.
A **physical** data source is real data sitting in a table from the KODE backend. A **virtual** data source is a saved SQL query — a view — layered on top of physical tables.
Virtual sources are flexible and editable, but they compute on demand. Use virtual tables where on-demand computation helps, especially real-time reshaping.
Both kinds appear in the same list and can feed a chart. The distinction is where the data lives versus where it is computed. See [Data source types](/products/building-bi/reference/data-source-types).
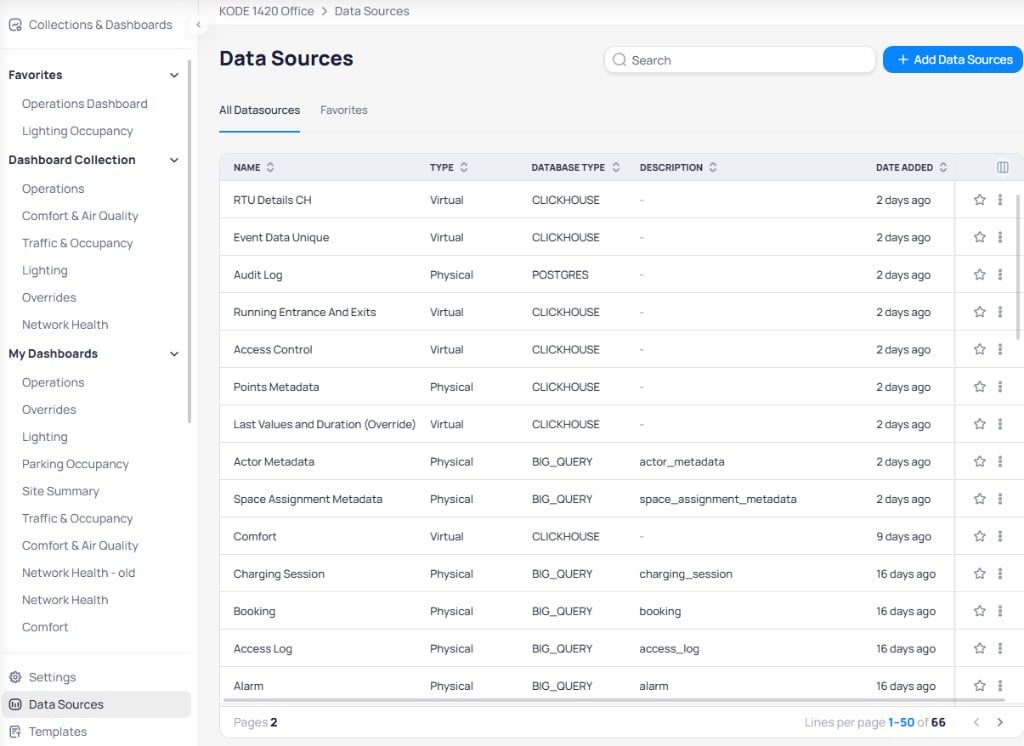
The Data Sources page shows each source's type (Physical or Virtual) and database engine side by side.
 ## Physical tables store rows; virtual tables compute them
* A **physical** source is a materialized table. The rows already exist. They are direct pulls from the KODE backend. Point Time Series Real-Time is the canonical example: every reading is a stored row.
* A **virtual** source is a **view**: a SQL expression that runs against one or more physical tables when queried. Nothing is stored; the rows are derived each time. Point Time Series **Last Value** is a virtual view that returns the most recent reading per sensor. See [Key data sources](/products/building-bi/data-sources#key-data-sources).
Physical tables are the warehouse shelves. Virtual tables are standing instructions for assembling a custom order from those shelves on request.
Because a virtual table re-derives its rows on every query, cost scales with how much work the query does. Light reshaping (like last value per point) is cheap. Heavy, high-dimension aggregation is not.
## Choose physical or virtual
| Prefer a physical source when… | Prefer a virtual source when… |
| ------------------------------------------------------ | ---------------------------------------------------- |
| Rows should already exist | You need a light, editable reshape for real-time use |
| Query-time cost must stay low for heavy transforms | You are prototyping a reshape |
| Historical trending needs a stable materialized result | The view is simple and stays optimized |
When you hit a calculated column or metric ceiling — for example, no window functions or aggregations of aggregations — put that logic in a virtual table SQL view. See [Calculated fields](/products/building-bi/reference/calculated-fields) and [Database types](/products/building-bi/data-sources#database-types).
* Virtual tables are quick to create and edit, but they recompute every time and can become slow on large datasets.
* Editing a virtual source's SQL is organization-wide. It affects every dashboard in your organization that uses it. It does not change other organizations. Validate before saving.
* Virtual tables can be built on ClickHouse and PostgreSQL, but not BigQuery.
* A "Not Optimized" status on a virtual source is a common hidden cause of slow dashboards. See [Dashboard performance](/products/building-bi/concepts/dashboard-performance).
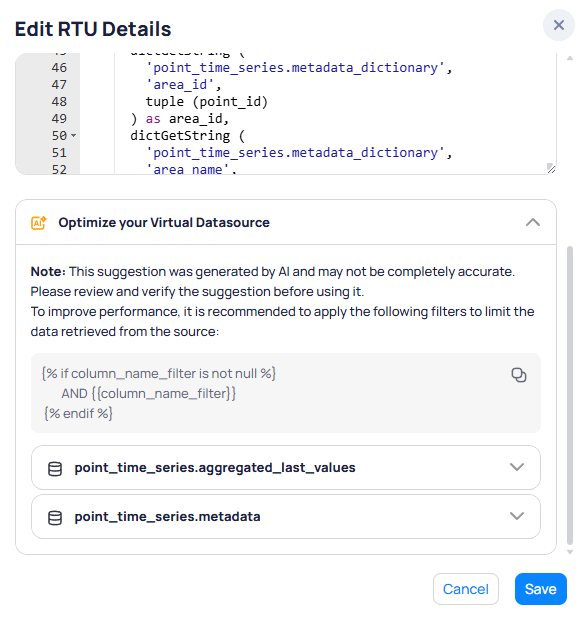
Building BI can suggest filters to tighten a virtual source. Review suggestions before you save. They affect every dashboard in your organization that uses the source.
## Physical tables store rows; virtual tables compute them
* A **physical** source is a materialized table. The rows already exist. They are direct pulls from the KODE backend. Point Time Series Real-Time is the canonical example: every reading is a stored row.
* A **virtual** source is a **view**: a SQL expression that runs against one or more physical tables when queried. Nothing is stored; the rows are derived each time. Point Time Series **Last Value** is a virtual view that returns the most recent reading per sensor. See [Key data sources](/products/building-bi/data-sources#key-data-sources).
Physical tables are the warehouse shelves. Virtual tables are standing instructions for assembling a custom order from those shelves on request.
Because a virtual table re-derives its rows on every query, cost scales with how much work the query does. Light reshaping (like last value per point) is cheap. Heavy, high-dimension aggregation is not.
## Choose physical or virtual
| Prefer a physical source when… | Prefer a virtual source when… |
| ------------------------------------------------------ | ---------------------------------------------------- |
| Rows should already exist | You need a light, editable reshape for real-time use |
| Query-time cost must stay low for heavy transforms | You are prototyping a reshape |
| Historical trending needs a stable materialized result | The view is simple and stays optimized |
When you hit a calculated column or metric ceiling — for example, no window functions or aggregations of aggregations — put that logic in a virtual table SQL view. See [Calculated fields](/products/building-bi/reference/calculated-fields) and [Database types](/products/building-bi/data-sources#database-types).
* Virtual tables are quick to create and edit, but they recompute every time and can become slow on large datasets.
* Editing a virtual source's SQL is organization-wide. It affects every dashboard in your organization that uses it. It does not change other organizations. Validate before saving.
* Virtual tables can be built on ClickHouse and PostgreSQL, but not BigQuery.
* A "Not Optimized" status on a virtual source is a common hidden cause of slow dashboards. See [Dashboard performance](/products/building-bi/concepts/dashboard-performance).
Building BI can suggest filters to tighten a virtual source. Review suggestions before you save. They affect every dashboard in your organization that uses the source.
 ## Next steps
Fix virtual table performance in Data Sources.
See the most common physical and virtual Point Time Series pair.
## Next steps
Fix virtual table performance in Data Sources.
See the most common physical and virtual Point Time Series pair.