> ## Documentation Index
> Fetch the complete documentation index at: https://documentation.kodelabs.com/llms.txt
> Use this file to discover all available pages before exploring further.
# Choosing visualizations
> Choose Building BI chart and table types based on the question, data shape, and audience.
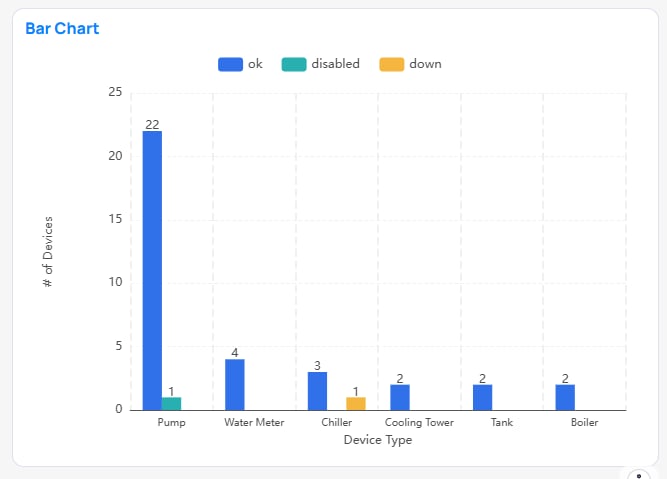
The right chart answers the viewer's question with the least effort. Start from the question and the shape of the data — comparison, trend, part-to-whole, distribution, single value, spatial — and the candidate list narrows quickly.
A comparison question usually points to a bar chart. Exact cell values usually point to a table. Match the visual to the read, not to what looks dense.
 ## Match the question
| The viewer wants to… | Data shape | Typical choices |
| ----------------------------- | ------------------- | ---------------------------------------------------------------------------------------------------------------------------------------------------------------------------------------------------------------------------------------------------------------- |
| Compare items | Categorical | [Bar](/products/building-bi/reference/chart-types#bar), [Horizontal Bar](/products/building-bi/reference/chart-types#horizontal-bar), [Polar Bar](/products/building-bi/reference/chart-types#polar-bar) |
| See change over time | Time series | [Line](/products/building-bi/reference/chart-types#line), [Time Series](/products/building-bi/reference/chart-types#time-series), [Line Area](/products/building-bi/reference/chart-types#line-area), [Combo](/products/building-bi/reference/chart-types#combo) |
| See when something was active | Intervals over time | [Timeline](/products/building-bi/reference/chart-types#timeline) |
| See part-to-whole | Proportional | [Pie](/products/building-bi/reference/chart-types#pie), [Treemap](/products/building-bi/reference/chart-types#treemap), [Sunburst](/products/building-bi/reference/chart-types#sunburst), [Stacked Bar](/products/building-bi/reference/chart-types#stacked-bar) |
| Read one key number | Single value | [Card](/products/building-bi/reference/chart-types#card), [Number](/products/building-bi/reference/chart-types#number-target), [Gauge](/products/building-bi/reference/chart-types#gauge) |
| Spot distribution or outliers | Statistical | [Boxplot](/products/building-bi/reference/chart-types#boxplot), [Scatter](/products/building-bi/reference/chart-types#scatter), [Heatmap](/products/building-bi/reference/chart-types#heatmap) |
| Look up exact values | Tabular | See [Table types](#table-types) |
| Understand flow | Flow | [Sankey](/products/building-bi/reference/chart-types#sankey) |
| See where, spatially | Spatial | [Graphics](/products/building-bi/reference/chart-types#graphics), [Picture](/products/building-bi/reference/chart-types#picture) |
| Navigate or contextualize | Utility | [Slicer](/products/building-bi/reference/chart-types#slicer), [Navigation](/products/building-bi/reference/chart-types#navigation), [Text](/products/building-bi/reference/chart-types#text) |
## Table types
| Choose… | When… |
| -------------------------------------------------------------------------- | ------------------------------------------------------- |
| [Raw](/products/building-bi/reference/chart-types#table-raw) | Individual rows matter (audit, export, troubleshooting) |
| [Aggregated](/products/building-bi/reference/chart-types#table-aggregated) | You need one summary number per group |
| [Pivot](/products/building-bi/reference/chart-types#table-pivot) | You need a grid across two dimensions |
A pivot table folds a hierarchy down the rows and spreads a dimension across the columns — useful when exact values and a two-way breakdown both matter.
## Match the question
| The viewer wants to… | Data shape | Typical choices |
| ----------------------------- | ------------------- | ---------------------------------------------------------------------------------------------------------------------------------------------------------------------------------------------------------------------------------------------------------------- |
| Compare items | Categorical | [Bar](/products/building-bi/reference/chart-types#bar), [Horizontal Bar](/products/building-bi/reference/chart-types#horizontal-bar), [Polar Bar](/products/building-bi/reference/chart-types#polar-bar) |
| See change over time | Time series | [Line](/products/building-bi/reference/chart-types#line), [Time Series](/products/building-bi/reference/chart-types#time-series), [Line Area](/products/building-bi/reference/chart-types#line-area), [Combo](/products/building-bi/reference/chart-types#combo) |
| See when something was active | Intervals over time | [Timeline](/products/building-bi/reference/chart-types#timeline) |
| See part-to-whole | Proportional | [Pie](/products/building-bi/reference/chart-types#pie), [Treemap](/products/building-bi/reference/chart-types#treemap), [Sunburst](/products/building-bi/reference/chart-types#sunburst), [Stacked Bar](/products/building-bi/reference/chart-types#stacked-bar) |
| Read one key number | Single value | [Card](/products/building-bi/reference/chart-types#card), [Number](/products/building-bi/reference/chart-types#number-target), [Gauge](/products/building-bi/reference/chart-types#gauge) |
| Spot distribution or outliers | Statistical | [Boxplot](/products/building-bi/reference/chart-types#boxplot), [Scatter](/products/building-bi/reference/chart-types#scatter), [Heatmap](/products/building-bi/reference/chart-types#heatmap) |
| Look up exact values | Tabular | See [Table types](#table-types) |
| Understand flow | Flow | [Sankey](/products/building-bi/reference/chart-types#sankey) |
| See where, spatially | Spatial | [Graphics](/products/building-bi/reference/chart-types#graphics), [Picture](/products/building-bi/reference/chart-types#picture) |
| Navigate or contextualize | Utility | [Slicer](/products/building-bi/reference/chart-types#slicer), [Navigation](/products/building-bi/reference/chart-types#navigation), [Text](/products/building-bi/reference/chart-types#text) |
## Table types
| Choose… | When… |
| -------------------------------------------------------------------------- | ------------------------------------------------------- |
| [Raw](/products/building-bi/reference/chart-types#table-raw) | Individual rows matter (audit, export, troubleshooting) |
| [Aggregated](/products/building-bi/reference/chart-types#table-aggregated) | You need one summary number per group |
| [Pivot](/products/building-bi/reference/chart-types#table-pivot) | You need a grid across two dimensions |
A pivot table folds a hierarchy down the rows and spreads a dimension across the columns — useful when exact values and a two-way breakdown both matter.
 ## Top N vs scrolling
| Choose Top N when… | Choose scrolling when… |
| ---------------------------------------------------------- | -------------------------------------------- |
| Extremes are the message | Viewers may need items past the first screen |
| The dashboard is glance-only (for example, a wall display) | The audience will interact with the chart |
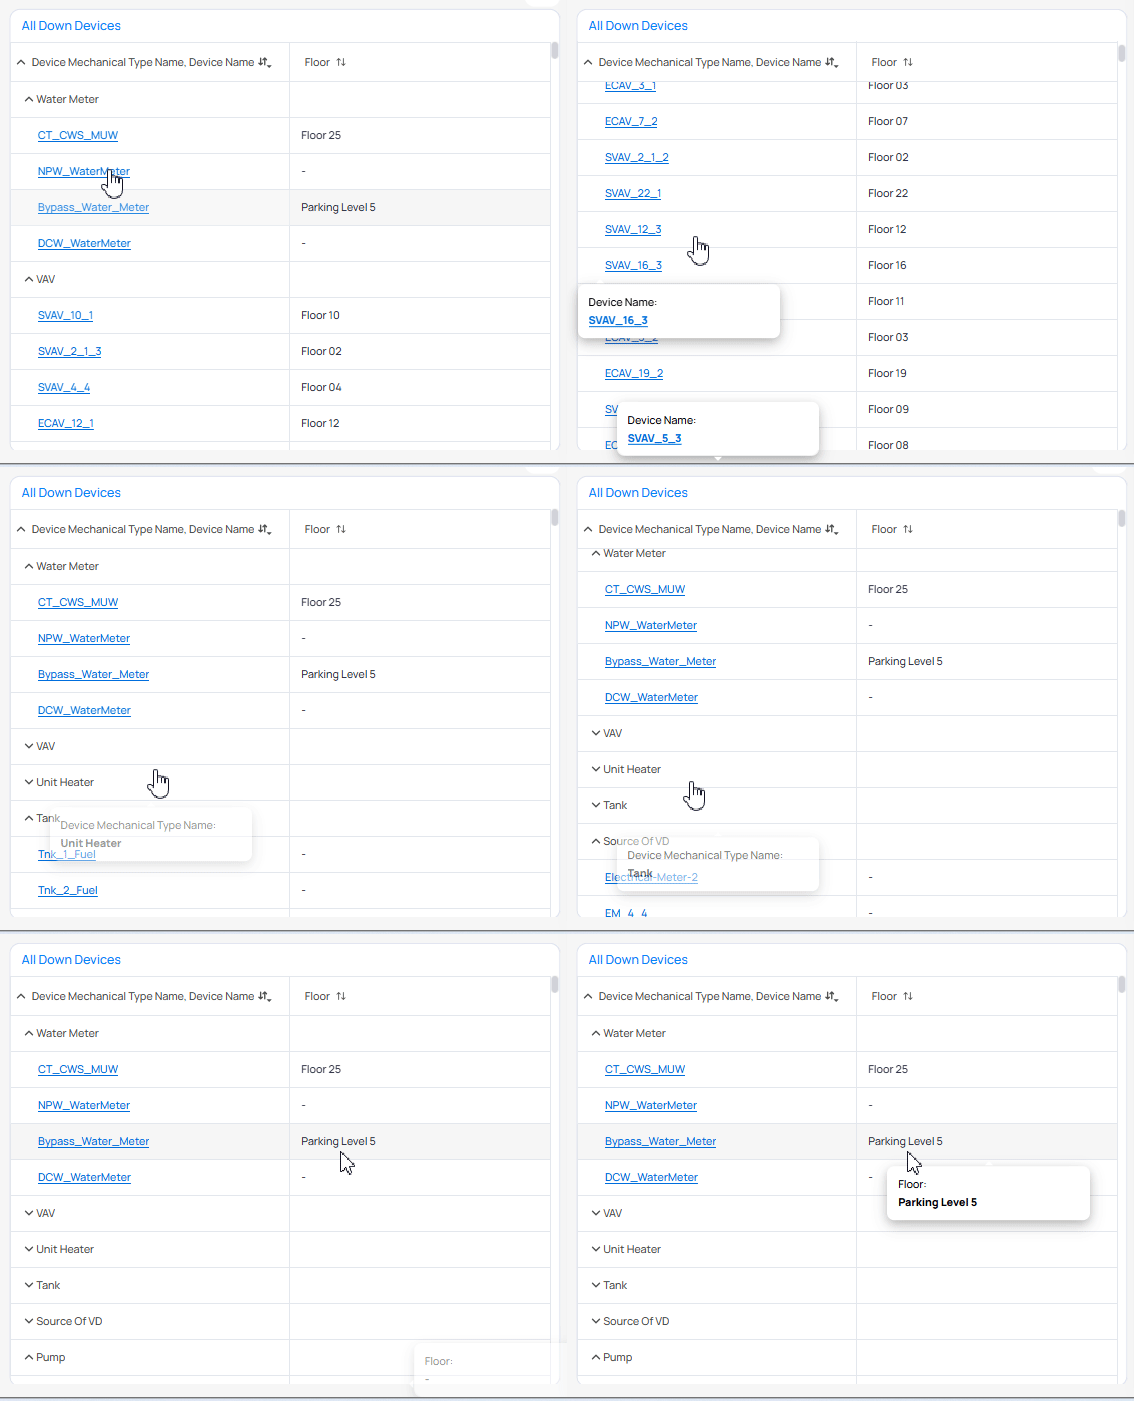
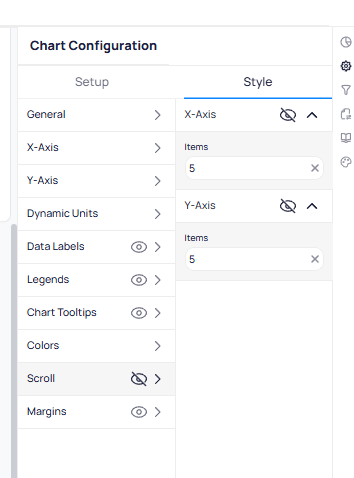
Label Top N cuts so viewers know data is hidden. For interactive ops dashboards, a soft top (about 20) with a scrollbar often beats a hard cut. See [Filter options](/products/building-bi/reference/filter-options#top-n-filters) and [Zoom and scroll](/products/building-bi/reference/chart-styling-options#zoom-and-scroll).
## Top N vs scrolling
| Choose Top N when… | Choose scrolling when… |
| ---------------------------------------------------------- | -------------------------------------------- |
| Extremes are the message | Viewers may need items past the first screen |
| The dashboard is glance-only (for example, a wall display) | The audience will interact with the chart |
Label Top N cuts so viewers know data is hidden. For interactive ops dashboards, a soft top (about 20) with a scrollbar often beats a hard cut. See [Filter options](/products/building-bi/reference/filter-options#top-n-filters) and [Zoom and scroll](/products/building-bi/reference/chart-styling-options#zoom-and-scroll).
 ## Audience and consistency
* A chart should be valuable before you add drill-through or cross-filtering. See [Drill-through filters](/products/building-bi/concepts/drill-through-filters).
* Match the visual to the audience. An operator on a wall display needs a different chart than an analyst exploring data. See [Philosophy](/products/building-bi/concepts/philosophy).
* When two types both fit, prefer the one your dashboards already use for that question.
## Next steps
Look up Setup fields for every widget type.
Style widgets and apply defaults.
## Audience and consistency
* A chart should be valuable before you add drill-through or cross-filtering. See [Drill-through filters](/products/building-bi/concepts/drill-through-filters).
* Match the visual to the audience. An operator on a wall display needs a different chart than an analyst exploring data. See [Philosophy](/products/building-bi/concepts/philosophy).
* When two types both fit, prefer the one your dashboards already use for that question.
## Next steps
Look up Setup fields for every widget type.
Style widgets and apply defaults.